New JSDesktop Application Release

Nov 1 2017

JSServices is pleased to announce Stockholm Release 3904 for JSDesktop Version 1.0.4 with many new and exciting features including:

  • New Customizable MarketColor Grids – The JSDesktop now offers different sized market symbol grid plans that range from specific single markets to sectors and complete full grid strategy focus plans.
  • New Trader Reports – The Desktop produces Excel file market summary reports in different number formats
  • New CSV File Format – The Desktop now produces CSV file formats in addition to XLS, XML and JSON
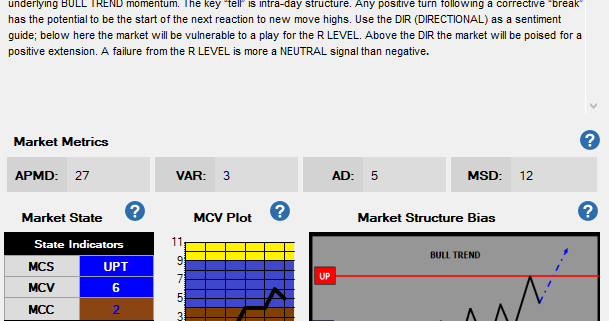
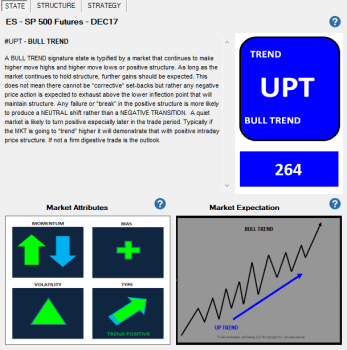
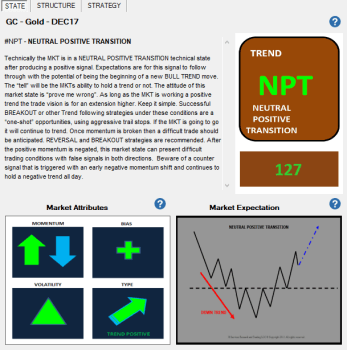
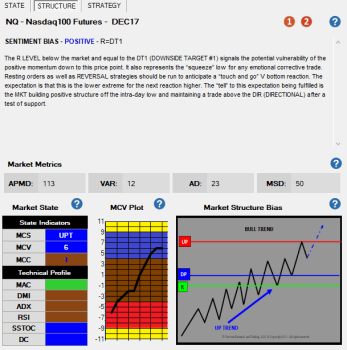
  • New MSB tag reference number – A numeric value that defines the market STATE and R LEVEL position or MSB (Market Structure Bias) is presented on the Desktop STATE tab. The MSB value is also included in the in the data utility output files to assist in standardizing automated trading systems to specific conditions.
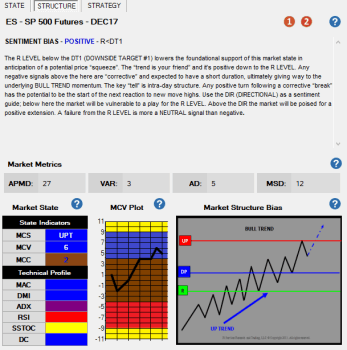
  • New and updated market STRUCTURE commentary focused on the Sentiment Bias skew
  • New Market Metrics section included in the STRUCTURE tab, Trader Reports and integration files.
  • New PlayBook STRATEGY commentary and format.
  • New Options Analysis as a 2nd view in the PlayBook STRATEGY tab.
  • New and updated HELP tutorials with enhanced messaging

Anyone who is currently using the Desktop application should revisit the HELP tutorials and learn about the new features to see the difference and clarity you will have in your trading using this significantly enhanced comprehensive trading tool.

Please contact us directly at info@jsservices.com if you would like a consultation on how the JSDesktop can assist you in normalizing your trading into a more structured trading approach.


MarketColor as the basis for a Structured Trading Approach

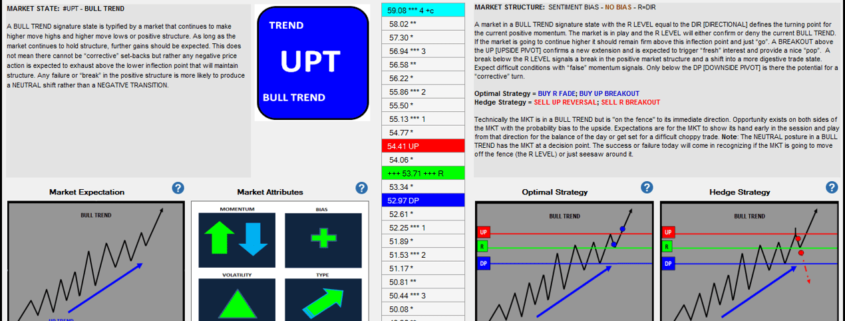
MarketColor defines the context of the current condition or market STATE. It is the underlying “technical” tone or environment for the trade period and should be used as the basis to standardize trading tactics and create a more structured trading approach.

Many traders get caught up in the moment and fail to account for the bigger picture or context in which the moments are occurring. Armed with a quiver of trading tactics, which they strive to execute consistently, they have little basis on how to value one opportunity from the next. As long as the signals are the same, they are the same signal and have the same value right? Wrong! The context in which the signal is occurring determines the value any a tactic signal has. By aligning trading tactics with complimentary market state condition traders are able to standardize their approach and create a value weighting system for their signals.

Trading is difficult and complex. Strategy and tactics must be unified and simplified if they are going to be part of a sustainable trade plan.

JSServices MarketColor analytics begins the simplification process by classifying conditions into unique market STATES. Each STATE has its own set of attributes which individually are the same as other STATEs but when combined with characteristics, produce a unique expectation for each STATE. Trading tactics can be standardized to these nuances to create a structured approach where the alignment to each market STATE determines the value of the opportuinity.

Practical Application

MarketColor State

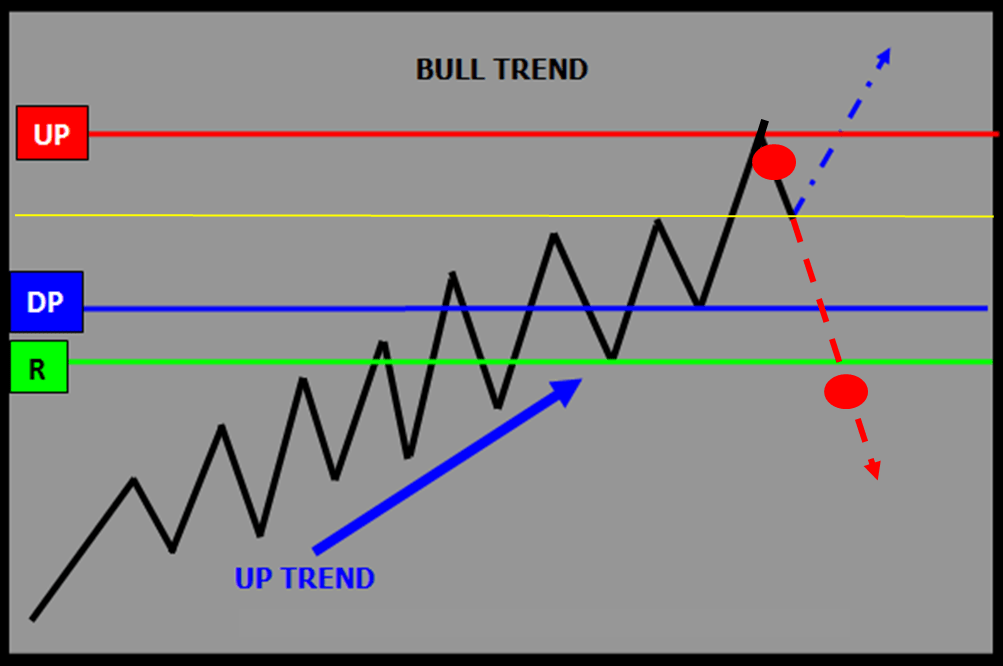
A general type BULL TREND (#UPT) has the same attributes as a signature NEUTRAL POSITIVE TRANSIITON (#NPT) MARKET STATE. The characteristics of a #UPT are defined as a steady positive trend verses a #NPT which is more indecisive and potentially volatile as the market has yet to confirm a transition into a new trend. Trading tactics can be standardized to these facts to create a structured rule based approach that is aligned with the characteristics of each MARKET STATE. A basic practical application would be to adjust risk parameters either on the amount of leverage used or stop placement. A #UPT has steady positive trend characteristics and should incorporate wider stop placement verses a #NPT which should use tighter risk parameters as its positive trend characteristic are not confirmed. Adding this structure a trade method aligns what is more likely to occur with the applied risk. Risk more in STATES that are likely to support a tactic signal as less in STATES that are not as clear.


                                                         MarketColor State (MCS)

MarketColor Technical Profile

The MarketColor technical profile can also be incorporated to add additional structure to a trading method as a criteria filter for signal acceptance or market selection. In this example both the ES and NQ are in BULL TREND (#UPT) MARKET STATES however the ES technical profile is showing signs of being overbought with a negative RED indicator in the RSI (Relative Strength) and a YELLOW extreme signal in the SSTOC (Slow Stochastic). NQ is generating a new buy signal (GREEN) in the MAC (Moving Average) system but this is not supported by the DMI or ADX indicators. Of the 2 markets neither has a positive fact foundation but the NQ ‘s foundation is less risky, as overbought condition can produce abrupt negative corrections. A basic criteria filter would be to only accept buy signals in a BULL TREND when the RSI and SSTOC are either in neutral (BROWN) or supporting color (BLUE, GREEN or AQUA). If this condition is not true then no buy signals should be accepted. This filter may miss some good opportunities but is in alignment with what is more likely to occur and over time will produce a more consistent result.


                                MarketColor Technical Profile (Structure Tab)

Aligning trading tactics with complimentary technical conditions provides structure by standardizing


Creating a Structured Trading Approach

JSAnalytics offers a foundation to create a more structured trading approach. It does this by providing the basic ingredients needed to make any clear decision – facts. In terms of trading the analytics are objective quantitative measurable market truths. The numbers “don’t lie” and need no subjective interpretation. No matter what your opinion is, the facts remain the facts. For a trader this is powerful, as our internal dialog is always second guessing if the decisions we have made are correct. Without a benchmark “fact check” it is easy for emotions to influence trading and cloud the decision making process . By creating a structured trading approach built on a fact foundation doubtful emotions are replaced with confidence and resolve.  Market movement is seen for what it is with no emotional attachment. Execution of a trade plan is methodical and structured. The process offers a quantifiable way to measure performance and improve consistency, as every decision made can be compared to the same decisions made in the same context and structure. As a trader you are an observer of real time market movement within defined context and have a structured trade plan to anticipate and capture opportunity as well as a framework to improve the process of doing it.

How do you get started creating a more structured trading approach? By aligning trading tactics and methods to a FACT FOUNDATION.

There a 3 factual contexts that every trader and trading system must account for and be aligned with:

  • The current market STATE and the characteristics that define it.
  • The current STRUCTURE and its influence on the STATE expectations
  • The STRATEGY themes that are inherent in STATE and STRUCTURE bias dynamic

JSServices identifies a markets STATE, STRUCTURE and STRATEGY themes as the FACT FOUNDATION to create a more structured trading approach with is MarketColor, PriceMap and PlayBook analytics.

MarketColor defines the context of the current condition or market STATE. It is the underlying “technical” tone or environment. Just as a professional athlete will alter their tactics based on weather conditions, playing surface and opponents strength, so to a trader must standardize trading methods to the characteristics of the market STATE. MarketColor objectively provides these facts so a structured approach can be developed for each uniquely classified market STATE condition into a simple IF/THEN approach. IF its rainy, cold and playing on a natural field THEN the strategy is to play more conservatively. IF playing indoors on artificial surface THEN execute a faster strategy. In trading it as not as simple as this as the context or STATE can change during the “game” session. We need more facts than just what the characteristics of the condition or state “is” we need to know when those conditions or facts are changing or are no longer true. For this we need to know what the STRUCTURE is that defines the market STATE or the JSServices PriceMap.

Market STRUCTURE is the price framework that defines the market STATE. As long as price action is holding STRUCTURE then the definition of the STATE is true and the characteristics that define it should be expected to influence trading conditions. If price action is not holding structure it is a “tell” that the market STATE is in transition to a new STATE and trading conditions are changing. In general markets that hold structure are easier to predict as their characteristics are known. The characteristics of a market that is transitioning to a new  STATE are not as clear as we do not know what STATE the market is transitioning into. The market STRUCTURE framework or PriceMap identifies the price points where the market will make a decision to hold structure and persist or break structure and transition. It is at these price points where liquidity is the highest, risk is the lowest and opportunity the greatest. The PriceMap provides the framework to create a structured trading approach that is unified across all markets. To achieve alpha however we must anticipate opportunity and have a STRATEGY that differentiates the value between opportunities.  We need a guide or “PlayBook”.

JSServices PlayBook offers an objective FACT FOUNDATION to improve consistency by identifying the STRATEGY themes that are expected to dominate price action.  IF the MKT is in this STATE with this STRUCTURE THEN this is the optimal STRATEGY. If however there is a break in STRUCTURE then this HEDGE STRATEGY should be executed to capture the shift in STATE. The PlayBook removes the question of “What to do?” by presenting the best opportunity for the current STATE and STRUCTURE bias. Professional sports teams have certain plays designed for certain defenses, position on the field or time left on the clock. These plays are structured, optimized, practiced and executed consistently. During the playoffs is when we really see the beauty of a well orchestrated game plan executed by the victor. Every series the correct “play” is matched with the context of the game at the moment. As a trader your are the coach or director of your team of tactics. By having a FACT FOUNDATION you know the STATE expectation and characteristics prior to playing the game. With trading however you do not need to play every play and can be selective to only participate in STRUCTURES that favor your success. When you do trade it can be with STRATEGIES that have been optimized through consistent execution in the same STATE and same STRUCTURE no matter what market or asset class.

Trading is one of the most difficult, exciting, demanding, fulfilling businesses. Without a structured approach the challenging aspects of trading can quickly overwhelm frustrate us. When trading is done with a structured approach however the positive attributes of the vocation begin to shine and feed on themselves providing clarity to every individuals unique path to success.

Request a demo of our Desktop application which will allow you to integrate al JSServices analytics into your workflow and create a more structured trading approach.


Full Risk Disclosure

The following statement is furnished pursuant to Commodity Futures Trading Commission (“CFTC”) Regulation 1.55(c).This brief statement does not disclose all of the risks and other significant aspects of trading in futures, forex and options. In light of the risks, you should undertake such transactions only if you understand the nature of the contracts (and contractual relationships) into which you are entering and the extent of your exposure to risk. Trading in futures, forex and options is not suitable for many members of the public. You should carefully consider whether trading is appropriate for you in light of your experience, objectives, financial resources and other relevant circumstances.

The risk of loss in trading commodity futures contracts and foreign currency can be substantial. You should, therefore, carefully consider whether such trading is suitable for you in light of your circumstances and financial resources. You should be aware of the following points:

1. You may sustain a total loss of the funds that you deposit with your broker to establish or maintain a position in the commodity futures market or foreign exchange market, and you may incur losses beyond these amounts. If the market moves against your position, you may be called upon by your broker to deposit a substantial amount of additional margin funds, on short notice, in order to maintain your position. If you do not provide the required funds within the time required by your broker, your position may be liquidated at a loss, and you will be liable for any resulting deficit in your account.

2. The funds you deposit with a futures commission merchant for trading futures and forex positions are not protected by insurance in the event of the bankruptcy or insolvency of the futures commission merchant, or in the event your funds are misappropriated.

3. The funds you deposit with a futures commission merchant for trading futures or forex positions are not protected by the Securities Investor Protection Corporation even if the futures commission merchant is registered with the Securities and Exchange Commission as a broker or dealer.

4. The funds you deposit with a futures commission merchant are generally not guaranteed or insured by a derivatives clearing organization in the event of the bankruptcy or insolvency of the futures commission merchant, or if the futures commission merchant is otherwise unable to refund your funds. Certain derivatives clearing organizations, however, may have programs that provide limited insurance to customers. You should inquire of your futures commission merchant whether your funds will be insured by a derivatives clearing organization and you should understand the benefits and limitations of such insurance programs.

5. The funds you deposit with a futures commission merchant are not held by the futures commission merchant in a separate account for your individual benefit. Futures commission merchants commingle the funds received from customers in one or more accounts and you may be exposed to losses incurred by other customers if the futures commission merchant does not have sufficient capital to cover such other customers’ trading losses.

6. The funds you deposit with a futures commission merchant may be invested by the futures commission merchant in certain types of financial instruments that have been approved by the Commission for the purpose of such investments. Permitted investments are listed in Commission Regulation 1.25 and include: U.S. government securities; municipal securities; money market mutual funds; and certain corporate notes and bonds. The futures commission merchant may retain the interest and other earnings realized from its investment of customer funds. You should be familiar with the types of financial instruments that a futures commission merchant may invest customer funds in.

7. Futures commission merchants are permitted to deposit customer funds with affiliated entities, such as affiliated banks, securities brokers or dealers, or foreign brokers. You should inquire as to whether your futures commission merchant deposits funds with affiliates and assess whether such deposits by the futures commission merchant with its affiliates increases the risks to your funds.

8. You should consult your futures commission merchant concerning the nature of the protections available to safeguard funds or property deposited for your account.

9. Under certain market conditions, you may find it difficult or impossible to liquidate a position. This can occur, for example, when the market reaches a daily price fluctuation limit (“limit move”).

10. All futures, forex and options positions involve risk, and a “spread” position may not be less risky than an outright “long” or “short” position.

11. The high degree of leverage (gearing) that is often obtainable in futures and forex trading because of the small margin requirements can work against you as well as for you. Leverage (gearing) can lead to large losses as well as gains.

12. In addition to the risks noted in the paragraphs enumerated above, you should be familiar with the futures commission merchant you select to entrust your funds for trading futures positions. As of July 12, 2014, the Commodity Futures Trading Commission requires each futures commission merchant to make publicly available on its Web site firm specific disclosures and financial information to assist you with your assessment and selection of a futures commission merchant. Information regarding this futures commission merchant may be obtained by visiting the websites of the respective FCM partner of NinjaTrader Brokerage: Dorman Trading (www.dormantrading.com), Phillip Capital (www.phillipcapital.com), FXCM (www.fxcm.com)

ALL OF THE POINTS NOTED ABOVE APPLY TO ALL FUTURES AND FOREX TRADING WHETHER FOREIGN OR DOMESTIC. IN ADDITION, IF YOU ARE CONTEMPLATING TRADING FOREIGN FUTURES OR OPTIONS CONTRACTS, YOU SHOULD BE AWARE OF THE FOLLOWING ADDITIONAL RISKS:

13. Foreign futures transactions involve executing and clearing trades on a foreign exchange. This is the case even if the foreign exchange is formally “linked” to a domestic exchange, whereby a trade executed on one exchange liquidates or establishes a position on the other exchange. No domestic organization regulates the activities of a foreign exchange, including the execution, delivery, and clearing of transactions on such an exchange, and no domestic regulator has the power to compel enforcement of the rules of the foreign exchange or the laws of the foreign country. Moreover, such laws or regulations will vary depending on the foreign country in which the transaction occurs. For these reasons, customers who trade on foreign exchanges may not be afforded certain of the protections which apply to domestic transactions, including the right to use domestic alternative dispute resolution procedures. In particular, funds received from customers to margin foreign futures transactions may not be provided the same protections as funds received to margin futures transactions on domestic exchanges. Before you trade, you should familiarize yourself with the foreign rules which will apply to your particular transaction.

14. Finally, you should be aware that the price of any foreign futures or option contract and, therefore, the potential profit and loss resulting therefrom, may be affected by any fluctuation in the foreign exchange rate between the time the order is placed and the foreign futures contract is liquidated or the foreign option contract is liquidated or exercised.

THIS BRIEF STATEMENT CANNOT, OF COURSE, DISCLOSE ALL THE RISKS AND OTHER ASPECTS OF THE COMMODITY AND FOREIGN CURRENCY MARKETS.


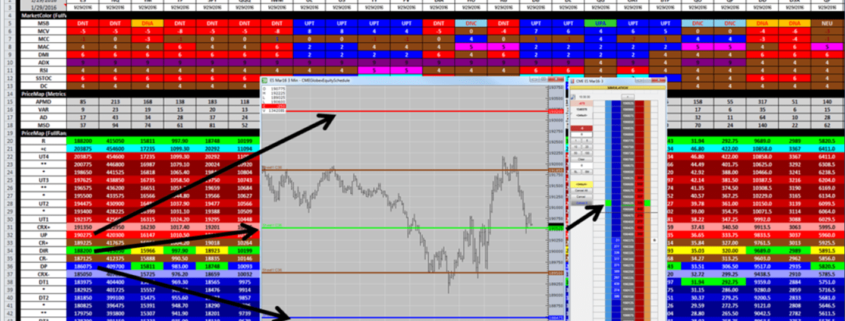
Dynamic Excel Linking

JS AMP Futures Forum Launch

MAR 29 2017

JSServices launches a discussion section on AMP Futures chat forum. The goal of the JSServices section is to provide interactive dialog on topics relating to market state awareness to improve your ability to make intuitive decisions and trade “in the zone”. Forum Link.


GOLD Risk Structure APR 2017

Risk Structure outlines the context of the current risk environment based on the markets position within the PriceMap MARKET STRUCTURE framework. Click here to learn more about using risk and market structure to create a systematic approach to managing risk and fear.

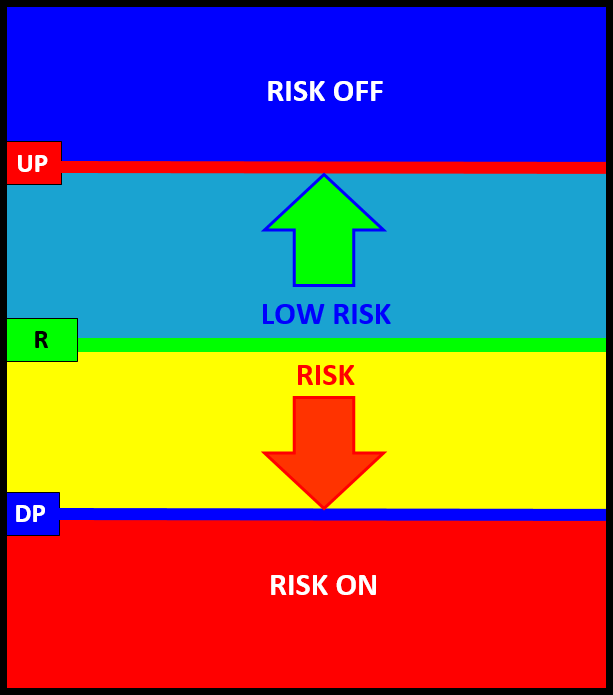
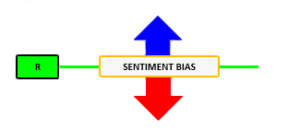
The example below assumes a net long position with a RISK ON posture signaling a negative price expectation and a RISK OFF posture a positive price expectation. The current Risk Structure for Gold has the sentiment bias (R-LEVEL) equal to the CriticalRange mid-point.

Example – GOLD APRIL 2017

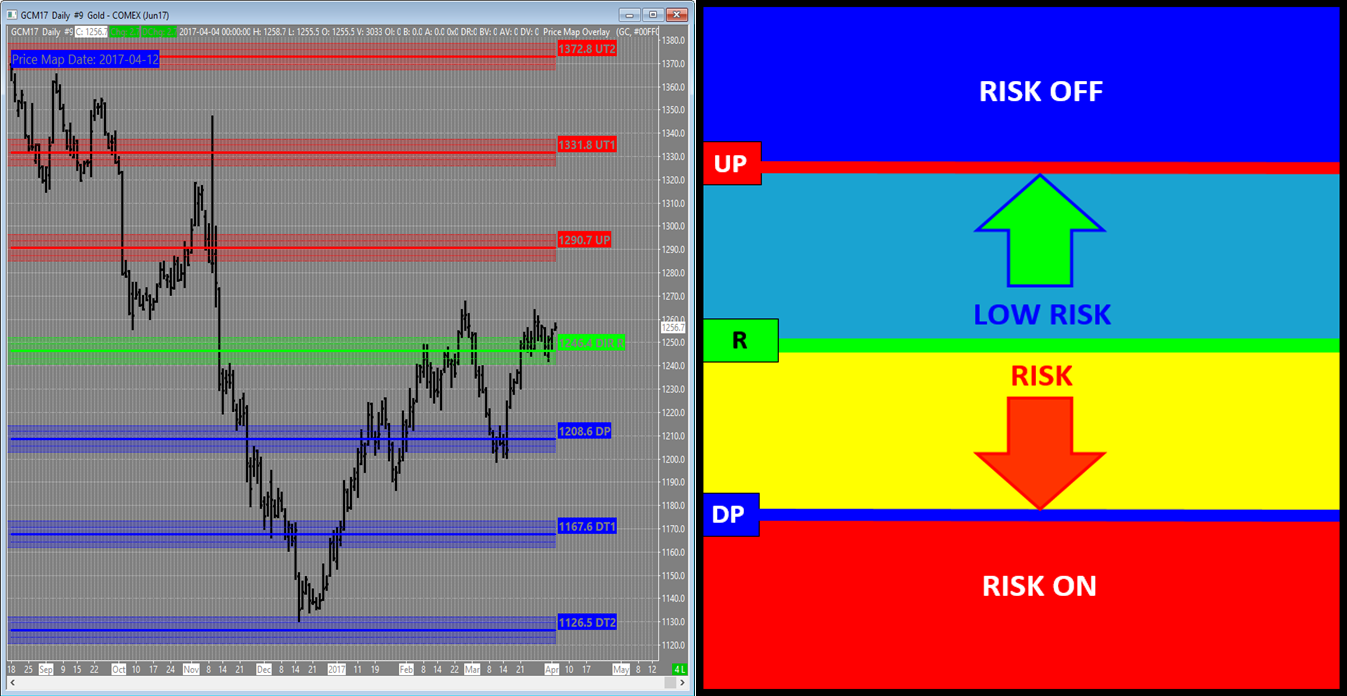
R-LEVEL = 1246.4 | UP (Upside Pivot) = 1290.7  |  DP (Downside Pivot) = 1208.6

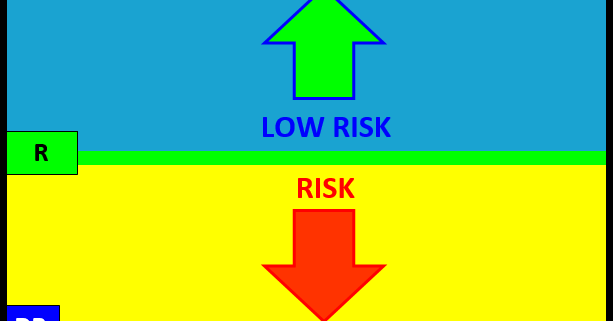
The image below identifies GOLD is basically “at Risk” which is defined by the 1246.4 R-LEVEL. If the market is going to transition higher it will maintain a trade above this price point and stay in a “LOW RISK” posture in terms of a long position, up to the 1290.7 UP (Upside Pivot). At this point the market will be at a point of equilibrium in terms of committing to a new “up trend” and a RISK OFF posture or maintaining a position of LOW RISK.

Daily GOLD May17 Chart with Monthly PriceMap

Hedge Strategy Example (Net Long Position)

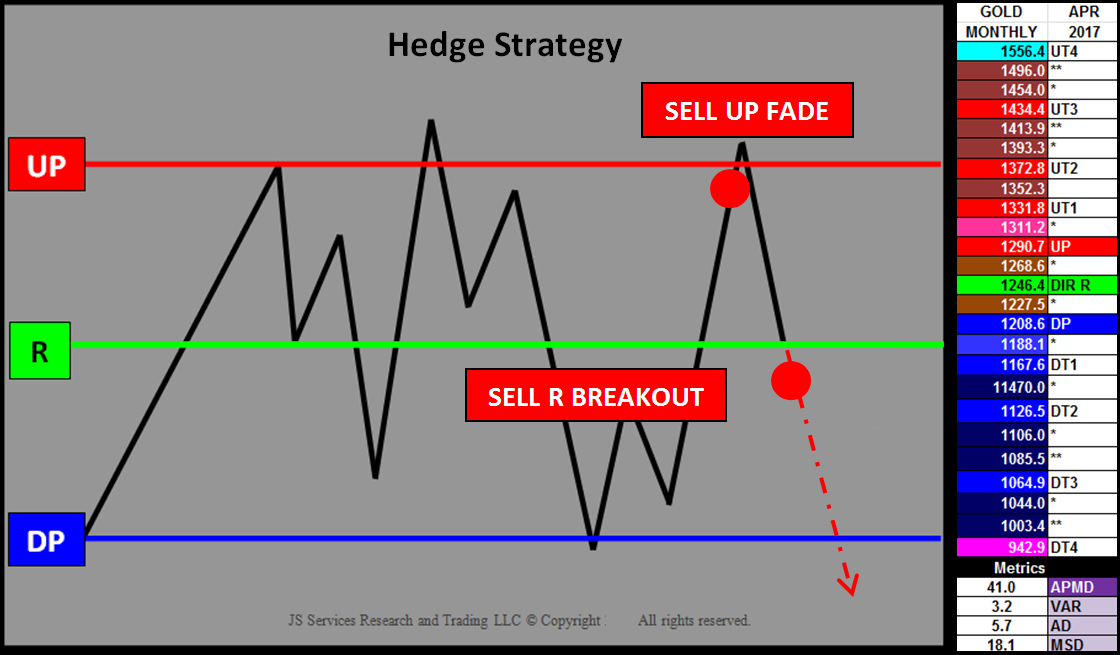
If GOLD is trading at the 1290.7 UP, a net long position has a profit give-back risk of around $35. This as this is the amount of profit that will be lost with a trade back down to the 1246.4 R-LEVEL which is a “normal” reaction that can be anticipated for this structure bias if the positive trend is not ready to commit. A Hedge Strategy can be implemented to reduce this risk, specifically a SELL UP FADE Hedge Strategy. IF the market price action is going to be contained within market structure THEN it will reject “in front” of the 1290.7 UP. A SELL UP FADE execution tactic can be used to protect unrealized profits with an objective of taking off the hedge at the 1246.4 R-LEVEL.

Hedge Strategy and GOLD Monthly April 2017 PriceMap
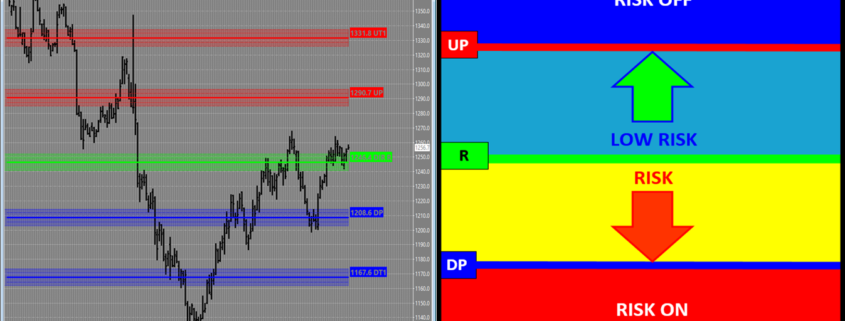
In addition to the protecting profits the Risk Structure also identifies where a hedge should be applied to protect losses. In the Hedge Strategy image above a SELL R BREAKOUT tactic can be implemented below the 1246.4. The 5.7 AD (Alert Distance) Metric can be used to confirm a “Breakout” signal (1246.4-5.7=1240.7) or a break under 1240.7, with the expectation that the market will shift into a RISK position down to the 1208.6 DP (Downside Pivot). Here again the market will be in a state of equilibrium, where it will either stabilize for a rally back up to the R-LEVEL sentiment bias or break structure and transition into a RISK ON Hedge position and potentially new Bear Trend targeting the 1126.5 DT2 (Downside Target#2).

Summary

Observing price action within Risk Structure provides clarity to the current condition and the value of an opportunity so proper risk management can be applied. Knowing where you are at risk is imperative to maintain a “fearless” focus by having the awareness of what RISK theme is currently dominating price action. The May17 Gold contract is currently trading near its 1246.7 R-LEVEL which is the sentiment bias for April 2017. Knowing this fact allows you to anticipate opportunity and implement hedge strategies.


Please send inquiries to info@jsservices.com.


Fear Factor – A Structured Approach to Risk Management

FEAR in trading is primarily related to financial ruin. If you are undercapitalized you fear that you will blow your account out. This emotion is overwhelming and becomes self-fulfilling following potential good decisions with bad choices.

Anxiety over losses is common but should not be. Losses are part of trading. They are inevitable and can be used to improve trading and trade management. It is important to understand the difference between taking a loss and being wrong. It is easy to feel that once you have gotten stopped out of a trade that your bias was wrong and sentiment has shifted. Most of the time it is just bad stop placement which may be based on what you can or are forced to afford. This does not mean you outlook is wrong just that your stop placement is. Poor stop placement may be the result of insufficient facts but in many instances it has its roots in other emotional decisions that lead to fear factors.

FOMO

Fear Of Missing Out is not real fear and is more related to being anxious. Real fear is gut wrenching, nauseating, emotional trauma. Anxiousness does add to anxiety by increasing risk. This is typically the result of a poor entry price from an emotional decision that disregards risks considerations in favor of satisfying the feeling of FOMO. This behavior is a typical precursor to adding leverage into the mix when the market goes against your emotional FOMO entry and you add size to dollar cost average. All too often the market continues to go against your position allowing fear to take over and cloud your subjective decision making process. Objective fact focus is replaced with “hope”. When the MKT Gods do not answer your prayers, fear overwhelms every fiber of your being. The consequence can actually produce physically effects like tightening of the throat and stomach cumulating in an emotional “I’m going to be ill, just make it stop get me out, I’m done!” response. The calculator comes out and identifies the account saving stop loss amount to cover, the order is entered, you accept your fate and then it’s over, you’re out of the market. Crushing frustration takes over, even anger that “the Algos are out to get me”, “these markets are impossible”. The price action against your bias continues for a moment as the market looks to do the same to other weak hands but with deeper pockets, which provides a sense of relief that you did not lose even more. Emotions start to settle about the same time the market momentum stabilizes and you realize that where you exited was actually near where you wanted to enter in the 1st place. At that moment the market spikes back to your original FOMO entry area. You reach for you mouse to enter again, albeit with token size, and the cycle continues. Either your stopped out again or if the market does go in your favor the gains from the small position only serve to reduce the amount of loss from being stopped out with leveraged. Your bias was correct but your account balance is diminished. The only gain is the frustration and doubt in your trading method which sets the foundation for a repeat of the same events.

NO FEAR — A Structured Approach to Risk Management

Breaking the grip of fear and anxious anxiety can be accomplished by creating a structured approach to trading;

Prerequisites

• Being properly capitalized is a prerequisite for creating a more objective standardized method.

• Understanding who you are, your core strengths, risk tolerances and how you will react in stressful situations is another requirement as a basis to developing a sustainable plan. For information on taking a Personality Profile assessment for self-identification discovery, please send inquiries to info@jsservices.com.

If you are properly capitalized and have a firm understanding of how your personality traits effect your trading, you can create a trade plan and risk management program that supports your unique path to success. The goal is to remove the emotional ups and downs of reactionary trading with a method that compliments a unique personality and is aligned with the structure of the market state. Market structure provides an outline to standardize the process by creating an execution framework to define risk and create a systematic approach.

Market Structure

Knowing the structure of the market State improves awareness by providing context to the current condition and its influence on a position or trade signal. This clarity instills confidence to overcome fear. With structure you have a benchmark to gauge what conditions provide opportunity and those that do not. Risk methods can be optimized with market structure to identify the value and risks associated with an opportunity.

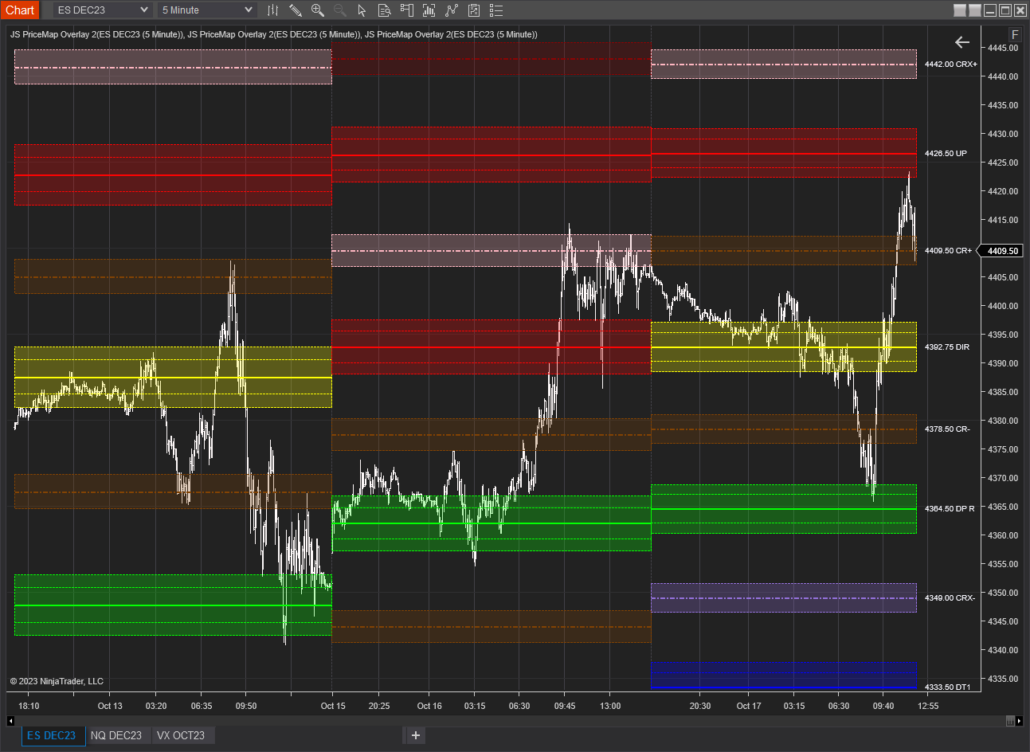
JSServices PriceMap analytics define the STRUCTURE of the market with 3 price points; a price band or CriticalRange and a Sentiment bias level (R LEVEL) which can be used to identify the risk profile of a market.

R-LEVEL

The R-LEVEL is the Structure point that defines “RISK” for the trade period as it represents the sentiment bias. Above this price point sentiment is positive and the market is in a LOW RISK posture having a bias for new gains. Below the R LEVEL sentiment is negative and the market is in a RISK position with a bias for new losses. Long trades entered closer to the R LEVEL will have a higher value than that of trades entered farther away because the risk of loss is at its lowest point with the greatest potential of reward from this price level. RISK OFF is a term used to define the risk environment and does not mean that trades established in this zone are “riskless”. In contrary they are at risk down to the R LEVEL, which is why trades entered near sentiment have the most value as they have the least amount of risk.

CriticalRange

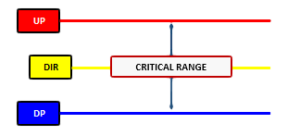
The CriticalRange  (UP-DP) sets the confirmation boundary of the RISK condition. In general above the UP (Upside Pivot) confirms the positive sentiment and RISK OFF condition with a higher price expectation and below the DP (Downside Pivot) confirms the negative sentiment RISK OFF position and lower price expectation.

Risk Structure

Market Structure can be used to identify the risk structure for a fundamental market position. Risk Structure outlines the context of the current risk environment based on the markets current position within the market structure framework.

The Risk Structure profile below assumes a NET LONG POSITION with a RISK ON posture signaling a negative price expectation and a RISK OFF posture a positive price expectation. This is an example when the sentiment bias R LEVEL is equal to the CriticalRange mid-point.

Balanced Risk Structure R=DIR

 Example – GOLD APRIL 2017

R-LEVEL = 1246.4 | UP (Upside Pivot) = 1290.7  |  DP (Downside Pivot) = 1208.6

In the example below GOLD is basically “at Risk” which is defined by the 1246.4 R-LEVEL. If the market is going to transition higher it will maintain a trade above this price point and stay in a “LOW RISK” posture in terms of a long position, up to the 1290.7 UP (Upside Pivot). At this point the market will be at a point of equilibrium in terms of committing to a new “up trend” and a RISK OFF posture or maintaining a position of LOW RISK.

Daily GOLD May17 Chart with Monthly PriceMap

Hedge Strategy Example (Net Long Position)

If GOLD is trading at the 1290.7 UP, a net long position has a profit give-back risk of around $35. This as this is the amount of profit that will be lost with a trade back down to the 1246.4 R-LEVEL which is a “normal” reaction that can be anticipated for this structure bias if the positive trend is not ready to commit. A Hedge Strategy can be implemented to reduce this risk, specifically a SELL UP FADE Hedge Strategy. IF the market price action is going to be contained within market structure THEN it will reject “in front” of the 1290.7 UP. A SELL UP FADE execution tactic can be used to protect unrealized profits with an objective of taking off the hedge at the 1246.4 R-LEVEL.

Hedge Strategy and GOLD Monthly April 2017 PriceMap
In addition to the protecting profits the Risk Structure also identifies where a hedge should be applied to protect losses. In the Hedge Strategy image above a SELL R BREAKOUT tactic can be implemented below the 1246.4. The 5.7 AD (Alert Distance) Metric can be used to confirm a “Breakout” signal (1246.4-5.7=1240.7) or a break under 1240.7, with the expectation that the market will shift into a RISK position down to the 1208.6 DP (Downside Pivot). Here again the market will be in a state of equilibrium, where it will either stabilize for a rally back up to the R-LEVEL sentiment bias or break structure and transition into a RISK ON Hedge position and potentially new Bear Trend targeting the 1126.5 DT2 (Downside Target#2).

Summary

Observing price action within Risk Structure provides clarity to the current condition and the value of an opportunity so proper risk management can be applied. Knowing where you are at risk is imperative to maintain a “fearless” focus by having the awareness of what RISK theme is currently dominating price action.

Standardizing your trade entry to the price levels that define the risk structure is an easy way to improve risk management of a trade as well as reducing fear by knowing what the risk position of the market is. If your risk profile won’t allow you to take a trade then you have the answer to if a trade should be taken or not. Once there is alignment with structure and your risk profile then there is no thinking about taking a trade or not but just executing it with the proper size based on the value of the opportunity.

When you know the facts and your trading tactics are in alignment, FEAR is replaced with RESOLVE. As long as the FACTS that confirm that the position remains true then all the fear inducing volatility becomes what it is, noise. Having a plan and a structured method to execute it eliminates fear with an emotionless IF/THEN equation.


For more information please send inquiries to info@jsservices.com

Click here to demo our analytics and enhance your trading and risk management.


NinjaTrader Trading Platform


NinjaTrader® is our #1 recommended trading software preferred by traders worldwide including our clients.

Download NinjaTrader & get immediate FREE access to:

  • Advanced interactive charting
  • Strategy development and back testing
  • Trade simulation and market replay
  • Live futures and forex market data trials
  • 450+ 3rd party add-ons, educators & consultants through the NinjaTrader Ecosystem


kineticklogo_v01kinetickbadge_v01

Kinetick® delivers reliable, fast and cost-effective market data to help level the playing field for active traders. Take advantage of unfiltered, real-time quotes for stocks, futures and forex that exceed the expectations of the world’s most demanding traders, like us!

Get started with FREE end-of-day historical market data directly through the NinjaTrader platform and learn how you can significantly reduce CME Group Globex exchange fees on real-time market data with Kinetick.

Get Started with Free EOD Data


Hedge Strategy Overlay Example

JSServices Playbook Analytics identify the inherent strategy themes and specific trade opportunities within the dynamics of the current condition as expressed by the state and structure dynamics. This context provides guidance of “what” to do and “where” to do it by highlighting the Hedge Strategy themes that are anticipated to dominate price action if a market breaks structure and transitions into a new risk state. The PlayBook analytics identify specific PriceMap action qualifiers, specifically the R LEVEL and CriticalRange boundaries (UP “Upside Pivot” and DP “Downside Pivot”) that should be used to standardized trade entry techniques to form the basis of an actionable trade strategy.

HEDGE STRATEGY

SELL UP REVERSAL SELL R BREAKOUT

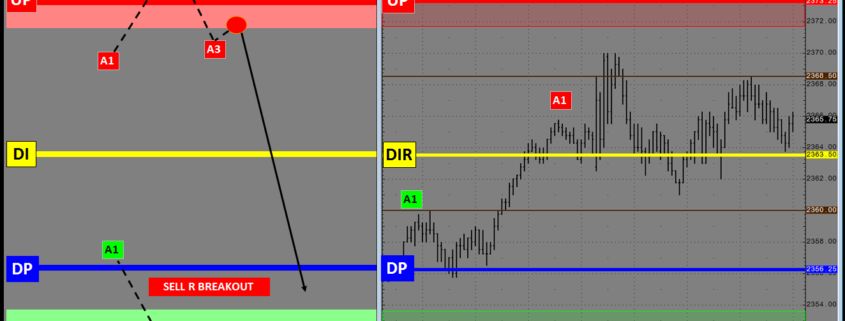
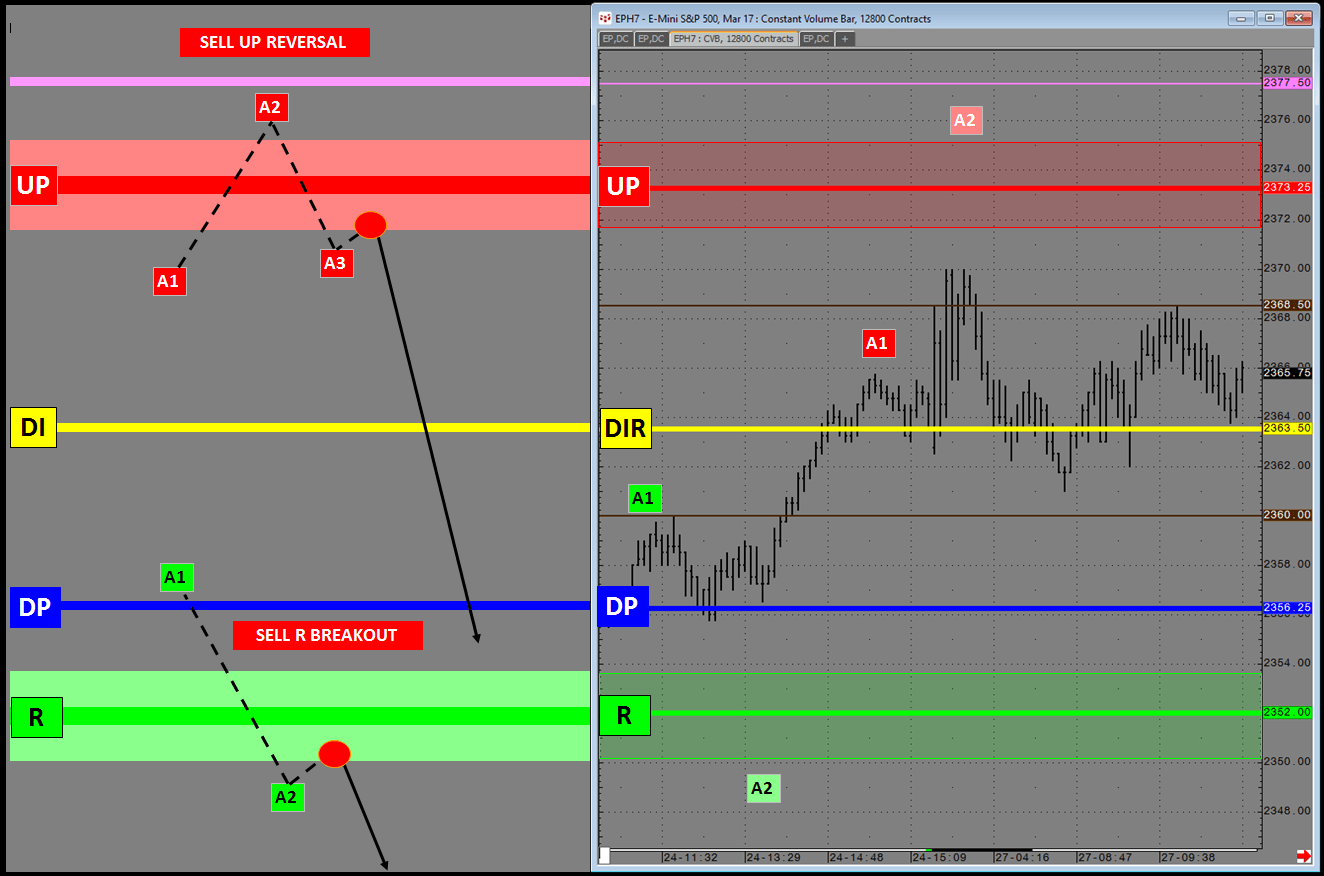
The example above highlights 2 entry tactics for this structure bias, a SELL UP REVERSAL, which can be used to reduce profit-giveback and a SELL R BREAKOUT to mitigate downside risk from a shift in sentiment.

Risk Parameters

The PlayBook Tactics suggest the specific trading techniques that should be used to capture the most favorable risk/reward opportunities within each Strategy Theme. Each Tactic provides the best entry and exit technique and its optimal price level. The very specific nature of the PlayBook Tactics makes them ideal as the basis for a systematic approach to trading or an automated trading system.

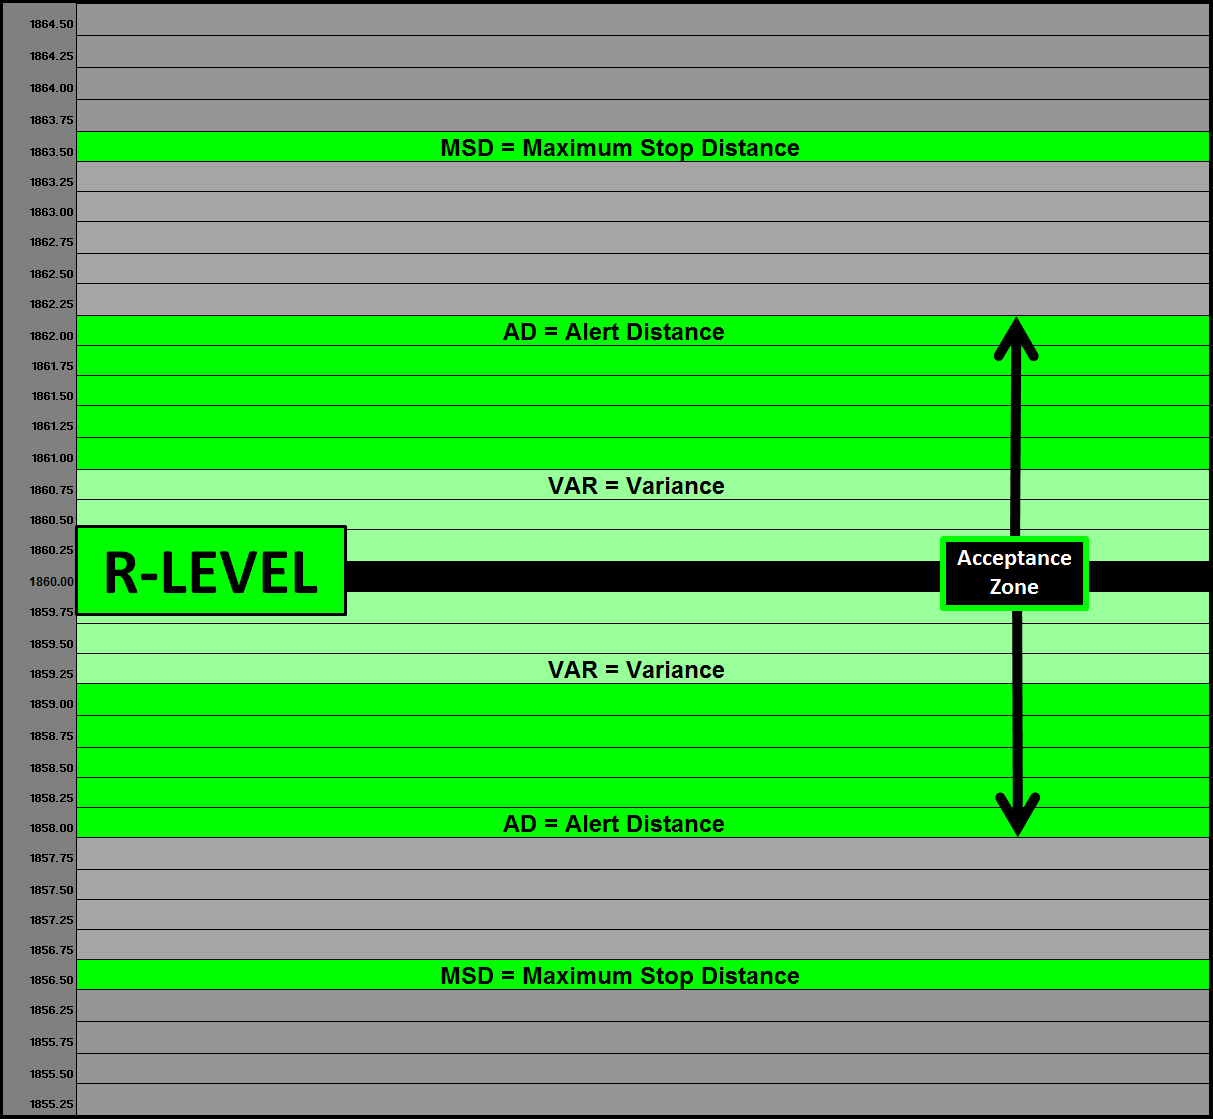
The Risk Parameter Market Metrics are used to identify the optimal entry level and the surrounding acceptance zone in which an opportunity remains valid when executing a specific trade tactic. The Market Metric boundaries offer a unified approach to optimized entry and exit tactics across all markets and asset classes.

RISK PARAMETERS

R-LEVEL Market Metrics VAR, AD, MSD

Hedge Strategy Overlay Example

A net long stock position that has a high correlation to the SP500 has 2 basic risks associated with it. Downside Failure Risk and Profit Give-back Risk. The diagram below provides a real-world example of how the trade entry techniques and risk parameters are used to protect downside failure and profit give-back risk.

HEDGE STRATEGY

PlayBook Entry Tactics                                                            SP500 E-Mini with Market Metrics

PROFIT GIVEBACK RISK

TACTICSELL UP REVERSAL –The SELL UP REVERSAL is designed to reduce profit-giveback by selling the market after an “exhaustive” reversal signal. In the example, conditional A1 (Alert 1) has been met but not A2 (Alert 2) or A3. For the REVERSAL to be “true” each condition must be met 1st to then trigger the SELL UP REVERSAL at which time SELL orders can be placed in the acceptance zone.

DOWNSIDE FAILURE RISK

TACTICSELL R BREAKOUT – TACTIC – The SELL R BREAKOUT is used to reduce downside risk by selling the market after negative shift in sentiment. In this example it would be anticipating a broader “corrective” expectation following a Daily sentiment shift targeting the Weekly R LEVEL. In the example, conditional A1 (Alert 1) has been met but not A2 (Alert 2). For the BREAKOUT to be “true” each condition must be met 1st to then trigger the SELL R BREAKOUT at which time SELL orders can be placed in the acceptance zone.

Summary

JSAnalytics provide a systematic approach to create risk defined trades as the basis for a Hedge Strategy Overlay which can reduce risk and profit give-back with defined tactics.

Click here to request a consultation on how JSServices can provide your trading program with a new edge.