


JSDesktop Overview
The JSDesktop is a comprehensive strategy based trading tool designed to quickly reveal the objective facts of a markets technical condition so intuitive decisions can be made. Traders using the JSDesktop will gain a consistent view of the diverse markets they are trading to appropriately select the best strategy that will yield the most effective tactics. Much attention has been paid to the user interface which presents our JSAnalytics in an efficient and logical way to make assessing a particular market condition fast and easy. The JSDesktop application can also download our analytics as standard data files so they can be incorporated into different trading methods. The screenshot below provides a top-level view of the user interface layout with its major sections outlined.
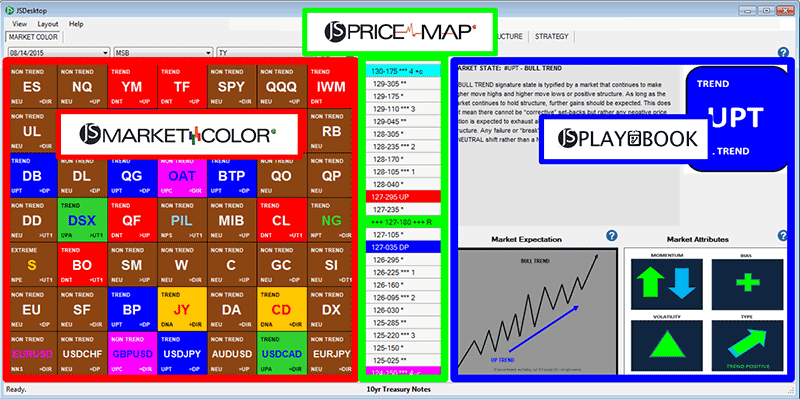
JSDesktop User Interface
JSDesktop Workflow
The JSDesktop application is a tool to give traders an effective way to add our JSAnalytics to their daily trading routines. The steps below outline the workflow implemented within the application so they can be easily integrated with current routines.
- Identify the best opportunities with the MarketColor Grid.
- Understand the state, structure, and strategy by analyzing the PlayBook Portfolio.
- Anticipate the moment to strike with the PriceMap Framework.
MarketColor Grid
The MarketColor Grid is the starting point to quickly assess the technical condition of a new trade session, the JSDesktop renders our market state MarketColor Bias (MCB) indicator using a proprietary grid layout that reveals the opportunity landscape across a large number of markets at a glance. Using this method a trader can quickly evaluate the technical conditions of many markets and focus on the ones that align with their trade plan and offer the best profit opportunities for the session. For traders that trade in several market sectors multiple grids for each market sector can be configured.
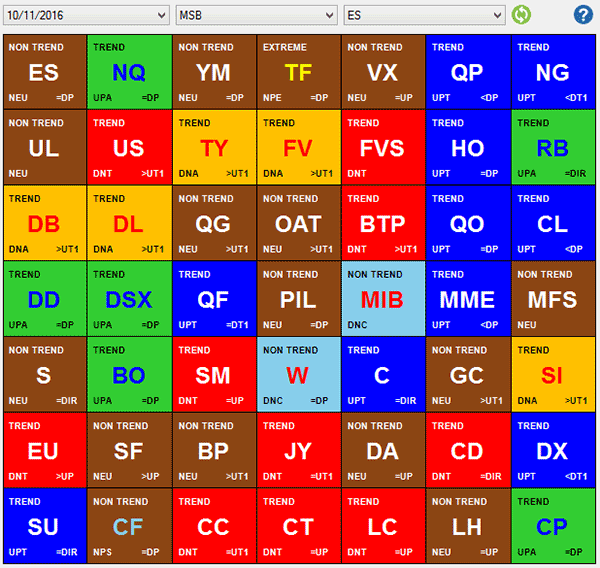
JSDesktop MarketColor Grid
Market Cells. An individual market is represented by a cell within the grid. The background color, text color, text size, along with the textual descriptions in the corners of each cell are all used to describe the technical conditions of that specific market. A context sensitive “?” HELP built into the application provides users with the ability to easily understand the meaning of these graphic indicators.
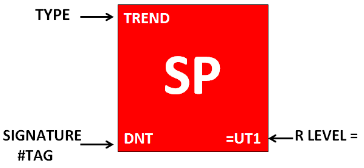
JSDesktop MarketColor Grid Cell
Selectable Views. To dig deeper into understanding the fundamentals that determine the technical condition of each market is the ability to display different views based on several other MarketColor Indicators and MarketColor Profile Indicators. A pull-down box located above the MarketColor Grid is used to select the desired indicator and change what the data the grid is displaying. The context sensitive help built into the application provides the meaning revealed by the various views.
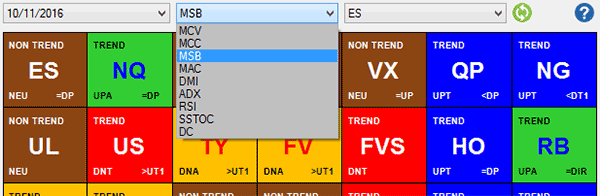
JSDesktop MarketColor Grid View Select
Historical Analysis. To evaluate and compare the market conditions from previous trade sessions a historical analysis pull-down box located above the MarketColor Grid is used to select past dates of previous trade sessions. The selection of a past session not only changes the content of the MarketColor Grid but also the PriceMap Framework and Playbook Portfolio.
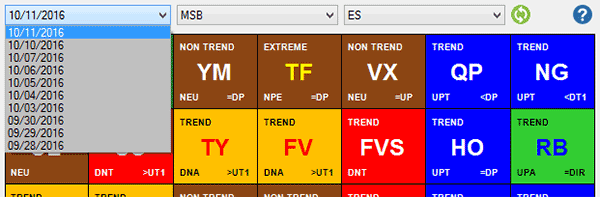
JSDesktop MarketColor Grid History Select
PlayBook Portfolio
The PlayBook Portfolio is used to provide a deeper understanding of the fundamentals that define the current technical conditions and the strategies that can be applied based on those conditions. The STATE and STRUCTURE pages of the portfolio contain all the indicator data generated by our analytics and detailed commentary describing how this data should be interpreted. The STRATEGY page displays the applicable optimal and hedge strategies that should be applied for a given session. The gallery below displays all the information provided by the PlayBook Portfolio.


JSDesktop PlayBook Portfolio Gallery
PriceMap Framework
The PriceMap Framework provides a frame of reference to consistently observe the price action once trading starts. The JSDesktop displays a framework of price levels that can be used with any execution system by comparing the price levels to those display withing the third-party system. A more effective way of observing price action within the PriceMap Framework is by utilizing one of our available JSIntegration solutions which will display the framework levels as an overlay directly with the desired trading system. The gallery below shows several ways the PriceMap Framework can be integrated into with a custom workflow.


JSDesktop PriceMap Framework Gallery
Additional Key Features
Context Sensitive Help. To make sure all the data presented in the JSDesktop is easy to learn and understand a context sensitive help system is embedded within the application. All the user interface components have a blue question mark near them, when pressed, a help page opens that explains in great detail what is being show and how to interpret the information.
Embedded Script Engine. The JSDesktop includes an embedded script engine, with an automatic syntax checker, that is used to generate data files, reports, or excel spreadsheets and automatically save them to the local file system. These data files can be used to integrate our JSAnalytics into any third party application workflow, print reports, or used with applications such as Microsoft Excel to support enhanced quantitative research capabilities.
International Support. The JSApplication Suite is used by traders in many different countries. All of our applications are designed to run on workstations set to any international region.


JSDesktop Key Feature Gallery
System Requirements
To run JSDesktop reliability on your PC it must meet the following minimum requirements:
| Processor | 1 Gigahertz (GHz) or faster x86-bit or x64-bit processor |
| Memory | 4 Gigabyte (GB) RAM |
| Hard Disk | 200 MB available disk space |
| Display | DirectX 10 graphics card with hardware acceleration |
| Monitor Resolution | 1028 x 720 |
| Operating System | Windows 7 Service Pack 1 or above |
| .NET Version | .NET Framework 4.5 or above |
| Microsoft Office | 2010 or above |
![]()
