Analysis – Personality Profile Overview

PERSONALITY PROFILE QUESTIONAIRE OVERVIEW

The personality profile questionnaire utilizes the NEO Five Factor Inventory derived from the research of Robert McCrae and Paul Costa. This assesses personality on five trait dimensions that have been found to be relatively stable across the lifespan:

1. Neuroticism – the tendency toward negative emotions.
2. Extraversion – an outward orientation toward people and life.
3. Openness to experience – a desire for novelty, variety and risk taking.
4. Agreeableness – the tendency to get along well with others.
5. Conscientiousness – the capacity to be reliable, steady and trustworthy.

Findings

  • From our findings the traders who reported the greatest success tended to score high in conscientiousness. There were very steady and reliable.
  • The traders who reported the greatest problems with their trading tended to score high in neuroticism and openness. They were experiencing many negative emotions and tended to use trading for excitement.
  • The conscientious traders tended to be highly rule-governed in their trading. There was little excitement in their trading. Instead, they very consistently developed their plans and followed them.
  • The neurotic and risk-taking traders tended to make their decisions impulsively, without prior planning. They tended to revel in telling stories of their great wins and losses.

The key to the study is that success in trading is related to the ability to stay consistent and plan-driven. Traders fail not because of their emotions, but because their emotions deflect them from their purpose. In developing their rules and systems, the successful traders had found a way to immunize themselves from the emotional effects of market volatility. Indeed, in many respects, the successful traders appeared to be every bit as fearful as the unsuccessful ones. It’s just that the fears of the successful traders were not those of drawdown or missing a market move. Rather, they feared deviation from their plans. Dedication to purpose was the cornerstone of their success.

10-21-2016-12-08-25-pm

Development Path to Success

The following are some thoughts on developing a path to success:

1. There is no quick or easy way to success. Success in trading comes from years of hard work and dedication.

2. Develop strict money management rules. Execute your money management rules instinctively and without hesitation. Never change these rules when trading, unless it is in the more conservative direction. Remember, anything can happen in the markets at any time. Always stay defensive and preserve your trading capital.

3. Top traders know human psychology better than they know technical analysis. They are also aware of their own psychological profile, and are able to profit from this knowledge. Many experienced traders have stated that they wished that they had spent more time learning psychology of the markets rather than technical analysis.

4. Top traders are humble, and spend a lot of time studying markets because they enjoy it.

5. Top traders treat a trading loss as a learning experience rather than a failure. Top traders never quit after a trading loss. They are always ready to trade again with new market knowledge.

6. Start a trading career the same way that you would start a business, because trading is a business.

7. Develop your “OWN’ trading plan. A trading plan that works for one trader, will not work for another. Each one of us is unique, and only you know what your trading plan should be. This ability shows dedication to your trading career and discipline.

8. Constantly refine your trading plan. The markets are constantly changing. What works today will not necessarily work tomorrow. Successful traders stay constantly in-tune with current market activity and themselves. Each day is a unique market experience.

9. Watch the markets you trade every day and how they behave in different market states. Top traders spend years learning their markets so well that they can instinctively anticipate a change in market direction and profit from that activity. However, do maintain balance with some off time and quality of life considerations.

10. Use market state and structure as a tool to support your instinctive anticipation of a market movement. Systems that only use technical indicators as strict “buy or sell” signals are rarely consistently profitable and must be optimized.

In summary, to be a successful trader requires that you treat trading as a business and a job that you enjoy above all other jobs. It takes years of hard work and dedication. There is no short cut path to success.

Click here to get started by taking a Personality Profile.


Peak Performance through a Standardized TradePlan

The purpose of this document is to provide awareness on the steps needed to apply JSServices Analytics to Standardize a TradePlan and make it sustainable.

Knowing personality traits associated with successful traders and things you “should” do to succeed in trading does not bring us any closer to achieving success unless we are practicing what we know to be true and are doing it consistently.

The problem is that we know but we don’t do.  For successful traders, this trait to “do” is innate and there is no issue. For most however it is the challenge that keeps trading success elusive.

The reason is trust. Trading strategies must be based on a foundation of truth to succeed. Good market awareness allows you to “see” the truth more clearly so you have more confidence “doing” and executing the proper tactics.

How do you improve your market awareness and start to take the steps to develop a path to success: Self-Identification.

Core Strength Assessment – Who Are You?

personalityprofile-image

Traits

Before you can define who you are, you have to understand your personality. Ask yourself a question, such as “What do I like to do?” or “who am I?” When you can answer that question, then you can use the information to discover what your personality is and how it affects your decision process in trading. Personality does not just influence how we move and respond in our environment; it also causes us to act in certain ways which is reflected in your trading methods. By understanding your personality you are better able to modify behaviors that are detrimental to your trading and create a trade plan that supports the behaviors your have. There are many different personality types, and it is sometimes difficult to classify a person into a single type as there are many different personality traits you can possess. Personality traits are simply:

  • Actions
  • Attitudes
  • Behaviors you possess

Personality Type

Your personality type can be determined by many factors. You can approach it the scientific way, by testing yourself and having a psychologist analyze you or by taking a personality test which is rather simple. By answering a few questions about your likes and dislikes and where you would like to go in life, a professional can give you a report detailing the type of personality you have.

In psychology, there are five factors that determine different personality types. The big five factors are:

  1. Openness is appreciation for a variety of experience.
  2. Conscientiousness is planning ahead rather than being spontaneous.
  3. Extraversion involves work environment.
  4. Agreeableness is, as it says, being agreeable.
  5. Neuroticism refers to worrying or being vulnerable.

Your personality test assesses how much of each of these five factors you possess and provides you with insight into who you are and the actions you need to take to developing a TadePlan that puts you on a path to success.

Personality Profile

A personality profile is a knowledge management tool used to provide an evaluation of a trader’s personal attributes, values and life skills, in an effort to maximize his or her performance. Questions in a personality profile test are designed to seek out information about a trader’s temperament, decision-making methods, trading style, general attitude and commitment towards work, along with quality of life considerations. The information can be used to match the right trading approach to natural skill set. Behaviors can be modified; however the core of who you are is difficult to change. Why force yourself to be something that you are not but rather develop a plan built to support your attributes and leverage your core strengths.

Profile Results

The best profile results come from taking an honest assessment. One reason a lot of traders struggle is that they believe by following a TradePlan that works for someone else it will work for them. This is not the case (unless of course your account is a direct “mirror” of that trader’s program). The reason is that the strategies they are applying are designed around their personality not yours. You are unique and your path to success will be your own. To achieve the best results in your profile commit to your feelings and have a bias in your answers. When faced with a question you are not sure of, press yourself for a bias and avoid non committed neutral answers. Uncommitted “neutral” answers do not help or provide insight into who you are. There are no “right or wrong” answers. The more honest you are, the quicker you can get on that path to sustainable profitability. Honest, biased answers provide you with the personality facts you need to build a TradePlan that works for you.

  • Personality Assessment link [The following link provides a complimentary OCEAN 5 Factor assessment questionnaire. It is recommended that you read this the document in its entirety before you take the assessment.]

Acumen Alignment – What Works for You?

10-21-2016-12-05-48-pm

TradePlan Profile

A TradePlan is the rules that cover the entire trading program and is how you define your edge which will tip the balance of probabilities toward your success. This set of rules is your trading business plan and are the standards that allow you to measure your results and quantify your improvements. No plan will guarantee success. However, a good plan when adhered to, will provide consistency and enable you to stay in the game a lot longer than if you do not have a plan. By aligning your TradePlan rules with your personality traits and core strengths it makes it easier and more enjoyable to follow that plan.

A TradePlan is not a trading strategy but a good plan will always contain a strategy. The goal of this section is to highlight parts of your personality that will affect your decision making which should be taken into account in the development of a TradePlan.  The objective is to end up with a plan that is tailor made to suit your personality, ability and resources.

The TradePlan should be developed around these key factors:

  • Motivation
  • Risk
  • Reward

Motivation

10-21-2016-12-09-31-pm

Why do You Want to be a Trader? “To make money”, is a generic answer that is applicable to all traders. It is not personal to you and, therefore, it is not helpful to your plan. It may be that you have a need for excitement which can easily lead to catastrophe if allowed to go unchecked. Perhaps you have heard stories about traders making exorbitant amounts of money in a single day? Without doubt, some do; but they are only a small fraction of traders who make any money at all in the markets. Overwhelming disappointment is often the reward for uncontrolled greed. Dreams about trading via a laptop, sipping champagne in the islands, are entertaining, but they are hardly grounded in reality. Such fantasies may help to motivate you to study the markets, but the emotions that accompany them will not help you when it comes to trading the markets. Just as the trader with a thirst for excitement is doomed to fail, the fate of a trader motivated by greed or reacting to fear is almost certain to end in disaster. These thoughts and emotions are not the problem and they occur naturally; it is how you allow them to impact your trading that is the problem.

Do not pretend to be someone you are not. Be honest with yourself to uncover the real motivations, fears and desires that fuel your ambition. Some of these will be helpful while trading, others will not. How you allow them to impact your trading is what, to a large extent, what a TradePlan will measure. To ensure that the impact of your motivation is a profitable one, you must start by examining your real reasons for trading and, hopefully, learn more about yourself in the process.

Question your true motivations. Are you certain that trading is the right business for you? If you believe that the markets exist for the sole purpose of showering you in vast quantities of easy money – then think again! Beware: trading is NOT the easy option and the effort needed to run a trading business must be respected.

Risk

10-21-2016-12-11-15-pm

What is Your Attitude towards Risk? This may seem an odd question, but it is a good starting point to ensure that your feelings about risk are compatible with your trading style. Opinions on risk vary. Some traders think of the stock market as a hot potato – the longer you hold a position, the greater the chance of getting burned. To these traders, market risk is measured by the amount of time you are in the market. It could be seconds, minutes, hours, days or weeks. The longer you are in the market the greater the chance something will go wrong. Therefore, the trading style that keeps you in the longest can also be the most risky. There are many traders who will totally disagree with this and feel much happier and sleep better at night by holding medium to long-term positions. For them, trading momentum plays in volatile Indices intraday carries far too much risk.  Understanding your risk tolerance is a key factor in developing a sustainable TradePlan.

Reward

10-21-2016-12-13-40-pm

What are Your Income Targets? There are numerous reasons for becoming a trader; making money is the one reason that unites us all. It is important to know your financial targets and to break them down into daily/weekly time frames. It is much easier to focus on short term goals than feeling the pressure each day to make your objective. Needless to say, if your strategies only generate 5% a month, it is counterproductive to have a target of 1% per day. Your targets are not idle fantasies; they must be based upon your back and forward testing results.

Setting goals is an essential part succeeding at anything worthwhile. Goals therefore; are a big part of your trading plan as they provide you with a meaningful objective to work towards and a way to track your progress. A well done plan will help give you all the motivation needed to get the job done because it is personal to you. When developing a plan think in terms of your development as a trader, as opposed to thinking of purely financial goals. By developing yourself as trader first you are able to identify a method that works for you and create structure to capitalize on the opportunities presented. Decide how you will achieve your goals.  Reward yourself once you do. The rewards should be specific and meaningful to you.

Application- How To Do It?

10-21-2016-12-23-42-pm

Analytics Alignment

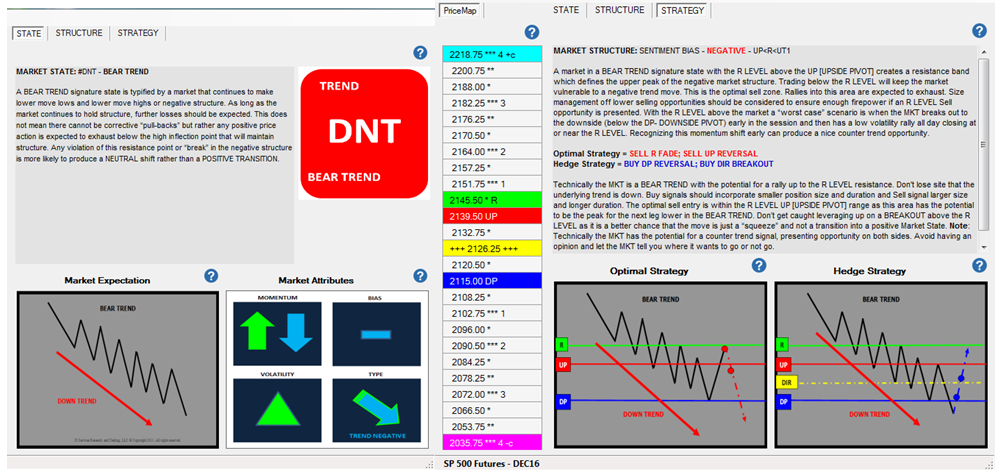
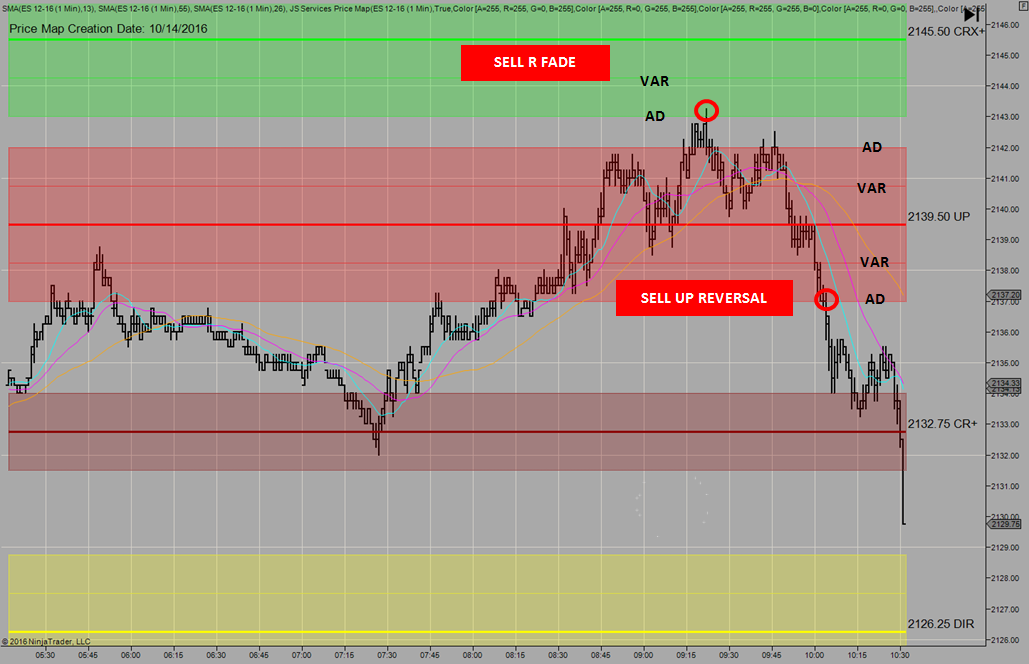
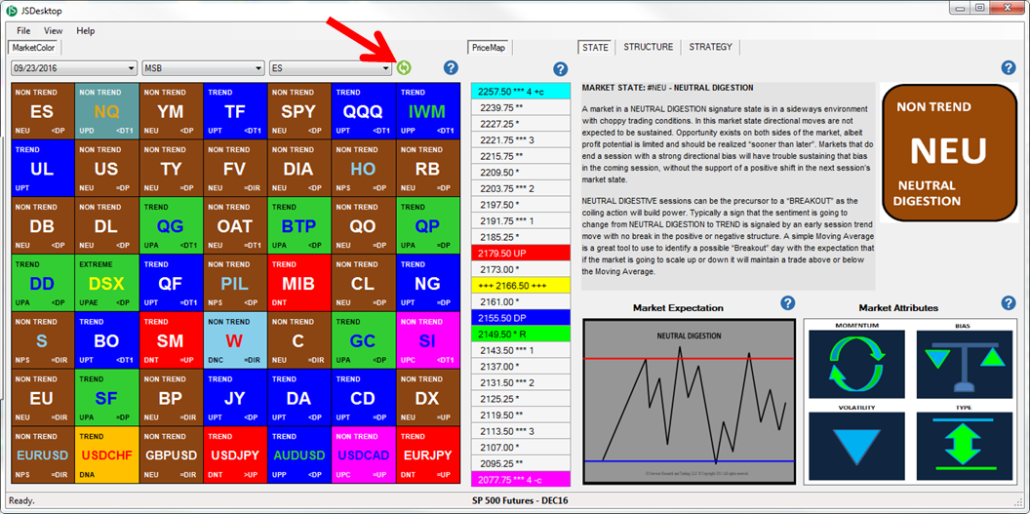
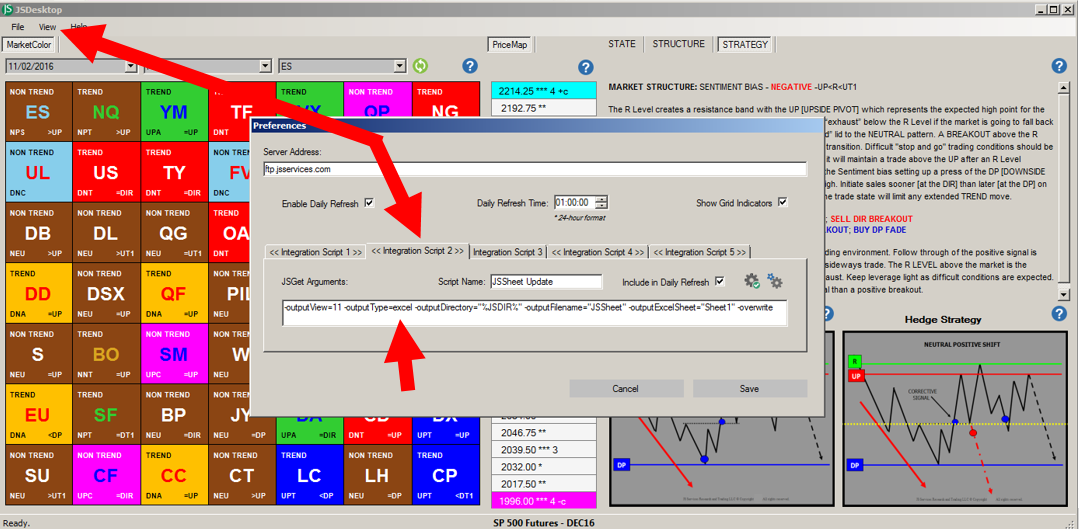
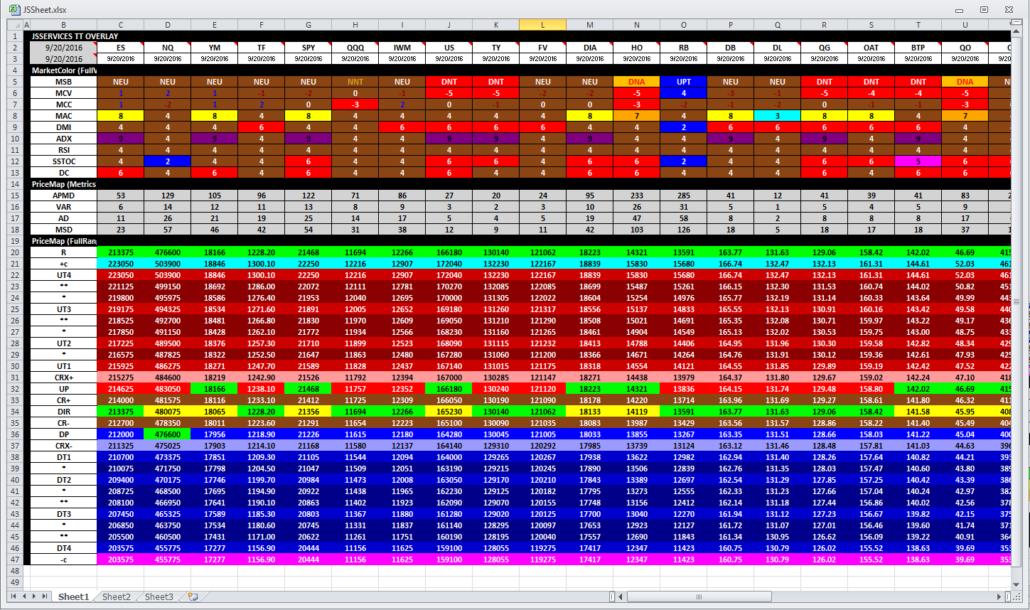
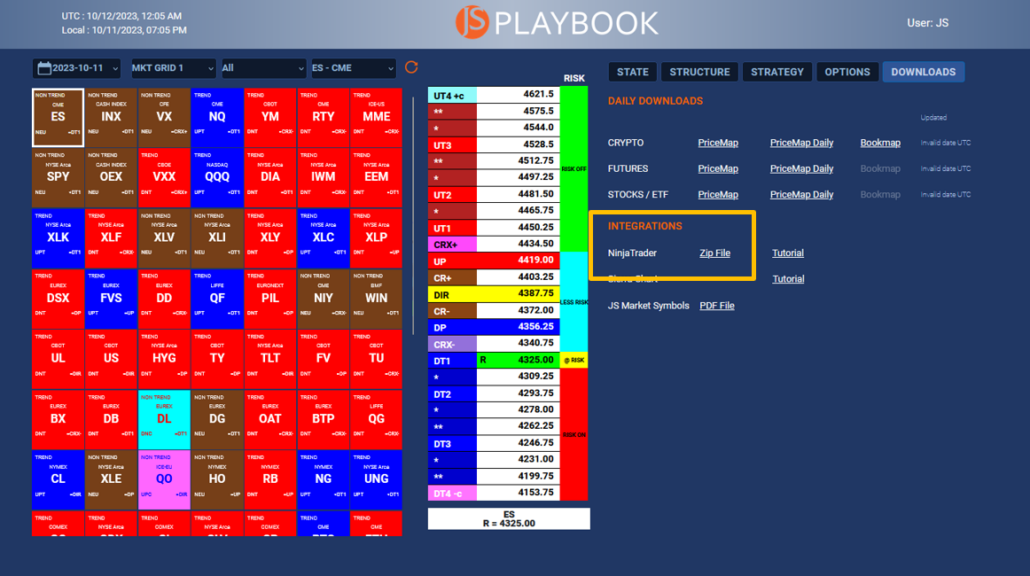
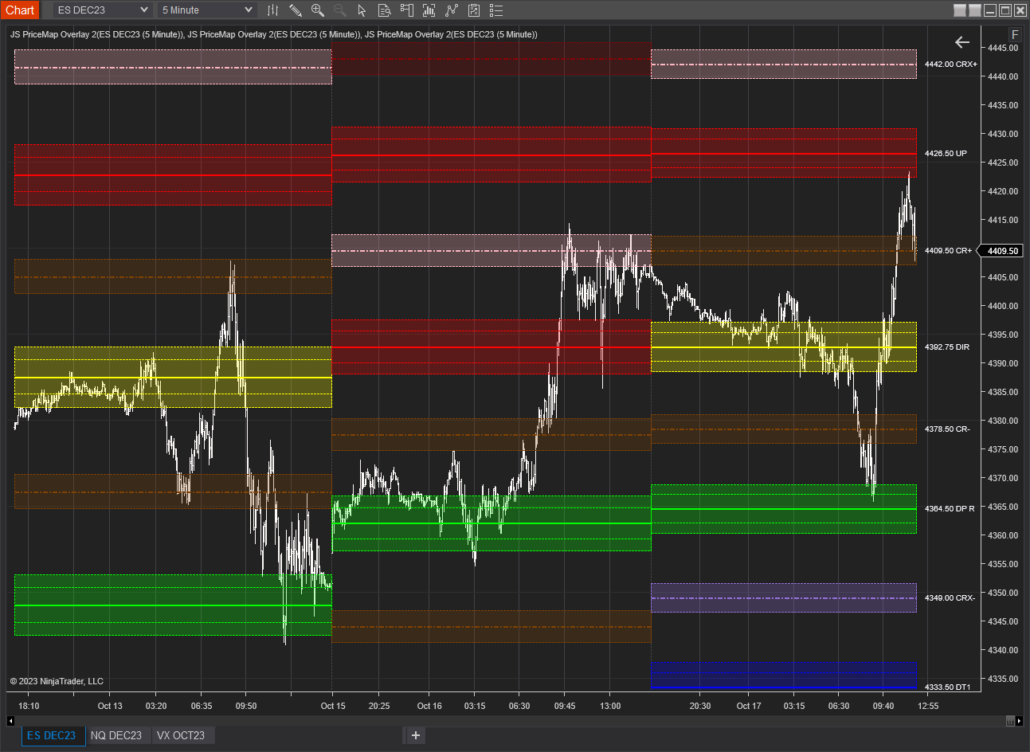
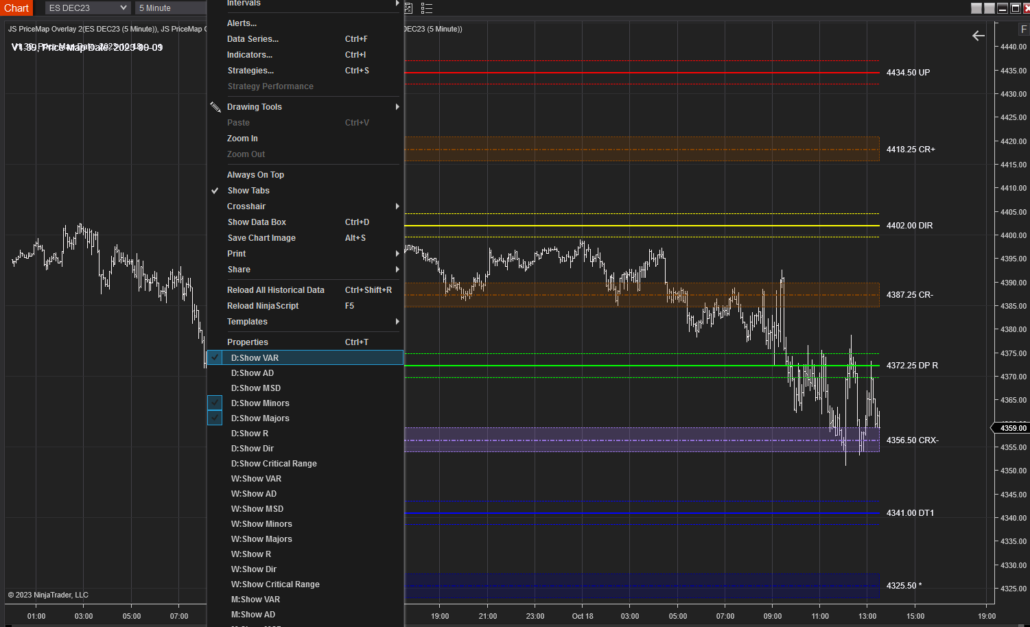
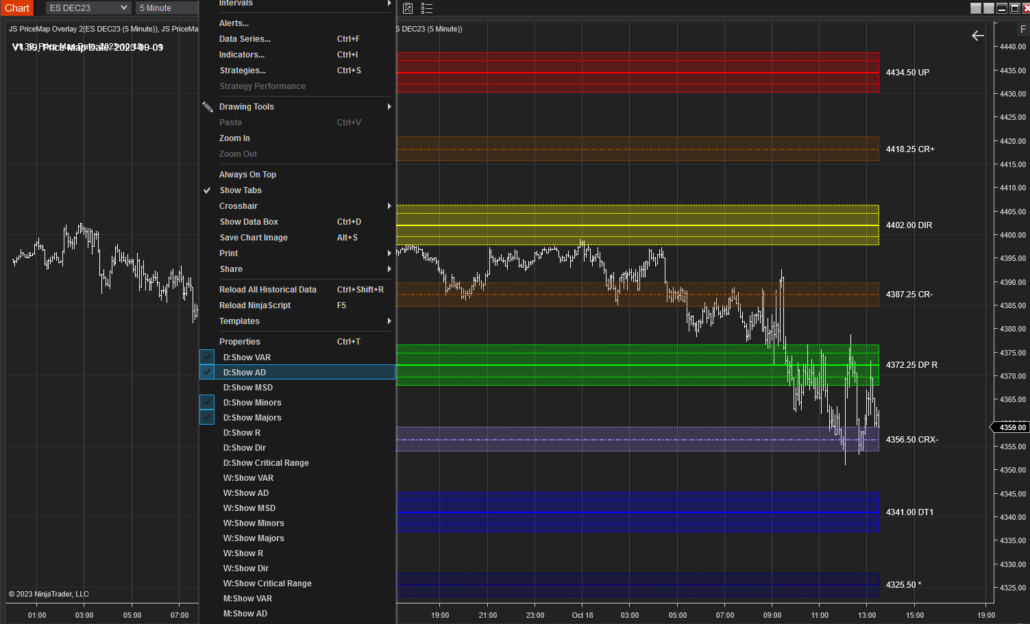
Self-Identification attained through a Personality Assessment and the development of a TradePlan, provide better awareness of what works for you. What you are comfortable with and willing to commit to too achieve fulfillment as a trader. It should be understood that every trader’s path is unique and building a strategy foundation from your core strengths and risk tolerances will provide for the best chance to create a sustainable trade plan. Improved awareness in how you respond to market conditions, gives you insight into developing strategies to capture opportunity. By knowing yourself and your own responses to specific behavior, you understand the market better and are able to identify shifts in market state faster and implement the correct strategy. Creating a sustainable TradePlan starts with aligning this awareness to market state conditions, structure and strategy themes that compliment your acumen. What market state environments are most comfortable to trade and whose characteristics align with core strengths? Are pivotal structure points favorable or is foundational structure better for risk tolerances? What strategy themes support profit expectations? JSServices Analytics identify the market state, structure and strategy themes that core strengths can be aligned with to create a sustainable TradePlan.

TradeStrategy Development

10-21-2016-12-22-30-pm

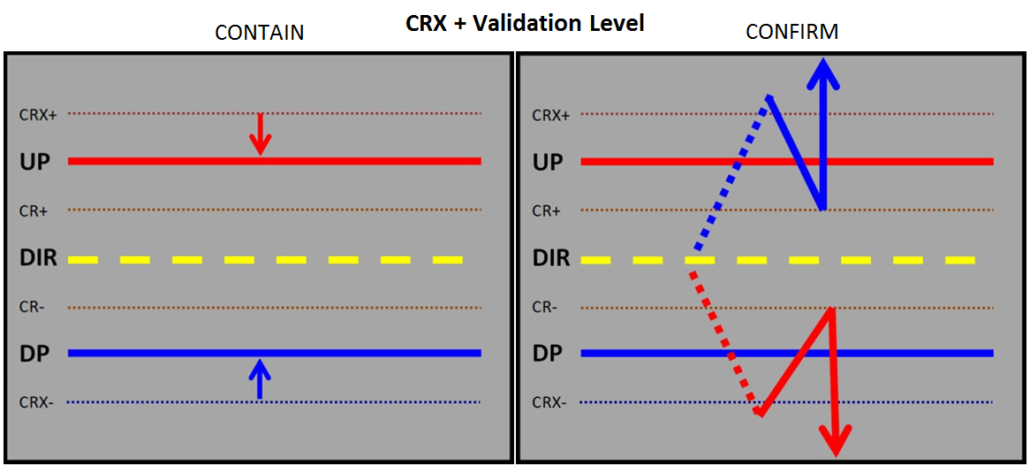
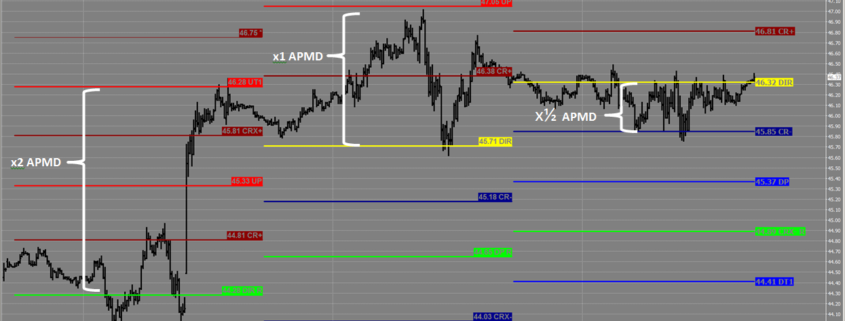
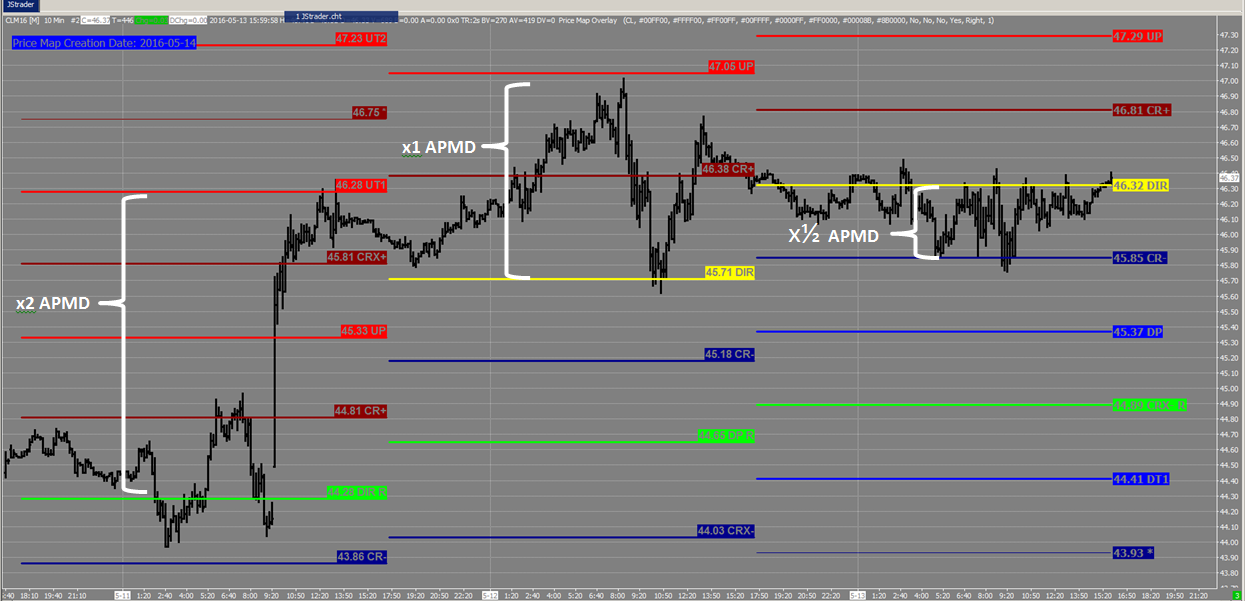
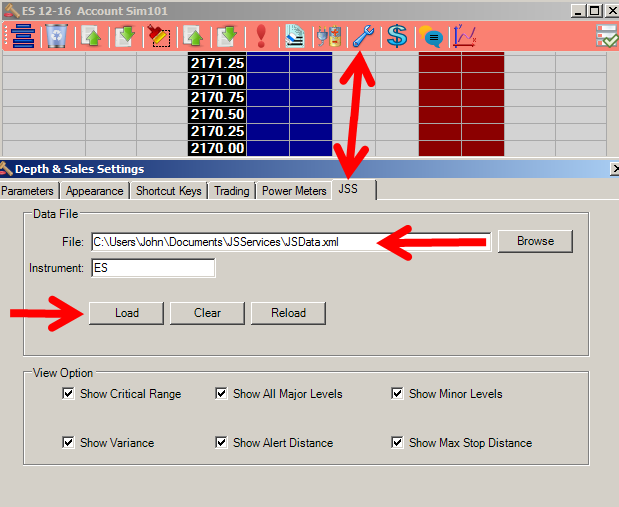
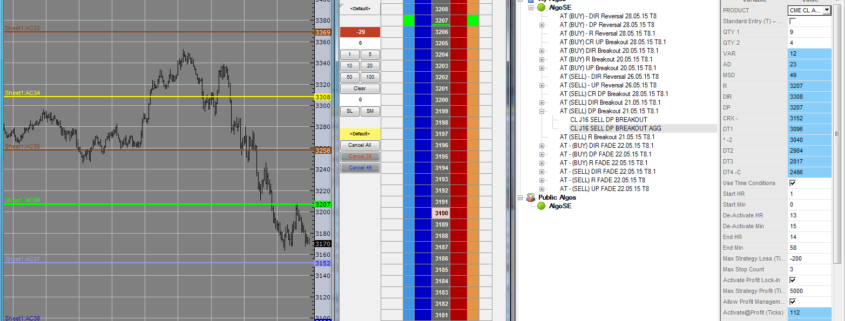
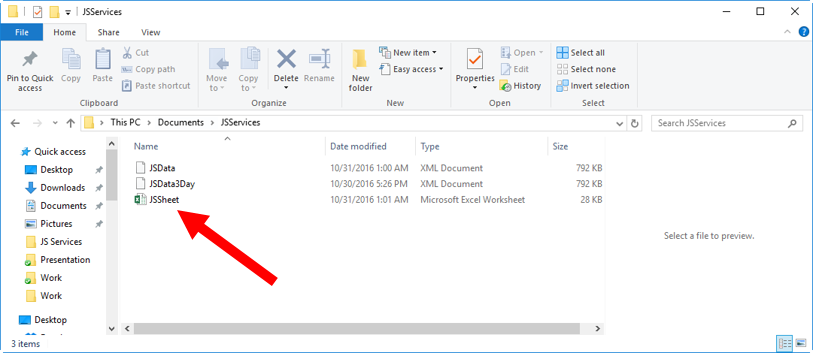
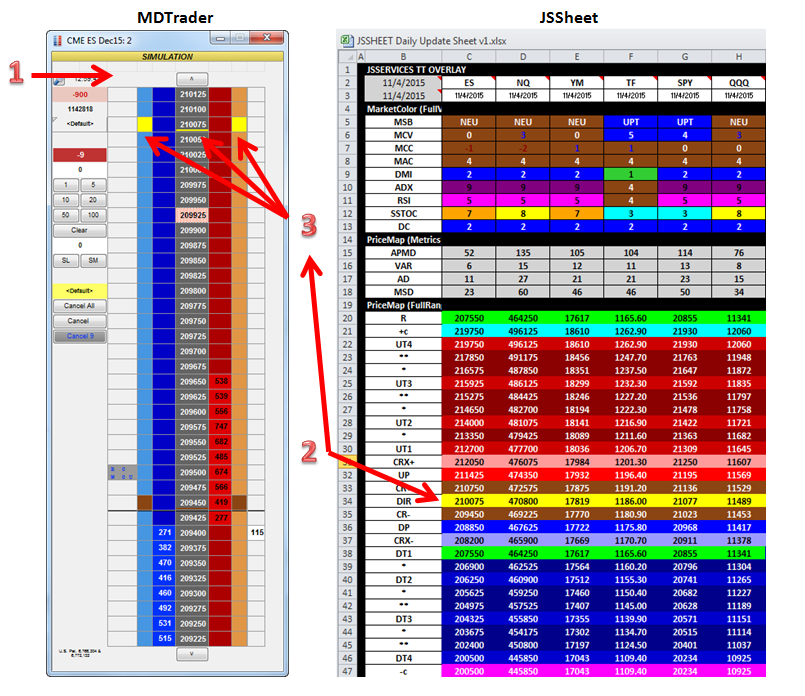
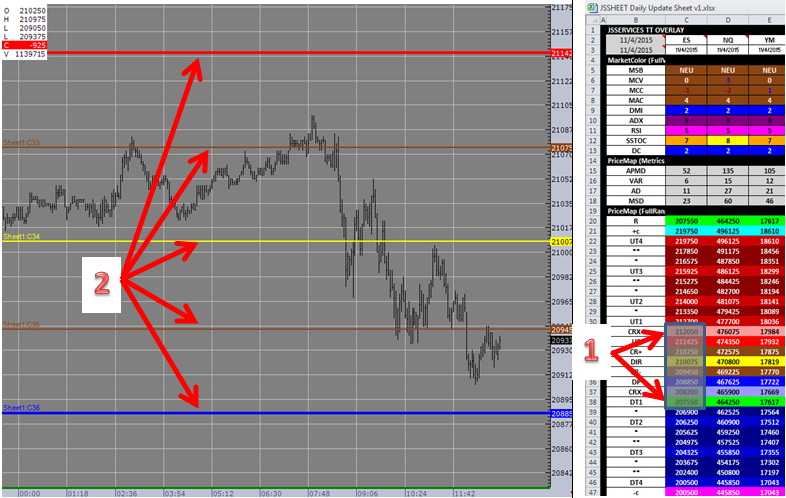
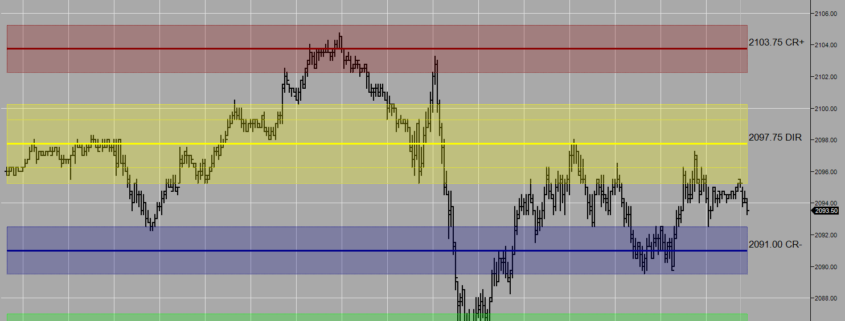
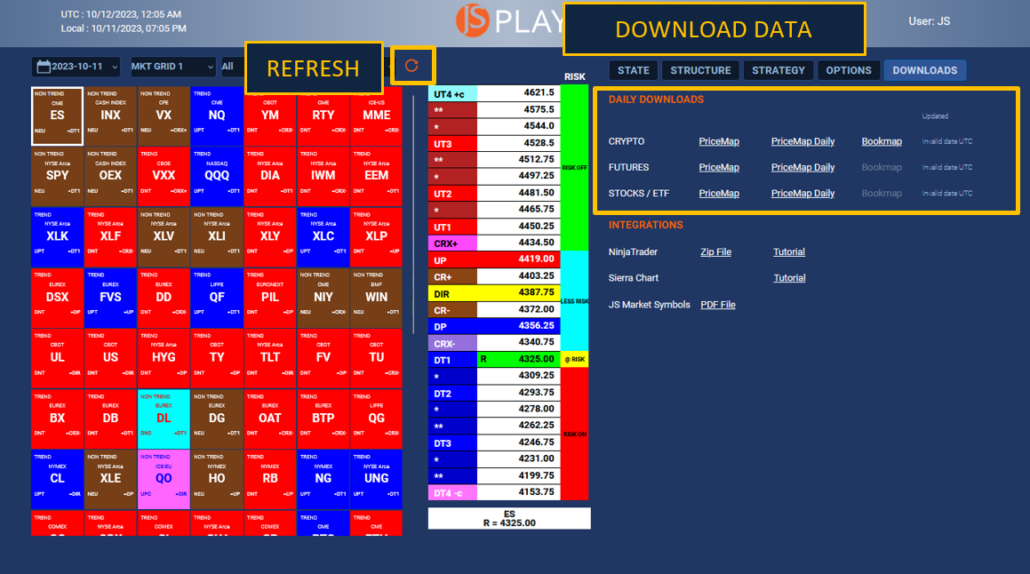
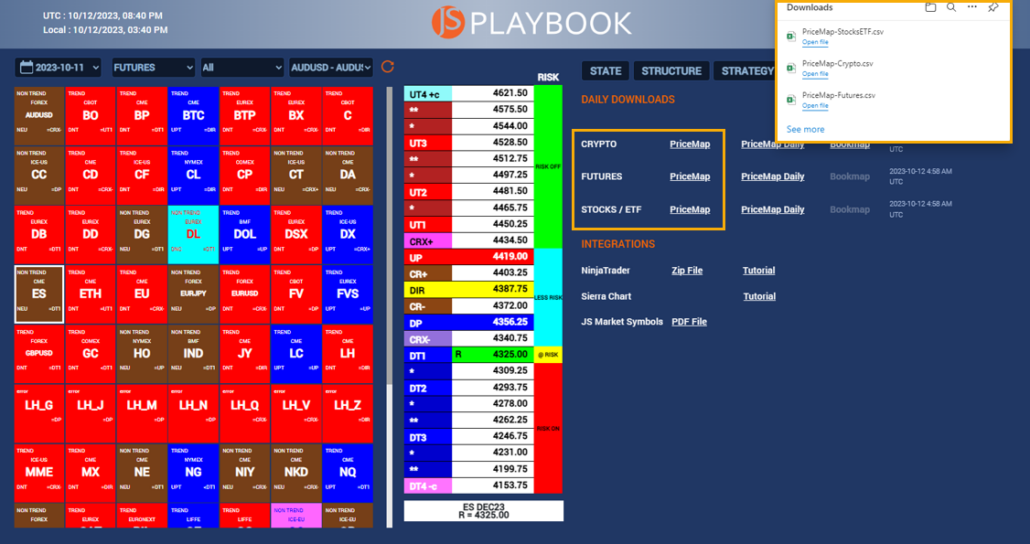
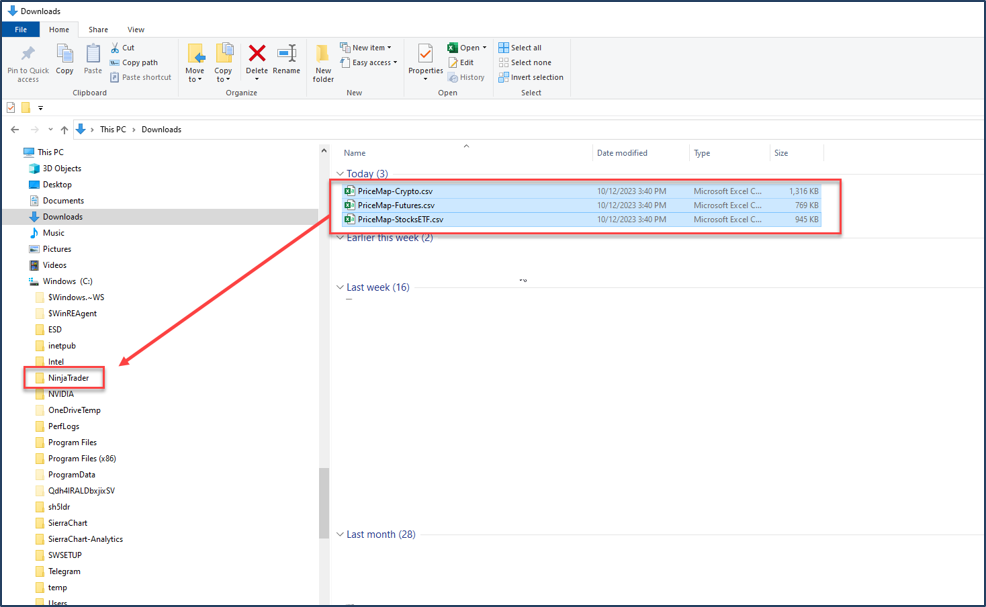
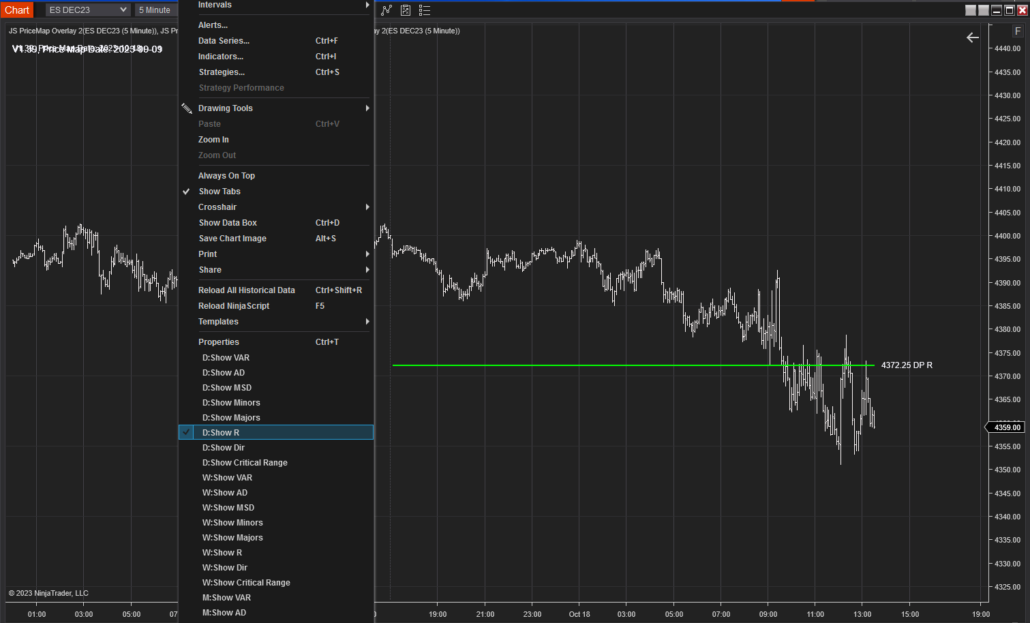
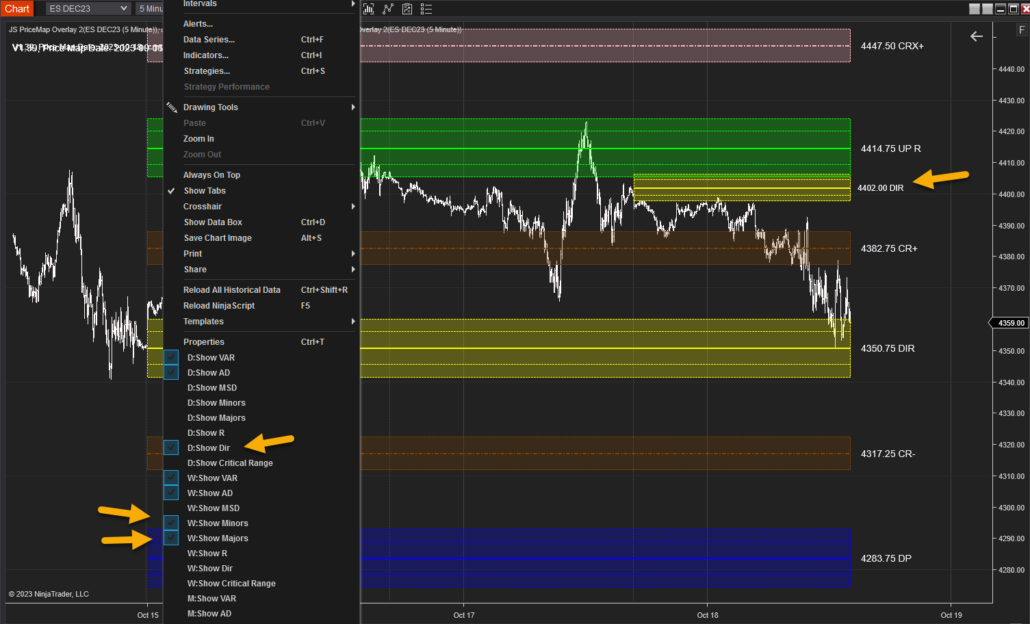
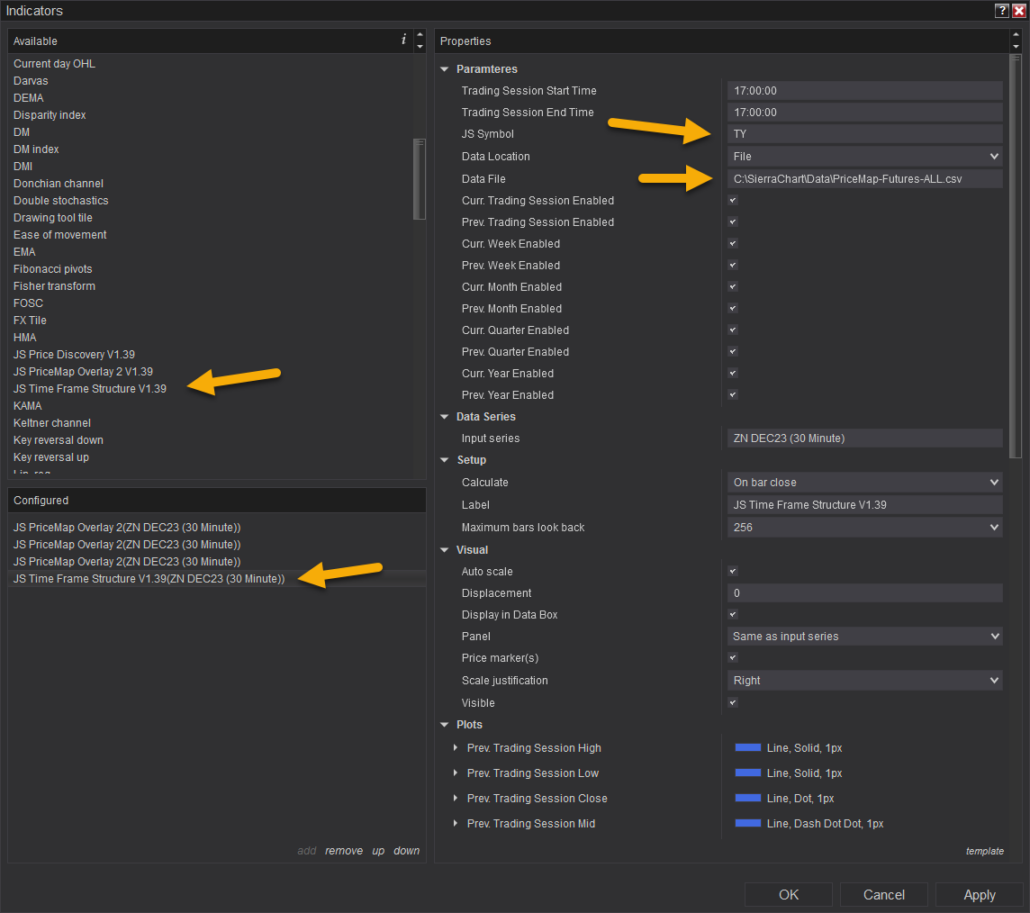
The awareness the analytics alignment provides is a knowledge management tool to develop a TradeStrategy by creating a decision template based on truths. Do you like to trade with momentum or against it. If you like to trade counter trend do you want to take advantage of the initial turn or prefer to wait for a confirmed reversal. Are you a directional trader or would you rather base your strategy on volatility movement. Does your profile show you have a need to always be “involved” or do you want more selective strategy that only trades a couple of times a day. Do you prefer a mechanical automated approach or more “seat of the pants” discretionary trading? The answers to questions like these form the foundation of a standardized TradePlan which must be normalized into a TradeStrategy. This is done using JSServices applications which integrate into your daily work-flow and provide context for a consistent execution of a TradePlan. Every market state has its own characteristics and structure that defines it. Certain strategy themes that are inherent to these conditions will have better alignment than others to a trader’s unique standardized TradePlan. By normalizing favorable market state conditions that compliment a TradePlan with specific entry and exit points which define the market structure alignment, the optimal TradeStrategy can be achieved.

Optimization

10-21-2016-12-41-19-pm

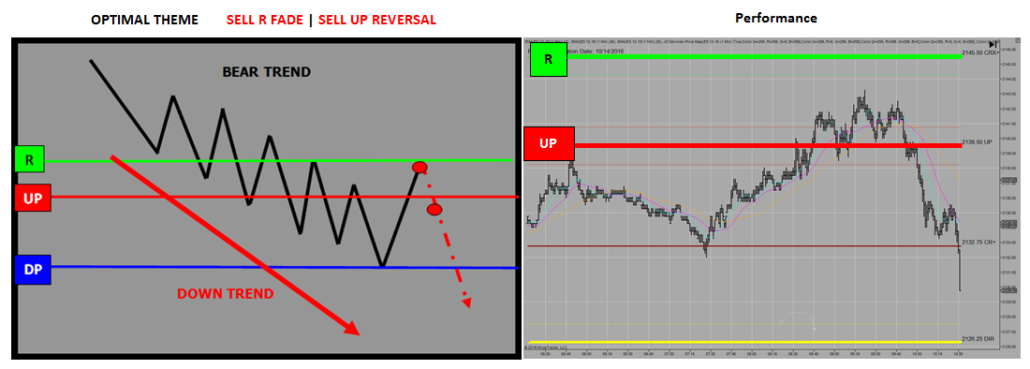
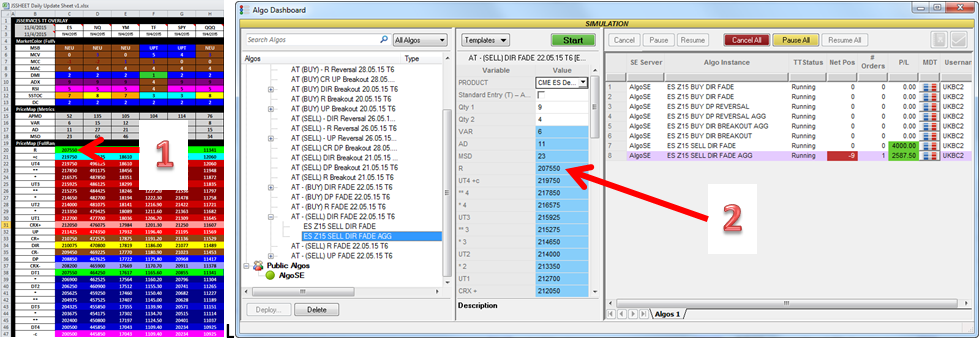
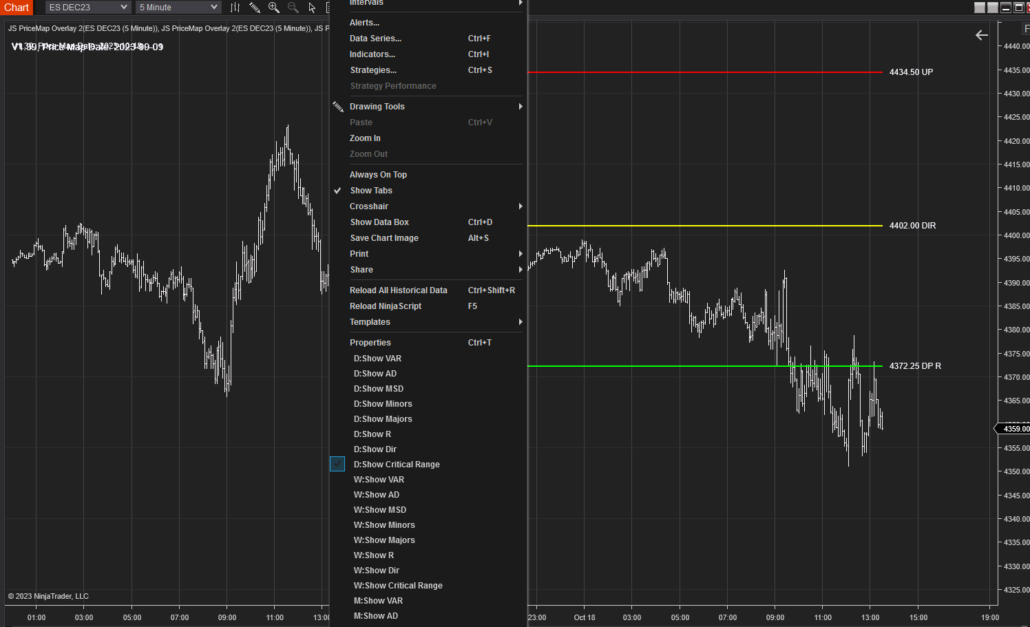
Every trader has certain trading tactics they have acquired over the years that provide the basis of the method they use to trade the market. Although the applied practice and theory may resonate and bring a high level of trust, the success ratio without a standardized TradePlan and normalized TradeStrategy will undoubtedly lack consistency and not be sustainable. Applying TradeTactics within the construct of a normalized TradeStrategy improves their effectiveness and can be optimized when executed within defined MarketMetrics and by incorporating dynamic order book events. For example, if you have a deviation tactic that uses multiple oscillators in different time periods to identify an extreme overbought/oversold reading, the TradeTactic needs to be normalized in the TradeStrategy development process during “trending” market states. A deviation strategy will work well in a neutral sideways trading environment in either direction but will most certainly fail when applied to fading a trend move. To optimize the TradeTactic it should be executed within defined MarketMetric thresholds that surround TradeStrategy entry and exit points. Performance can further be enhanced by incorporating dynamic micro structure events in the orderbook.

Peak Performance

The key to attaining peak performance is related to the ability to stay consistent and plan-driven. Traders fail not because of their emotions, but because their emotions deflect them from their purpose. In developing their rules and systems, the successful traders had found a way to immunize themselves from the emotional effects of market volatility by having a TradePlan standardized to core strengths and aligned to market state conditions. Indeed, in many respects, the successful traders appeared to be every bit as fearful as the unsuccessful ones. It’s just that the fears of the successful traders were not those of drawdown or missing a market move. Rather, they feared deviation from their plans. Dedication to purpose was the cornerstone of their success. Knowing who you are and what works for you makes it easier to stick to your plan and achieve sustainable results.

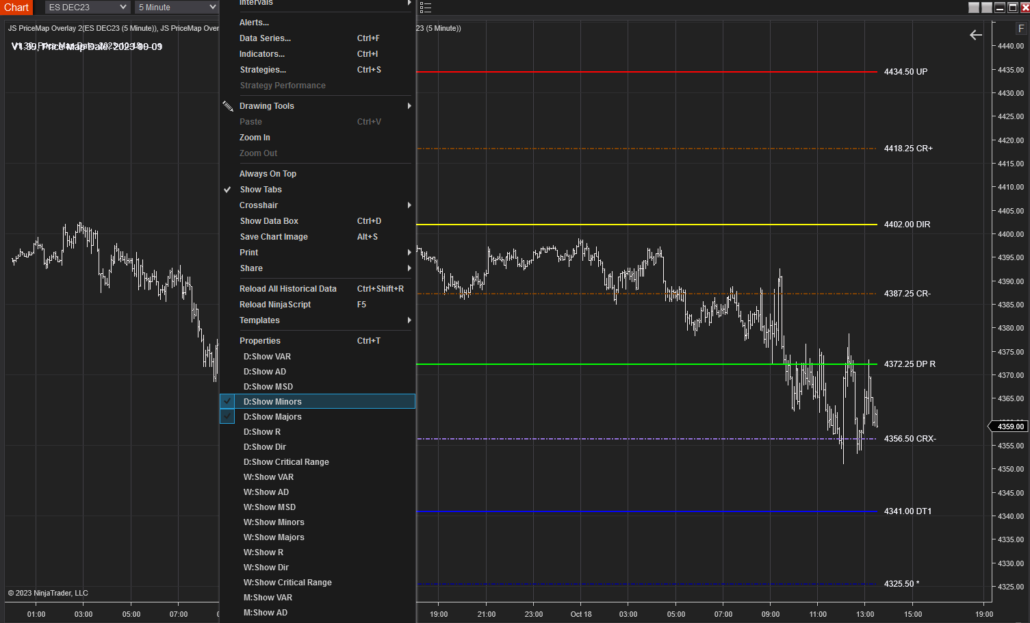
Consistency is improved by having a structured framework to execute a TradeStrategy. By normalizing entry and exit points to specific market structure levels trade execution becomes more constant and uniform. It becomes easier to identify when something is working or when it is not, as there is a standard to compare like events. Traders build self-trust and are able to trade more intuitively. Trade management decisions become a harmonious flow with steady execution of position, risk and size adjustments.

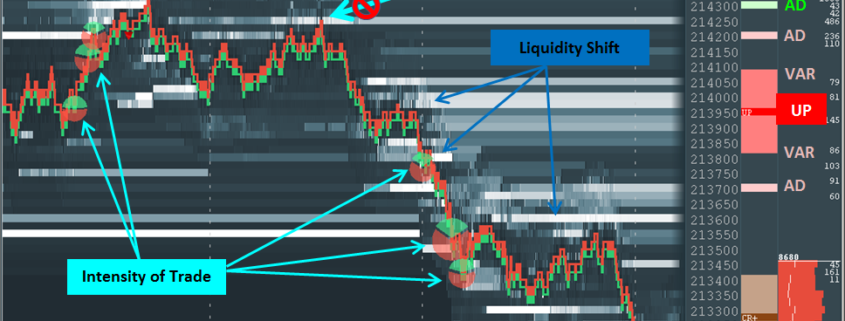
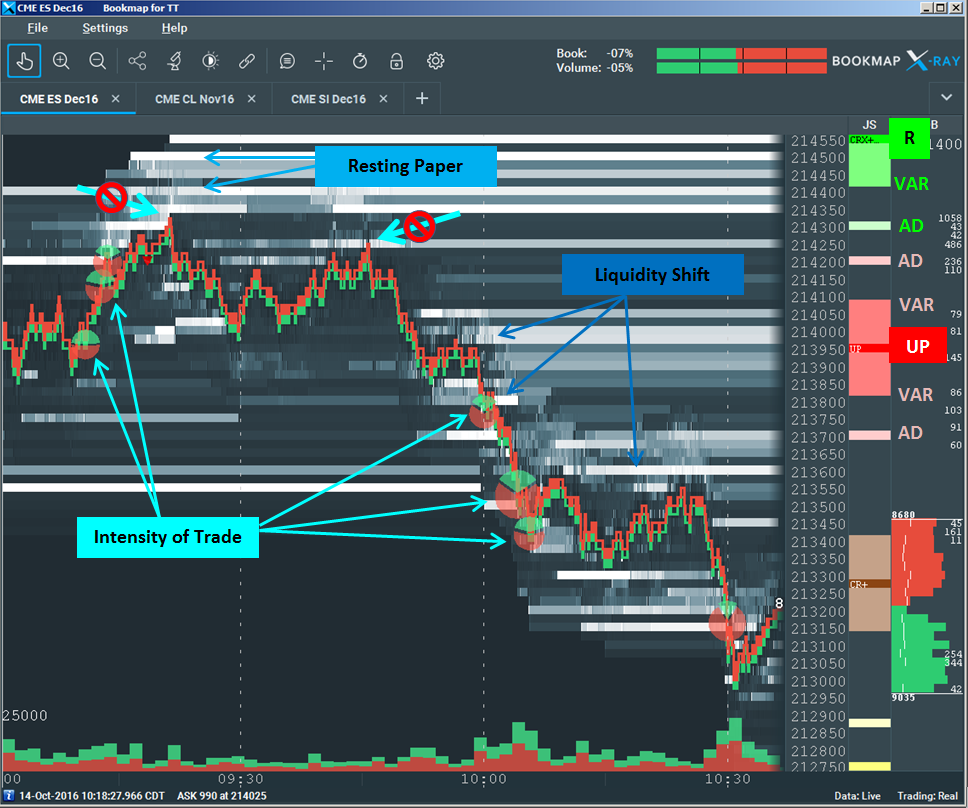
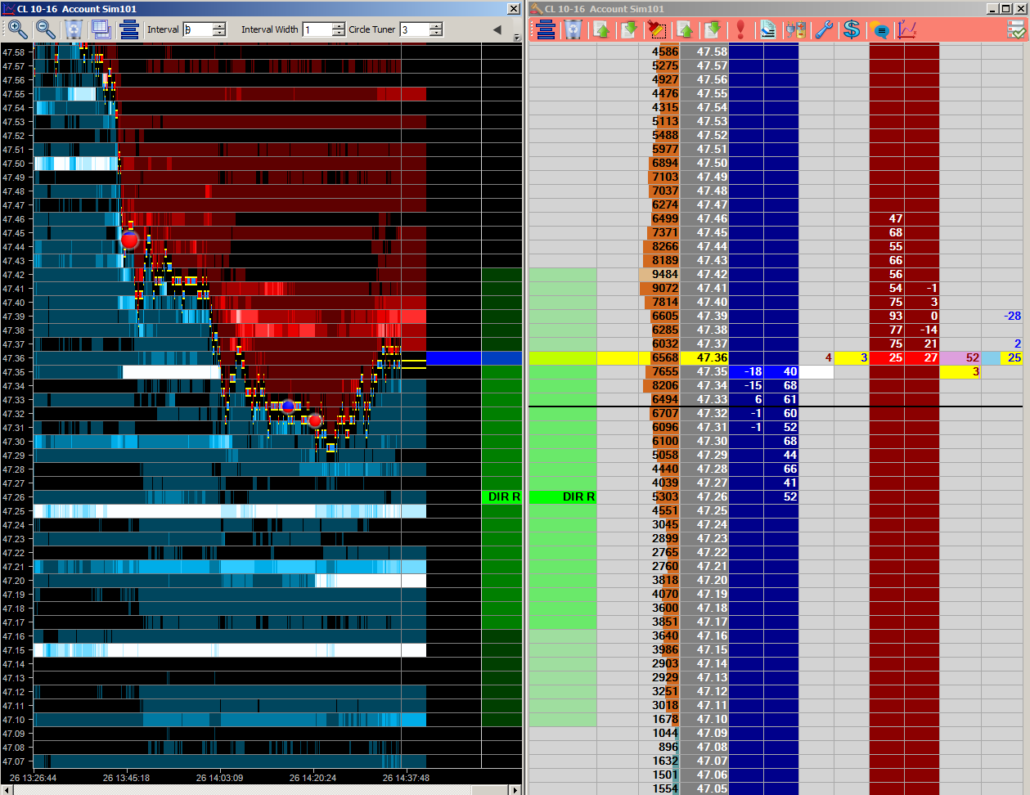
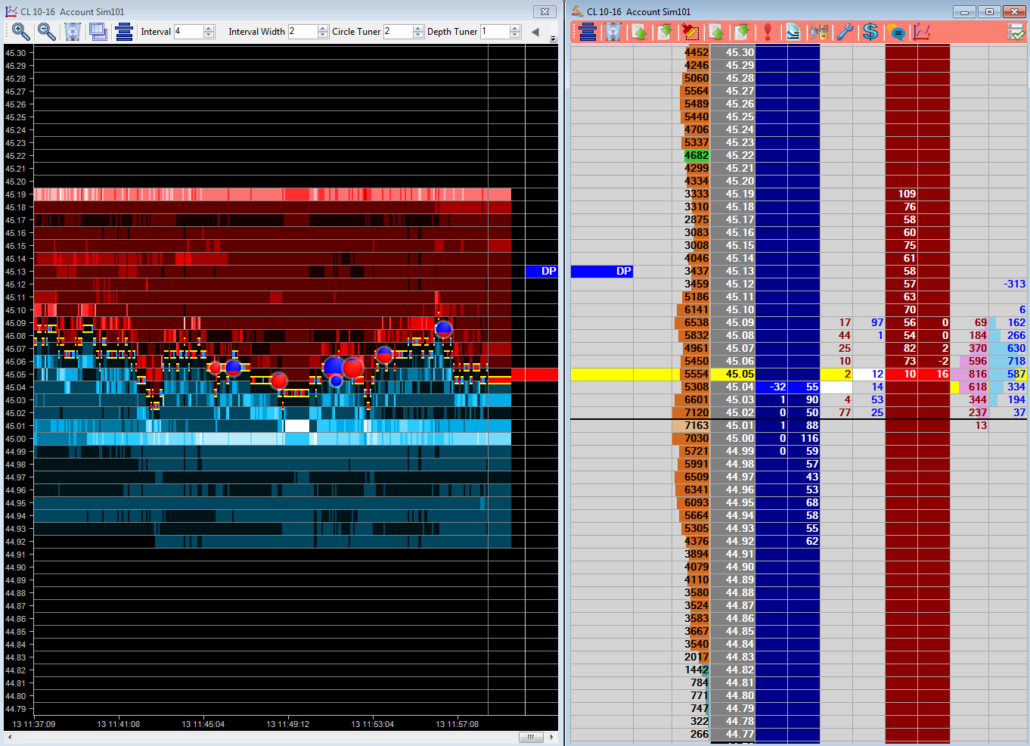
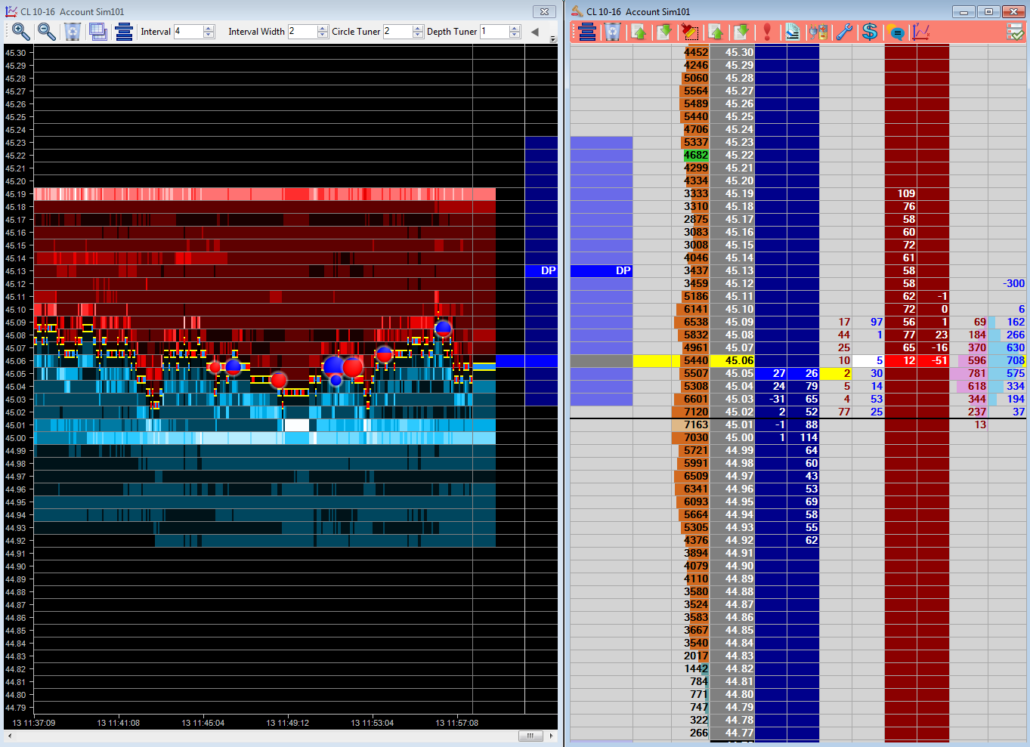
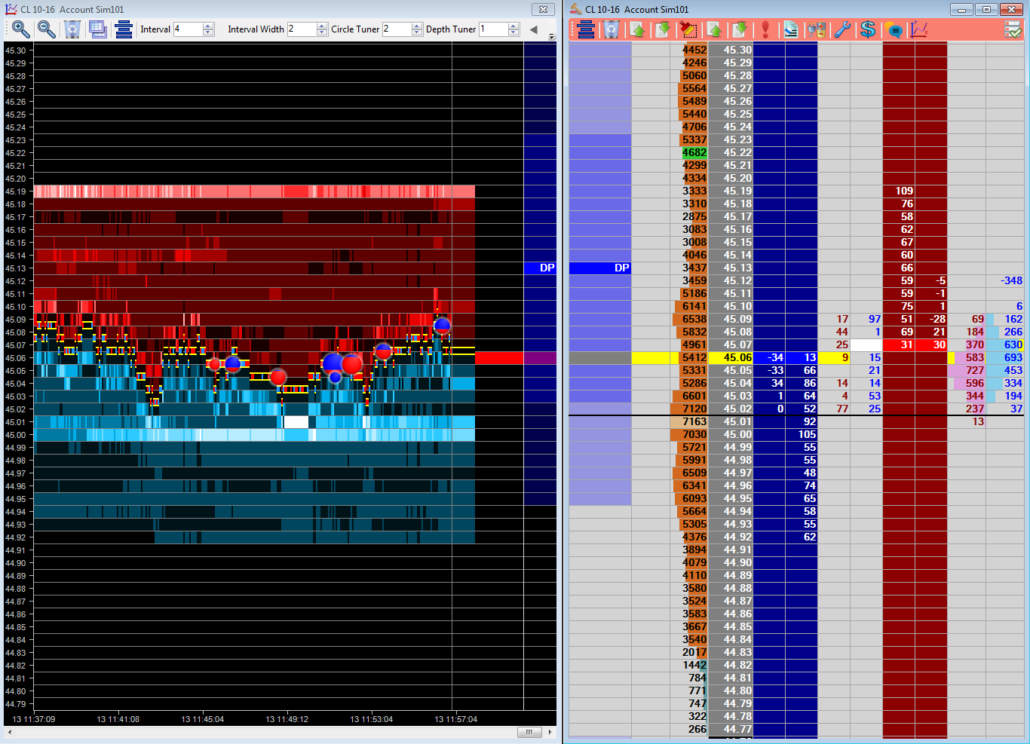
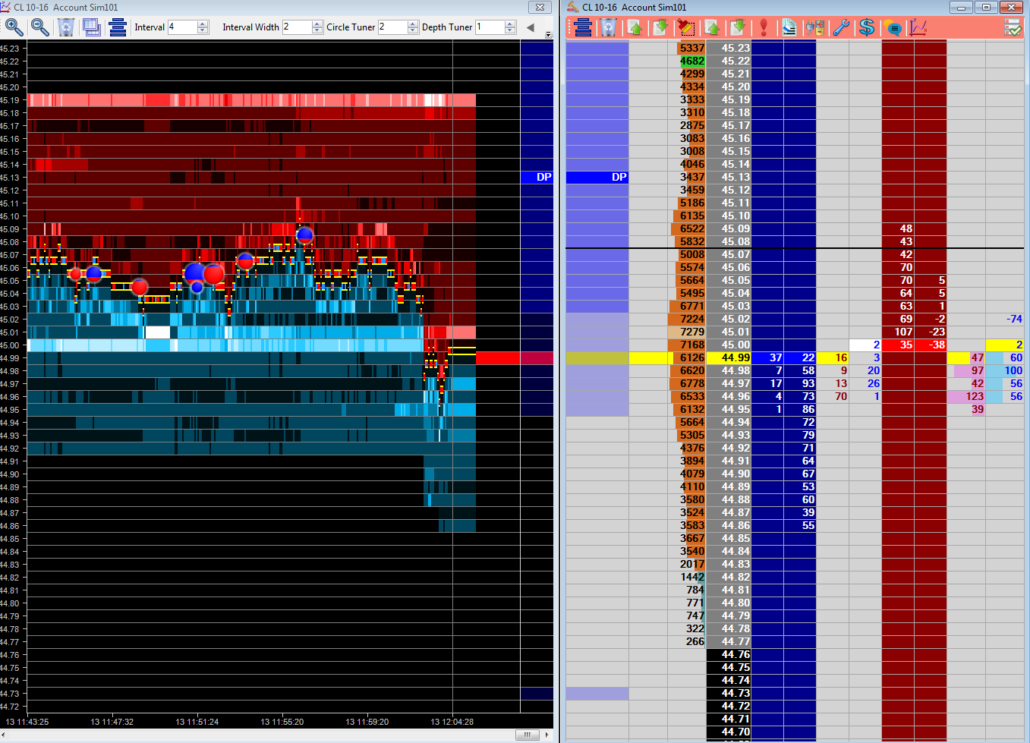
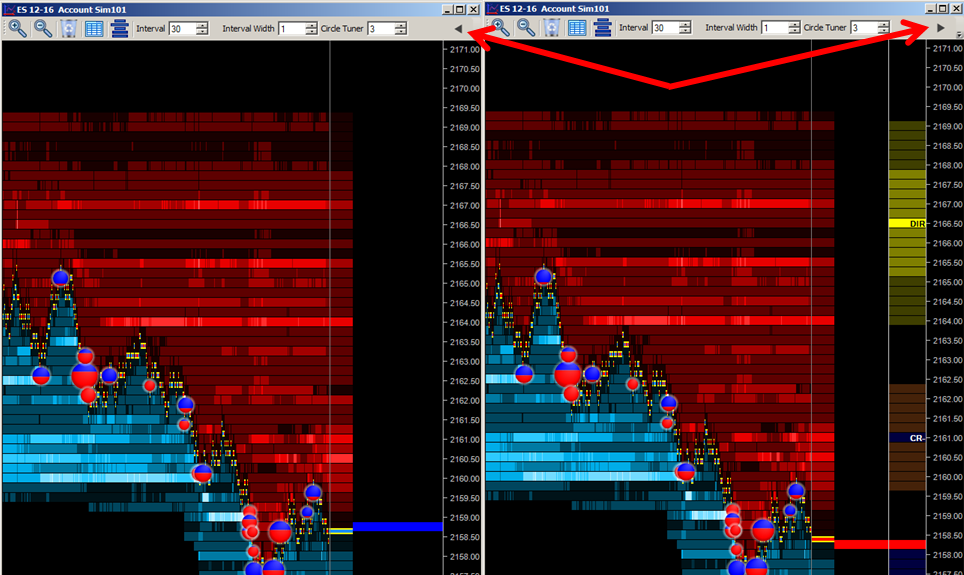
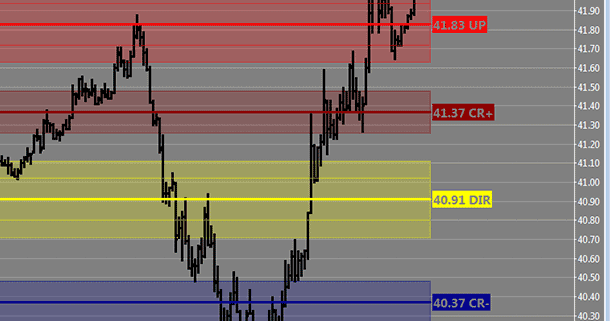
Peak performance is achieved by putting the process into action. All thinking is stripped away to action or no-action. TradeTactics are optimized at defined areas where TradeStrategy signals can be accepted. A trade or no-trade price threshold that supports a do or do not intuitive process. New technological advances offer additional ways to improve the effectiveness of a TradeStrategy by incorporating dynamic order book events. Through JSServices integration partners the unique ability to visualize specific order flow events offer an optimization tool to improve the effectiveness of TradeTactics and help traders achieve peak performance.


Get Started

STEP 1. Take the Personality Profile and have an Assessment created.

STEP 2. Send the your scores to info@jsservices.com and schedule a consultation to discuss the path that is best for you.


Optimizing TradeTactics

TradeTactics can be optimized when executed within market metric thresholds and their effectiveness improved by using real time order book events that identifying areas of intensity of trade, resting paper and liquidity shifts.

Overview

  • Market Metrics are the price thresholds for signal acceptance around a PriceMap level.
  • Intensity of trade is defined as an increased flurry of activity that is supported with good volume. This is displayed as a volume dot or circle on our integration partner platforms.
  • Resting Paper identifies price levels that have a significant amount of volume that has been “resting” for some time that identifies potential support or resistance.
  • Liquidity Shifts identify significant increase or decrease in volume at a specific price point which signal an increase or decrease to interest that that level.

Practical Application

Order book events provide insight for two types of events:

  1. Momentum REVERSAL
  2. Momentum BREAKOUT

When order book events occur within market metrics thresholds they provide additional clarity for TradeStrategies that have been normalized to specific PlayBook Themes. Performance is enhanced and the effectiveness of TradeTactics is optimized by incorporating order book events within market metric thresholds.

The following is a practical application of combining order book dynamics and market metrics to optimize execution tactics of a PlayBook strategy theme.

PlayBook ExampleES PlayBook Oct 14 2016

es-full-pb-oct-14-2016

R=CRX+

In the PlayBook example above the ES is in a BEAR TREND with the R LEVEL above the market at the CRX+. In this market structure bias (MSB) the negative sentiment of the BEAR TREND will remain intact below the CRX+ R LEVEL. The CRX+ is a validation level that will confirm or deny an upside CriticalRange BREAKOUT.

10-18-2016-2-51-10-pm

The FACT that the R LEVEL is equal to the CRX+ and is in the context of a BEAR TREND market state, makes it more likely that the CRX+ will contain an UP BREAKOUT. The R LEVEL in this position creates a “resistance band” to FADE momentum and accept exhaustive signals within the CRX+ – UP price band, anticipating a resumption of the BEAR TREND condition.

Optimal Strategy Theme

The OPTIMAL PlayBook Strategy Theme for the market structure bias is a SELL R FADE and a SELL UP REVERSAL. These strategies are in alignment with the general underlying BEAR TREND outlook that looks for sell signals below the R LEVEL.

The image below shows a successful performance for the Optimal Strategy theme for the ES on OCT 14 2016.

orderbook-int-trade-post-1

Market Metrics

By incorporating market metrics and the dynamics of the order book TradingTactics are optimized and performance enhanced. The image below shows the PriceMap overlay with market metric identifying the area of signal acceptance for the SELL R FADE and SELL UP REVERSAL.

orderbook-int-trade-post-2

Using the above image:

  • SELL R FADE – The market metric AD (Alert Distance) should be use as the initial entry for any FADE STRATEGY (R-AD in this example). By definition a FADE anticipates momentum to turn “in front” of the figure. Entry TradingTactics are enhanced by aligning them with the metrics that define the optimal threshold for signal acceptance. Without this intelligence good trades are missed which did not “make it” to the figure. By definition the “best” FADE is one that “exhausts” in front of the figure within the Alert Distance and Variance (VAR) Market Metrics.
  • SELL UP REVERSAL – A REVERSAL by definition is a “false breakout” that 1st violates a PricMap level and then trades back through it. The market metrics can be used to confirm a REVERSAL using the AD (Alert Distance) on both sides of the figure. First to signal a breakout by having price action exceed the UP+AD and next to confirm the exhaustive failure or REVERSAL by trading back through the UP-AD.
Order Book Dynamics

Order book dynamics optimize TradeTactics by providing key intelligence to the facts of the moment. The PlayBook identifies specific macro themes that TradeStrategies can be aligned to and normalized at specific PriceMap action levels. Market metrics define “where” a potential shift in momentum or state will occur by outlining the threshold of signal acceptance. Order book dynamics complete the optimization process by improving timing and identifying “when” an opportunity will occur and if it is valid. The image below shows how incorporating the micro structure of the order book enhanced the effectiveness of the execution of the SELL R FADE and SELL UP REVERSAL PlayBook Strategy Themes.

orderbook-int-trade-post-3-bm-2

Using the above image:

  • SELL R FADE – The context of the PlayBook Strategy Theme “FADE” and normalized PriceMap entry level “R” provide an expectation to anticipate a rejection from the R LEVEL which is the price point that represents the peak for any corrective action of the BEAR TREND state. The market metrics further improve vision by identifying the threshold area surrounding the R FADE to anticipate a rejection. Using this intelligence as the macro context of the SELL R FADE opportunity the order book dynamics provide the micro confirmation.
    • Order Book Events
      • Intensity of Trade – As price action breaks out above the UP there is a flurry of buying in-front of the R-AD metric. As the MKT trades into the signal acceptance area (R-AD) there is less intensity identifying a divergence of interest.
      • Resting Paper – A “wall” of resting paper builds up within the R-AD metric confirming an area of “resistance” which confirms the validity of the R LEVEL itself.  A re-test of the high area does not generate any intensity signaling a divergence in interest and confirming the SELL R FADE.
  • SELL UP REVERSAL – The “wall” of resting paper above the MKT gives a “more likely to occur” expectation to a negative turn and a resumption of the BEAR TREND. The macro context of the market state and structure provides trade vision that a REVERSAL from the UP would not only confirm the SELL R FADE strategy but would also generate a new sell opportunity with the potential to be the start of the next extension lower.
    • Order Book Events
      • Liquidity Shift – This event provides a “tell” that a new trend is developing by shifting liquidity down. In a prelude to a REVERSAL opportunity after a rejection from the R LEVEL a negative liquidity shift offers a chance to anticipate a failure from the UP-AD and get into a trade early with the order book shift.
      • Intensity of Trade – A failure from the UP-AD metric signals a SELL UP REVERSAL strategy which when supported by intensity of trade confirms the event and is similar to validating a BREAKOUT.
      • Resting Paper – It is interesting to note that prior to the UP-AD failure, resting paper below the market began to “move out of the way”, which was another “tell” confirming the negative sentiment shift and underlying dominance of the BEAR TREND condition.
Summary

Observing price action within market structure in the context of the market state and underlying PlayBook strategy themes provides a macro foundation for TradeTactics which can be optimized by incorporating market metric thresholds and order book events. This combination of macro structure and micro structure offers the best results in creating more effective execution of TradeTactics.

MarketMetrics – APMD (Average PriceMap Distance)

Average Price Map Distance (APMD)

APMD (Average Price Map Distance) = the price segment distance the MKT is trading in for the defined trade period.

IF we know the price segment distance the MKT is trading in, THEN we can forecast or anticipate price movement.

Markets are in a constant state of expansion and contraction. The ebb and flow of the expansion and contraction can be measured as a function of the APMD. Typically a MKT moves in ½, x1 and x2 APMD segment impulses. This is “typically”, or rather, what is more likely to occur, as x3 and x5 segment moves do happen during event conditions. As a general rule x1 APMD is a good measure for a “decision point”, when a MKT reaches the point of dynamic equilibrium and “decides” to either continue expanding or start contracting. The PriceMap Framework defines this market structure and the APMD represents the distance between these points to dynamic equilibrium.

In the example below the CRUDE OIL contract demonstrates this well over the 3 sessions.

marketmetric-apmd-1


Normalizing Exit Targets

Understanding the relationship between the PriceMap Framework and the APMD provides a metric to normalize exit targets for a TradeStrategy.

As a general rule the APMD should be used as the the minimum expected profit potential for a TradeStrategy executed at one of the PriceMap Action Qualifiers. R LEVEL strategies can go for more and be positioned for a x3 APMD move. A trade from the CriticalRange extremes has a minimum x1 APMD target but should go for x2 APMD and a DIR (Directional) trade x1 APMD. Any Validation level entry should base risk on a ½ APMD reward.

APMD Practical Application

Observing price action and the position of the LTP (Last Traded Price) within the PriceMap Framework provides awareness to the value of an opportunity. Trading tactics can be normalized by focusing signal acceptance at market structure points using the APMD as a measure of profit potential to define exit targets.

Identifying the relationship of LTP and the R LEVEL provides additional insight to the current expectation or “behavior” of price action. Momentum moving in the direction of the Sentiment Bias is more likely to follow through in the direction of that bias. The farther away from sentiment the LTP is, the farther away it is from the real “energy” or “liquidity”. Markets that expand >x2 APMD away from the R LEVEL may start to look “extended” and are more vulnerable to a “contraction” Even if that contraction is only ½ APMD. Keeping TradeStrategy signal acceptance in alignment with the Sentiment Bias is prudent, as is making position size or risk adjustments in accordance to the APMD distance between the R LEVEL and LTP.

Awareness is further enhanced by the significance the level has to the STRUCTURE of the STATE as well as the price segment distance the MKT has already achieved to get to the LTP level.

Example

In the example below, the MKT is in a BULL TREND state with sentiment positive, below the market equal to the DP (Downside Pivot). The UP represents the high point for any “contraction” of the positive trend and a valid SELL FADE opportunity. Prior to the UP being tested it was after a x1 APMD move from the DIR (Directional). This FACT combined with the R LEVEL being  x2 APMDs away from the UP, identifies lower positive energy at the top of the CriticalRange. The result of these  FACTS produce a x1 APMD “correction” back to the DIR where prices stabilize and produce a rally that is in alignment with Sentiment Bias for the trade period.

marketmetric-apmd-6


PlayBook Strategy Themes

MARKET STATE AWARENESS is improved by monitoring PRICE ACTION within MARKET STRUCTURE in the context of the MARKET STATE.

Specific strategy themes are inherent in the state structure dynamic and each theme has a profit expectation that is based on the APMD.

marketmetric-apmd-9

The image below identifies the Optimal and Hedge strategy themes for a BULL TREND MARKET STATE with the R=DP, that played out during the session along with expansion “E” and contraction “C” signals that produced ½ and x1 APMD segment moves.

marketmetric-apmd-10

The APMD MarketMetric provides reward expectations to normalize a TradeStrategy by identifying the price segment moves the market is trading in.  Many times it is not IF the market is going to make a x1 APMD move it is just a matter of how it is going to do it. Observing price action within market structure in the context of the market state provides awareness to opportunities. The APMD defines what those opportunities are worth so proper size and risk management can be applied.


Applications JSDesktop and Sierra Chart Price Map Chart Overlay


Personality Profile

Application Integration Bookmap

The JSServices PriceMap integration with Bookmap is contained within the Bookmap application itself as an “John Slazas Notes” or “JSNotes” Add-On.

DEMO Bookmap with JSNotes Integration and JSDesktop

The JSNotes integration works in conjunction with the JSDesktop so you will need to download both applications.

  1. Please click here for a  JSNotes DEMO
  2. Please click here for a  JSDesktop DEMO

For more information please contact us at info@jsservices.com

Bookmap Clients

Bookmap clients are able to subscribe to the John Slazas Notes through the Member area Add On section.

bookmap-integration-1

JSNotes Set-Up

Once enabled the John Slazas Notes column can be inserted by right clicking on any column.

bookmap-integration-2

The full PriceMap Framework is presented in the JS Notes column along with the Market Metrics associated with each level.

Directional and Major PriceMap levels will have both a VAR and AD metric identified as shown below. Minor PriceMap levels will only have there VAR displayed.

bookmap-integration-3

Click here for more an Overview of the JSNotes.


Application Integration Jigsaw Trading

The Jigsaw Trading integration works with the JSDesktop so that the PriceMap Framework and Market Metrics are visible on both the Depth & Sales and Auction Vista.

cl-jt-8-26-2016-2-36-51-pm

STEP 1

Be sure you are running Jigsaw Trading version 5.4 or higher.

STEP 2

Open the JS Desktop application, which will automatically create a file with the PriceMap levels for that day. The REFRESH button can be used to request an update.

jsdesktop-jt-integration-1

STEP 3

  1. OPEN the Jigsaw TOOLS Depth & Sales Settings window and select the JSS tab.
  2. The DATA FILE path should be set to your C:\Users\???\Documents\JSServices\ directory with the \JSData.xml file extension that you want to LOAD
  3. Select LOAD to import JSData into Jigsaw

jsdesktop-jt-integration-2

STEP 4

The JSS Tab defines the different options for JS Services Jigsaw Integration.

jigsawintegration-3

Data File – The location of the data file produced by the JSDesktop Tool. By Default this is the (My) C:\Users\???\Documents\JSServices\JSData.xml Documents\JSServices\JSData.xml

Instrument – The Jigsaw Depth & Sales Settings Instrument id defaults to the first 2 characters of the platform instrument id. The Instrument id must match the JS Symbol from the JSDesktop Market Grid. If it does not, then change the Instrument to the JS Symbol. For example IF ZN is entered in the Instrument box for the 10yr T-NOTE futures THEN change it to the JS Symbol TY to view the Price Map levels for the 10yr T-Note.

Load – Click the LOAD button to update the levels each day. The data is loaded from the JSDesktop which will automatically update if left open. Note the Desktop date to confirm it is current. If not then refresh the JS Desktop so it has the correct Date and then click LOAD in the JSS integration setting to update JIGSAW.


View Options– Allow you to customize the JSServices PriceMap levels to be displayed.

o Show CriticalRange – Check if you want to display CriticalRange

o Show All Major Levels – Check if you want to display all Major PriceMap Levels

o Show All Minor Levels – Check if you want to display all Minor PriceMap Levels

o Show VAR – Check if you want to display the Variance around the level

o Show AD – Check if you want to display the Alert Distance around the level

o Show MSD – Check if you want to display the Maximum Stop Distance level

Examples:

Show CriticalRange, all Major Levels and Minor levels

jigsaw-1

Show VAR

jigsaw-2

Show AD

jigsaw-3

Show MSD

jigsaw-4

Note: Use the open arrow key to show and hide the PriceMap levels on the Auction Vista.

jsdesktop-jt-integration-3


Web Videos

Daily Recap CL Example with Jigsaw Integration set-up

Strategy Recap: ES Example with Jigsaw Part 1

Strategy Recap: ES Example Part 2

Strategy Recap: ES Example Part 3


Webinar

Optimizing Trade Tactics Jigsaw Webinar http://www.jigsawtrading.com/auction-vista/optimize-trading-tactics-to-make-them-more-effective/?mc_cid=e69e9cca58&mc_eid=30deff3432


Application Integration Trading Technologies

ttlogo

This document will go over how to integrate JSPriceMap Analytics with Trading Technologies MDTrader, XStudy Charts and ADL.

The JSDesktop Data Utility function creates an Excel (JSSheet.xls) in its Default Integration Script which is used to dynamically link into MDTrader, XStudy and ADL.

tt-integration-1

The JSSheet.xls file is saved in the C:/Users/………../Documents/JSServices/ directory.

11-2-2016-3-19-05-pm


STEP1 – OPEN the JSSheet that was created using the Default Integration Script 2 first before opening TT. The Excel sheet must remain open and stay open until after TT is closed to ensure the integrity of the dynamic linking. If you close the JSSheet prior to closing TT you may lose ALL you saved links.

JSSheet TT VIEW 11 Example

tt-integration-1

MDTrader

STEPS to ADD JSServices PriceMap analytics to MDTrader.

  1. Right click to open properties window and check ADD INDICATOR COLUMN. Set as default.
  2. Right click on the JSSheet Symbol and PriceMap level and select copy
  3. Right click on the MDTrader middle price column and paste. Do the same for both the left and right indicator columns. You don’t need to scroll to paste at the exact price for the links to work but you do need to link all 3 columns for each PriceMap level you want linked to the MDTrader window. You can scroll up and down the ladder after you have created the links to confirm that they are working.
  4. Save your settings

tt-integration-2

XStudy Chart

STEPS to ADD JSServices PriceMap analytics to an XStudy chart.

  1. Right click on the JSSymbol PriceMap level column highlighting up to 10 price levels at a time and COPY.
  2. Right click on the Chart and click PASTE. The PriceMap level should show up on the chart in the correct color code.
    1. If the PriceMap levels come up in BLACK then you must remove the black border of the excel cells. Be sure there are no borders
    2. If PriceMap levels do not show up be sure you have cut and paste the correct JSSymbol and price to the same XStudy chart symbol.
    3. To customize the thickness of the PriceMap level highlight level on the chart and right click to edit font size.
  3. Save your settings

tt-integration-3


ADL

STEPS to ADD JSServices PriceMap analytics to an ADL template.

  • Right click on the JSSymbol PriceMap level and COPY.
  • Right click on the ADL User defined variable and click PASTE.


tt-integration-5

Application Integration Sierra Charts


sierrachartlogo


Sierra Charts Webvideo Tutorial Click here


There are 2 STEPS to ADD JSServices PriceMap analytics to a Sierra Charts. Step 1 is the JSData integration which creates the js_data.xml file that Sierra Charts needs to “read” the analytics and the Step 2 is the Set-Up procedures to load the PriceMap script into Sierra Charts with the proper display settings.

Step 1 : JSData Integration

A Sierra Chart Integration Script must be created in the JSDesktop Preference section.  The script must have a -outputFilename= “js_data.xml“. Sierra Chart uses the js_data.xml file to display the data. Below is a sample script which should be entered in the INTEGRATION SCRIPT tab 4 or 5.

Example

jsget -outputView=11 -outputType=xml -outputFilename=”js_data” -outputDirectory=” C:\SierraChart\Data” -dateRange=3 -overwrite –indent

After the script is entered click on the gear with the green check to confirm that everything has been entered correctly. If not an ERROR message will alert you to the issue. If the script has been entered correctly then a message of “No Issues found” will be shown. To test that the script is working, click on the small gears to run the script. The large gear to the left will reset the script to the default settings.


STEP 2 : Sierra Charts Set-Up

Note: Prior to the Set-Up process you must send mailto:info@jsservices.com your Sierra Charts User ID. Please let us know if you are on Transact. The JSServices Sierra Chart integration does not need to be downloaded separately it is all done with permissions using your User ID within Sierra Charts. Be sure to have the latest version of Sierra Charts loaded.

Set- Up procedures

  1. Open ANALYSIS –> STUDIES editor or type F6
  2. Select ADD CUSTOM STUDY to open the Add Study Window
  3. Locate STRATEGY ALERTS and select PRICE MAP OVERLAY
  4. Select PRICE MAP OVERLAY
  5. Click ADD

sierra-integration-1

6. Click SETTINGS to open the STUDY SETTINGS PRICE MAP OVERLAY window

7. Edit the JS Symbol. The symbol should match the symbol on the JSDesktop MarketColor Grid.

8. Click OK

sierra-integration-2

  • Note: You can right click on the chart tab and select DUPLICATE CHART. This will create a chart with the identical settings. To create additional market hit F5 to open the CHART SETTINGS menu and edit the SYMBOL of your choice. Save and then HIT F6 to open the STUDIES window and edit the JS SYMBOL SETTINGS. After you have created all the charts you want by repeating this process save them in a CHARTBOOK.

DAILY REFRESH

When you open the CHARTBOOK each day the PriceMap levels may not be visable until you change a chart parameter like the chart TIME from 3min to 5min for example. An alternative is to OPEN the CHARTBOOK and then CLOSE the CHARTBOOK. Then when you OPEN it again all the levels should be displayed.

CUSTOMIZATION

The PriceMap levels and Market Metrics can be customized by right clicking the chart.

  • Show Minor
  • Show VAR
  • Show AD
  • Show MSD
PriceMap BASIC VIEW

If no features are selected only the Major Price Map Levels (MPML) are displayed. This provides a nice broad overview of the key Market Structure PriceMap levels.

sierra-integration-3

PriceMap FULL view                                                                         

If the Show Minor Levels feature is selected the FULL PriceMap will be displayed.

sierra-integration-4

MARKET METRICS

The Market Metrics identify the area of influence around a PriceMap level. Each metric has its own variance and meaning. These metrics are dynamically updated each day in accordance to the volatility expectation of the trade period.

VARIANCE (VAR)

The VAR metric represents the optimal area to entry or exit the market. It also identifies the potential “slippage” area around a Major PricMap level.

sierra-integration-5

ALERT DISTANCE (AD)

The AD identifies the value area or sweet spot around a PriceMap level. This is the distance that defines the zone that most profitable trades will occur within. In addition it is a good metric to identify when market price is “through” a level.

sierra-integration-6

MAXIMUM STOP DISTANCE (MSD)

The MSD is the maximum distance for any influence a PriceMap level with have and confirmation that the level has been violated.

sierra-integration-7

PriceMap Market Metric FULL VIEW

In the FULL VIEW the Minor PriceMap levels will only have the AD displayed. There are no VAR or MSD metrics for the Minor PriceMap levels.

sierra-integration-8

Additional Features

The default setting displays the current trading session PriceMap data. Up to 3 days’ worth of data can be requested by adding the following parameter to the Integration script : -dateRange=3. Below is an example that will grab 3 days’ worth of JSData. 3 is the maximum number of days that can be displayed. This may slow the daily retrieval down slightly.


Script Example:

-outputView=11 -outputStyle=5 -outputType=xml -outputFilename=”js_data” -outputDirectory=”C:\SierraChart\Data” -dateRange=3 -overwrite –indent

scscreen5


Application Integration NinjaTrader


Integration

How to set-up the JS PRICEMAP Integration Video click HERE

  1. DOWNLOAD DATA
  2. DOWNLOAD and IMPORT the JS NT SCRIPT
  3. ADD the PRICEMAP to a CHART
  4. EDIT the SETTINGS
  5. DISPLAY FEATURES


STEP 1 DOWNLOAD DATA

The PRICEMAP integration for NinjaTrader comprises two essential parts:

  1. The NinjaScript indicator, which displays PRICEMAP levels on your chart.
  2. The data files, which contain the price levels shown.

Updating this data is a crucial part of your DAILY WORKFLOW.

To DOWNLOAD DATA:

  • OPEN the PLAYBOOK
  • Refresh the PLAYBOOK to be sure you have the current data.
  • Go to the DOWNLOAD TAB and select the PriceMap files you want to download.
    • PriceMap file contains DAILY, WEEKLY, MONTHLY data available for Tier 2 subscriptions.
    • PriceMap Daily file contains ONLY DAILY data is for Tier 1 subscriptions.

  • Selected files will show up in Your DOWNLOAD directory.

  • Choose an existing directory or create a new one on your local drive to store the files. The directory name is flexible; however, consistency is key. Ensure you save and overwrite files in this specific directory each trading day.
    • Avoid copying and pasting them directly from the DOWNLOAD directory. Instead, select the files and drag them to the designated data directory (e.g., C: folder). This ensures the original files are moved out of the DOWNLOAD directory.

  • Note: Direct copying leads to duplicate files in the DOWNLOAD directory, like PriceMap-Futures.csv. When you download again, the system will generate a new file, PriceMap-Futures(1).csv, which disrupts the integration due to the changed filename. Dragging ensures the file is moved, not duplicated.
  • Remember the file path. For this example: C:\NinjaTrader\ PriceMap-Crypto.csv


STEP 2DOWNLOAD and IMPORT the JS NT SCRIPT

1. DOWNLOAD JS NinjaScript

Download and save the JS_NT8.zip file from the JS PLAYBOOK DOWNLOAD tab. You can save it in the same directory you created for your data files.

2. Remove Previous JS NinjaScript Version

  1. If you already have an older version of the JS NinjaScript installed, it’s essential to remove it before importing the new one. If you do not, then proceed to Step 4.
  2. Open the NinjaTrader Control Center.
  3. Navigate to TOOLS > Remove NinjaScript Assembly.
  4. From here, select and remove the older version of the JS NinjaScript.
  5. Once removed, you can proceed to import the new version.

3.  Import JS NinjaScript

    1. Open the NinjaTrader Control Center.
    2. Navigate to TOOLS > IMPORT.
    3. From here, select > NinjaScript Add On.

  1. This should open the directory that contains the JSS_NT8.zip. If not go to the directory you saved the file in, find the file and select it.

NinjaTrader will confirm the success of the IMPORT. If not close and re-open the NT application and repeat STEP 2.

STEP 3 ADD the PRICEMAP to a CHART

  1. Open the INDICATORS window and scroll down to find the JS PriceMap Overlay Indicator.

2. Select the JS PriceMap Overlay Indicator and select ADD.

3. Enter the JS Symbol with the Time Frame for the desired PriceMap period. Example below:

TY.D = 10yr T-NOTE DAILYPriceMap

TY.W = 10yr T-NOTE WEEKLY PriceMap

TY.M = 10yr T-NOTE MONTHLY

  • For JS SYMBOL LIST click HERE

4. Enter the CSV FILE path. Be sure to enter the entire directory name, file name and extension. Example below (Your path will be unique to your machine):

    • C:\Users\JSTRADE\NinjaTrader\PriceMap-Futures.csv

5. Click APPLY then OK. The PriceMap Levels should appear.

Trouble Shooting

If the PriceMap levels do not show up

  • Be sure you are connected to the internet and NT data source connection.
  • Be sure to check the spelling of the CSV PATH. The entire directory name, file name and extension are needed.
    • C:\Users\JSTRADE\NinjaTrader\PriceMap-Futures.csv
  • Be sure the CSV file is in the directory you entered in the CSV PATH and it has the correct date.

6. Set up All PriceMap Indicator Timeframes

  1. Highlight the DAILY JS PriceMap Overlay that you just created and Click the TEMPLATE button in the lower right-hand corner.
    1. Name and Save this template. You can then load this template in the future with your CSV path and customized settings only having to edit the JS Symbol and Time Frame extension.
  2. Highlight the JS PriceMap Overlay Indicator and add two additional instances to display the WEEKLY and MONTHLY PriceMap levels.
    1. Load the Saved Template and edit the appropriate JS Symbol extension (.W and .M).


STEP 4 EDIT the SETTINGS

The PriceMap Overlay Indicator has many customization settings. This section will go over the key ones that can ONLY be modified in the setting Properties not directly from the chart Display:

  1. Qualifier COLOR
  2. Display Options
  3. Price Label Display

  1. QUALIFIER COLOR – Each of the PriceMap qualifiers coloring can be edited however we do not recommend doing so other than to change the shade slightly to contrast better with the background chart color. All qualifier colors aere standardized in the education tutorials are a key awareness component for more intuitive execution. For example, my chart background is dark and I slightly lighten the DP “Blue” to make it easier to read the qualifier label against the dark chart background.
  2. DISPLAY OPTIONS
    1. PriceMapNewPeriod – This is an advanced setting designed for specific times during the week or month and offers insight rather than structural information. Purpose: It previews potential PriceMap levels and the R LEVEL for the upcoming period, assuming the previous period close was the current periods. Key Points:
      1. Not Valid for Trading: These levels aren’t valid for trading decisions.
      2. Insight at Period Ends: For instance, when using the (.M) symbol for the monthly PriceMap, this setting provides insights on possible R LEVEL shifts in the new month while applying this display option during the end of the current month’s settlement period.
      3. Not Guaranteed: These previews aren’t definitive. True structure emerges only after the period closes.
      1. Useful for Overlaps: Gaining insights into possible shifts can be valuable for decisions that stretch into the new time frame as the New Period R LEVEL and DIR will influence momentum bias.
      2. Not for Daily (.D) Traders: Do not use this setting for the DAILY PriceMap. If your PriceMap levels seem off, check if “PriceMapNewPeriod” is selected in DISPLAY OPTION. Switch to “PriceMapCurrentPeriod” if it is.

      Remember, use this feature wisely and understand its limitations.

    2. PriceMapCurrentPeriod
      1. This is the recommended display setting.Purpose: It shows the levels for the current time period.Key Points:
        1. Valid for Trading: These are the only PriceMap levels considered valid for trading decisions.
        2. Stay Current: Ensure accurate and real-time trading insights by always using the “PriceMapCurrentPeriod” setting.

        For optimal trading accuracy, it’s essential to use this recommended setting.


  1. PriceMapPerPeriod
    1. Overview: This setting offers a combined view of the current PriceMap and its historical counterparts. Benefits:
      1. Deep Dive into Past Behavior: By observing past PriceMap patterns, gain a clearer understanding of market trends and behaviors.
      2. Inform Current Actions: Historical insights can shed light on the market’s present tendencies.
      3. Decision-making Guide: Keep in mind, only the current period’s levels are actionable for trading. Use historical levels purely for context and not for direct trading actions.

      For effective trading, rely predominantly on the current period’s PriceMap levels.


  1. SHOW PRICE LABELS
      1. ALL: Useful for those wanting a detailed view, especially when combined with the PricePerPeriod historical display for back testing purposes.
      2. CurrentSession: Generally the preferred setting, this displays only the labels for the ongoing trading session. It helps to avoid label overlap over price action, ensuring clarity.
      3. Disabled: opt for a clean view with no labels displayed at all.

STEP 5 DISPLAY FEATURES

The display features are accessed by RIGHT CLICK on the chart. Here are the basic Display Features:

R LEVEL ONLY

CRITICALRANGE ONLY

ALL MAJOR and MINOR LEVELS

VAR Metric Boundary

AD Metric Boundary

MULTI TIME FRAME VIEW


Additional Features

JS TIME FRAME STRUCTURE

The JS TIME FRAME STRUCTURE Indicator can be accessed in the same manner as the JS PriceMap Overlay. The TIME FRAME STRUCTURE plots the Previous Period HIGH, LOW, CLOSE and MIDPOINT and the Current Period HIGH, LOW and MIDPOINT.

SET-UP INSTRUCTIONS

  1. Add the Time Frame Structure Indicator
  2. Add the JS Symbol Only. Do not add an extension.
  3. Add the csv file path and file name.

4. Click APPLY and OK

DISPLAY SETTINGS

The default setting is for the indicator to display all time frames for both the Current and Previous Period.


RIGHT CLICK on the chart to select the desired Time Frame and period to display. You may have to scroll down to view all the display options.


Below is a view of the PREVIOUS DAY and the PREVIOUS WEEK parameters.


NOTE on Time Frame Structure:

Prioritizing the PREVIOUS PERIOD TIME FRAME STRUCTURE is essential, as it holds more significance than the CURRENT PERIOD. The data for the CURRENT PERIOD, sourced from the data file, can be outdated, especially if the market is recording new highs or lows for that time frame.

However, as we approach the end of a time frame period, the CURRENT PERIOD structure gains relevance. A notable exception is the CURRENT PERIOD MIDPOINT, equivalent to the period’s VWAP, which remains consistently valid.

Recommendation: Focus primarily on the PREVIOUS PERIOD. It serves as the main time frame structure and provides a more reliable foundation for trading decisions.