Application Integration Trading Technologies
![]()
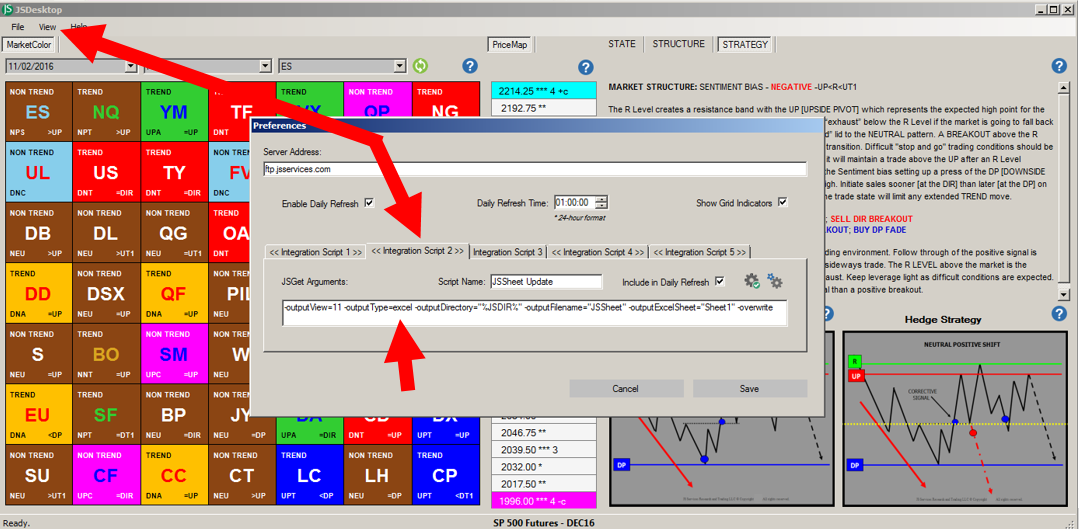
This document will go over how to integrate JSPriceMap Analytics with Trading Technologies MDTrader, XStudy Charts and ADL.

The JSDesktop Data Utility function creates an Excel (JSSheet.xls) in its Default Integration Script which is used to dynamically link into MDTrader, XStudy and ADL.
The JSSheet.xls file is saved in the C:/Users/………../Documents/JSServices/ directory.
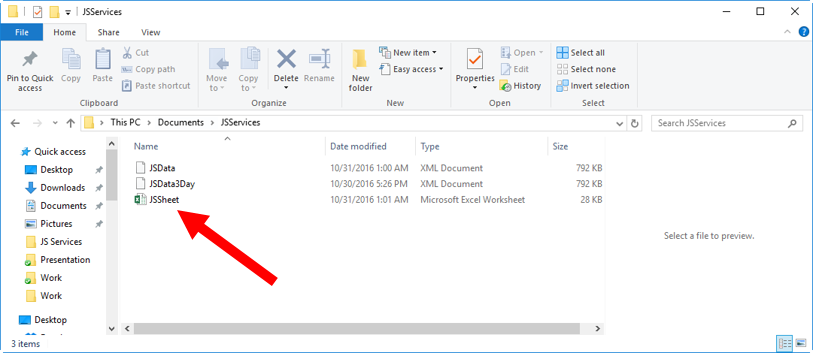
STEP1 – OPEN the JSSheet that was created using the Default Integration Script 2 first before opening TT. The Excel sheet must remain open and stay open until after TT is closed to ensure the integrity of the dynamic linking. If you close the JSSheet prior to closing TT you may lose ALL you saved links.
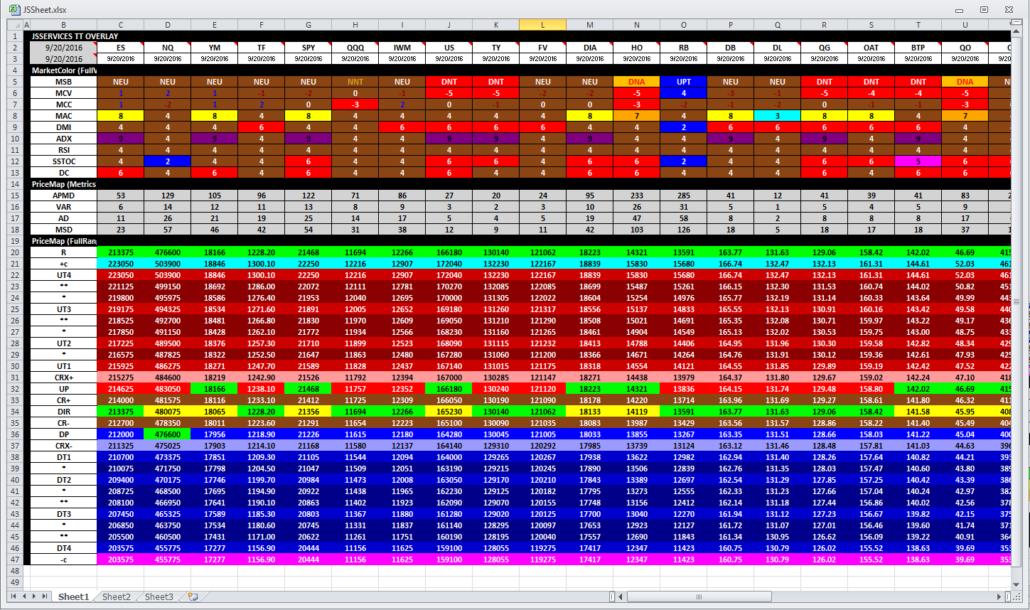
JSSheet TT VIEW 11 Example
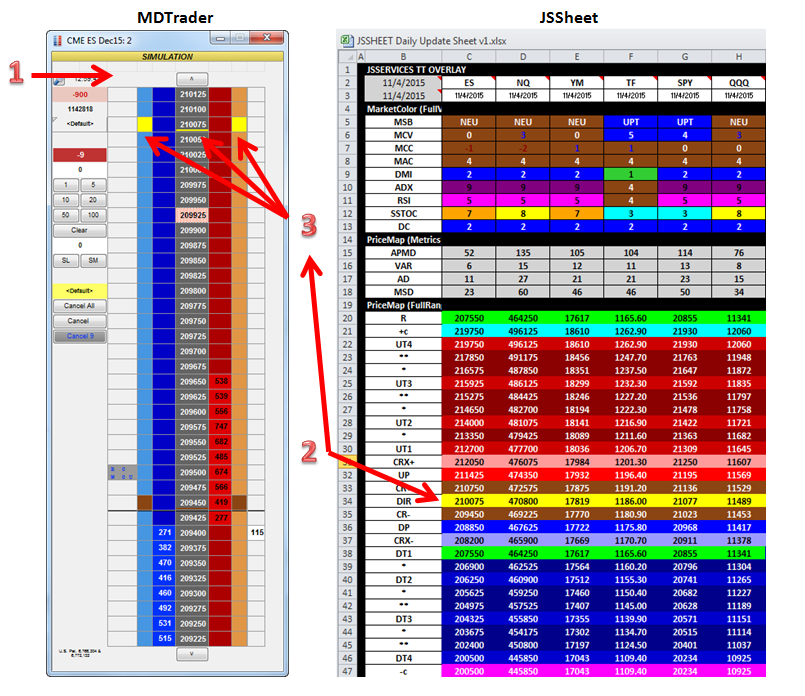
MDTrader
STEPS to ADD JSServices PriceMap analytics to MDTrader.
- Right click to open properties window and check ADD INDICATOR COLUMN. Set as default.
- Right click on the JSSheet Symbol and PriceMap level and select copy
- Right click on the MDTrader middle price column and paste. Do the same for both the left and right indicator columns. You don’t need to scroll to paste at the exact price for the links to work but you do need to link all 3 columns for each PriceMap level you want linked to the MDTrader window. You can scroll up and down the ladder after you have created the links to confirm that they are working.
- Save your settings
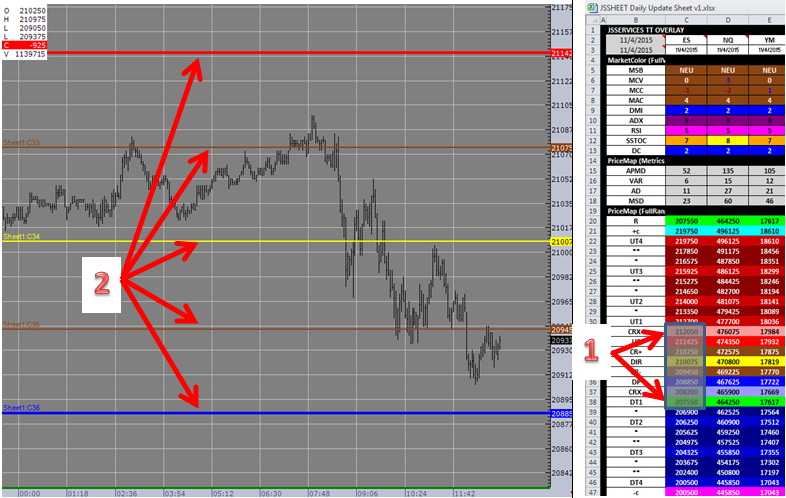
XStudy Chart
STEPS to ADD JSServices PriceMap analytics to an XStudy chart.
- Right click on the JSSymbol PriceMap level column highlighting up to 10 price levels at a time and COPY.
- Right click on the Chart and click PASTE. The PriceMap level should show up on the chart in the correct color code.
- If the PriceMap levels come up in BLACK then you must remove the black border of the excel cells. Be sure there are no borders
- If PriceMap levels do not show up be sure you have cut and paste the correct JSSymbol and price to the same XStudy chart symbol.
- To customize the thickness of the PriceMap level highlight level on the chart and right click to edit font size.
- Save your settings
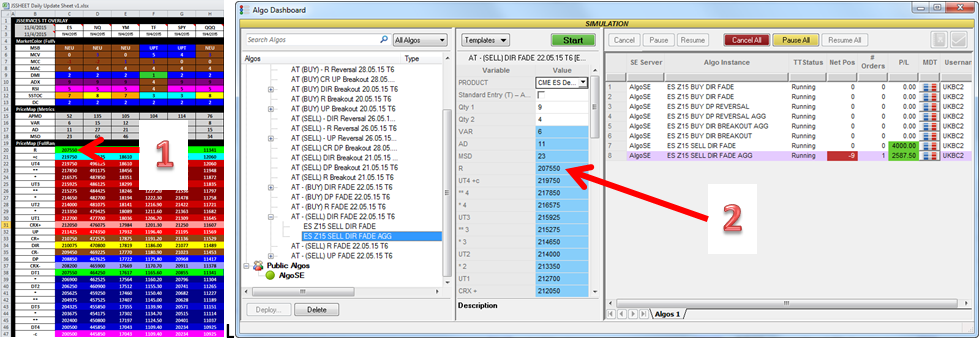
ADL
STEPS to ADD JSServices PriceMap analytics to an ADL template.
- Right click on the JSSymbol PriceMap level and COPY.
- Right click on the ADL User defined variable and click PASTE.