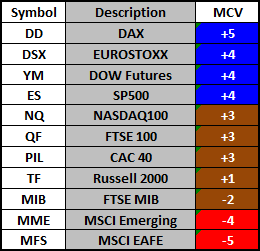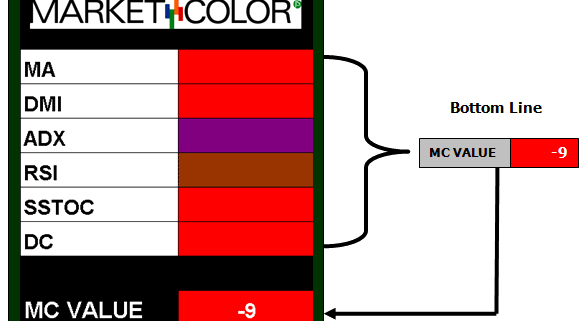
MC VALUE (MCV)
The MCV is a summation of the different MarketColor technical indicator systems and represents a market’s technical bottom line position.
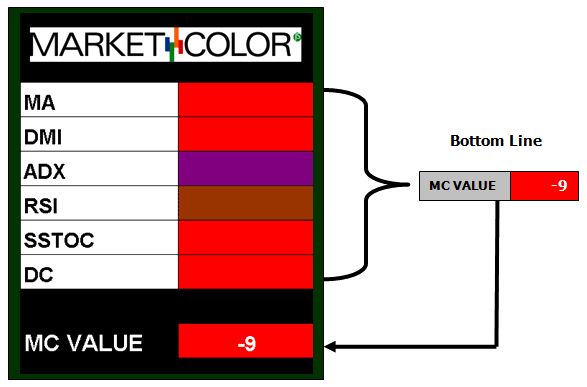
MCV defines a market’s general market state type as a single value technical “rank”. Markets with more systems in a positive position will have a greater positive MCV, and markets with more systems in a negative position with have a greater negative value. Markets counter balanced or neutral will have a value close to zero (0).
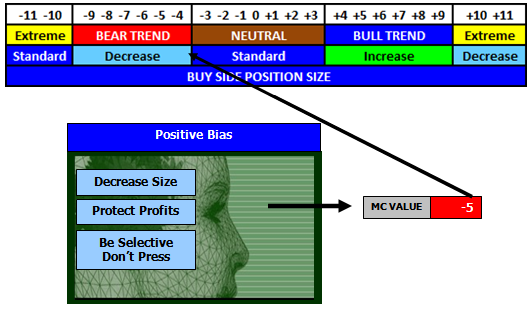
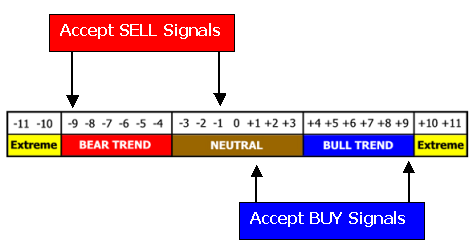
MCV TABLE

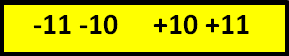
In the table above, each segment defines a general state where the –3 to +3 segment is the NEUTRAL ZONE, -9 to –4 and +4 to +9 are the TREND ZONES and 10 to 11 on either side are the EXTREMES.
It is important to remember that this is not a “signal” of what might occur but rather a definition of what “is” the market’s current technical state. Just because a market has a positive MCV does not mean one should just buy the market. It just means that buy signals will have a better chance of succeeding over sell signals because the market’s underlying technical state is positive.
The MCV defines the session “playing field” so strategy criteria can be optimized and aligned with the Market STATE.
Example:

DIRECTIONAL BIAS = SELL STRATEGY SELECTION = NON TREND
- A market with an MCV = -3 is in the soft side of the NEUTRAL zone. The expectation is that the market is vulnerable to a negative shift into a BEAR TREND state or has the potential to bounce back to the middle of the NEUTRAL zone. SELL strategies in this technical state are expected to have more potential over BUY strategies. However, the market’s NEUTRAL posture may limit any opportunity, valuing deviation NON-TREND type tactics over TREND type.
The MCV summarizes the MarketColor profile results into a single value within a bounded scale, providing an “at a glance” indication of a market’s technical position. The effect is an objective numerical definition of a market’s general state type that can be used for Strategy Selection, Size Management, and as a technical Relative Strength comparative.
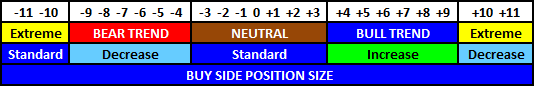
MCV – NEUTRAL
 NEUTRAL ZONE
The -3 to +3 area defines the NEUTRAL ZONE. Markets in this position are in 3 typical states; Digestion, Correction or Transition.
DIGESTION – A sideways environment with choppy trading conditions. In this condition directional moves are not expected to be sustained. Opportunity exists on both sides of the market, albeit profit potential is limited and should be realized “sooner than later”. Fade and Reversal strategies are recommended. Markets that do end a session with a strong directional bias will have trouble sustaining that bias in the coming session, without the support of a like change in the next session’s MC Value.
CORRECTION – The market has been displaying a directional bias and has had >2 sessions with an MC Value in the Trend zone. A Neutral MC Value following these conditions signals a potential “corrective” trade. The longer the “established” trend and the “sharper” the MC Value “shift”, the more likely the market is in a corrective mode. Best opportunity exists in entering the market in the direction of the previous trend. Fade, Reversal and Breakout strategies in the direction of the previous trend are recommended.
TRANSITIONAL – The market has seen a steady deterioration in directional bias, slowly moving from the Trend Zone to the Neutral zone. These are difficult trading conditions. False signals in both directions are common. Opportunity exists on both sides of the market however aggressive risk management should be implemented. Reversal and Breakout strategies are recommended. Successful Breakout or Trend strategies under these conditions are a “one-shot” opportunities, using aggressive trail stops and having expectations of a one-way “railroad” trading environment.
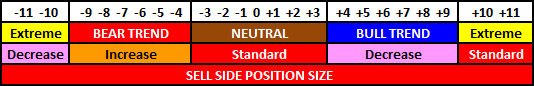
MCV – TREND


BEAR TREND ZONE BULL TREND ZONE
The BULL TREND and BEAR TREND define the Positive and Negative Trend Zones respectively. Markets in this position are in 3 typical Trend states; Beginning, Established and Late (End).
BEGINNING TREND – The market has had >= 2 sessions with the MCV in the trend zone. The environment is expected to be “stop and go”, with opportunity on both sides of the market with the best opportunity @ the R Level in the direction of the Trend bias. Fade and Reversal strategies are expected to be more successful over Breakout strategies as the Trend has yet to establish itself and may be “choppy”.
ESTABLISHED TREND – The market has had >3 sessions of MCV in the trend zone, at least one value => 6. Values of 7 or 8 show a strong trend bias. Breakout and Fade strategies in the directional of the MC Value and R Level bias are recommended as well as Reversal strategies in both directions. Expectations are for a “smoother” trading environment.
LATE TREND STAGE – The market has had >= 9 sessions in the Trend Zone with at least 3 sessions >= to 8 and one of those sessions a >=9. Trend strategies remain in effect, however large price movement in the direction of the trend bias should not be expected to be maintained. Any Breakout strategy should look to take profit on “exhaustive” surges as the market is expected to “give back” the bulk of the intra-day move in this stage. Reversal strategies should focus on counter trend opportunities as these signals are expected to be a foreshadowing of an impending “correction” or “digestive” trade.
MCV – EXTREME
NEGATIVE EXTREME ZONE POSITIVE EXTREME ZONE
These zones define the Positive and Negative Extremes. Markets in this position are extended and are expected to Reverse or trade in a sideways digest. Counter trend Reversal, Oscillator OB/OS type Fade, divergence and Breakout strategies are recommended. Breakout strategies in the direction of the trend are not advised however if implemented should use tight risk management. The market is at an extreme and an exhaustive or reversal signal is expected.