Risk Structure
![]()
RISK STRUCTURE
Volatility Indices are used to identify the underlying risk condition or STATE a market is currently in. The PriceMap sentiment bias or R LEVEL for the underlying security or futures contract defines the RISK STRUCTURE of the RISK STATE. Observing price action of the underlying security or futures contract, within the RISK STRUCTURE, in the context of the VIX RISK STATE provides awareness to markets vulnerabilities.
Example
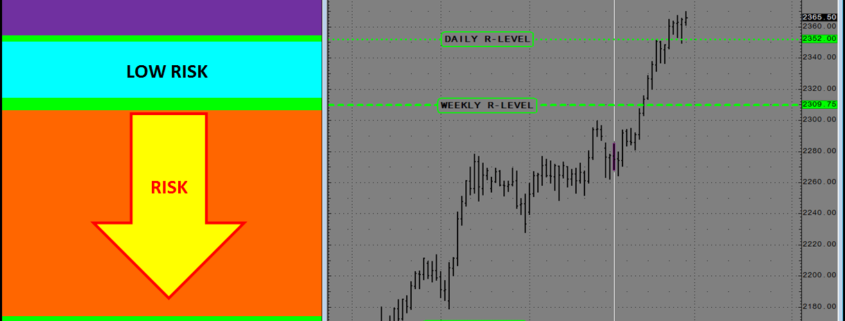
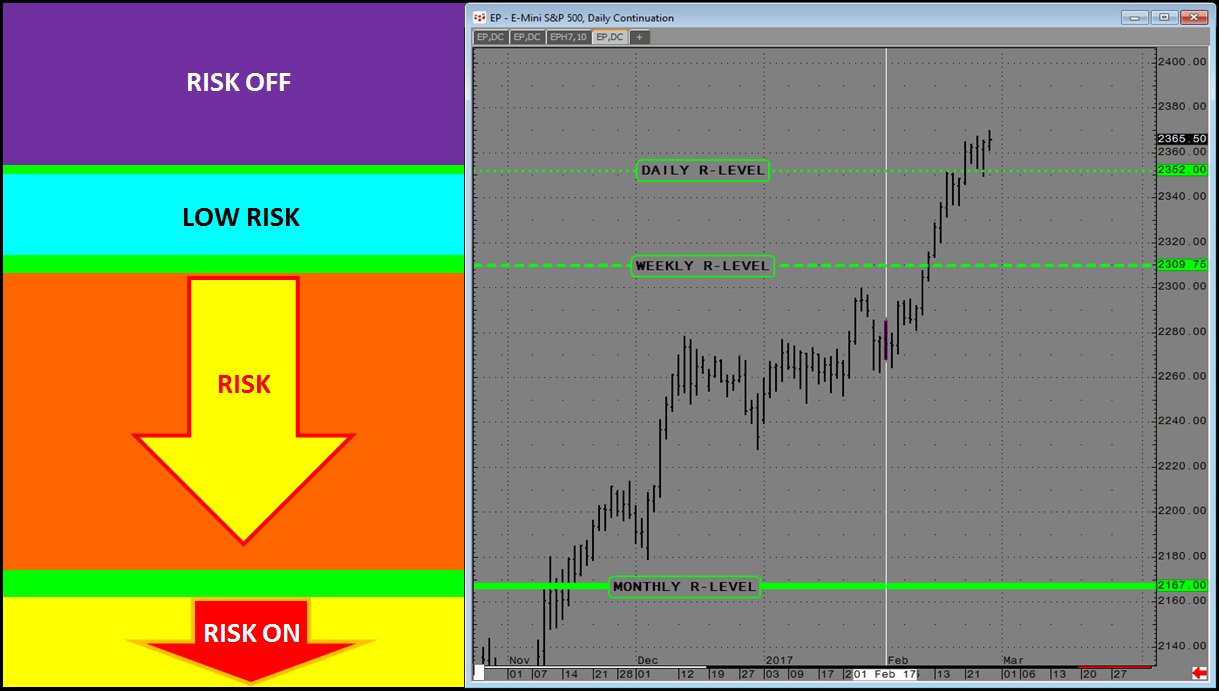
The image below shows the Monthly, Weekly and Daily R LEVEL sentiment bias for the SP500 E-Mini. In general: Trading above the R LEVEL is positive and below negative. Observing the differential between the current price and the R LEVEL provides insight to its influence as either a repellent when near or attraction when far away. The influence is also determined by the time frame of the structure. The available time frames are Monthly, Weekly and Daily which outline the RISK STRUCTURE of the market.
UNDERLYING RISK STUCTURE
 Daily, Weekly, Monthly R-LEVEL Risk Structure
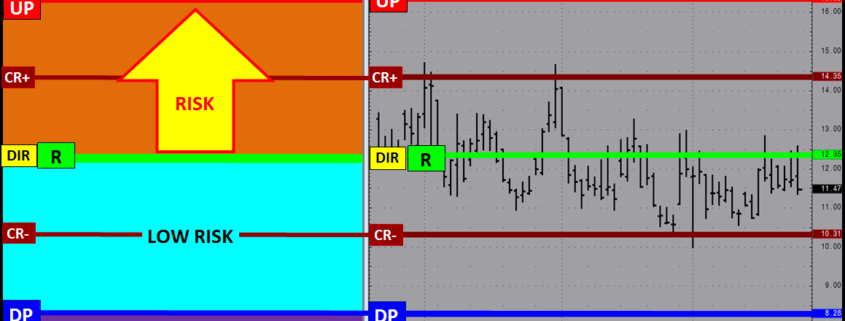
In the example above the ES futures market price is above the Monthly, Weekly and Daily R-LEVEL, identifying RISK OFF structure. Confluence of this fact with the RISK STATE of the underlying VIX provide clarity to the real vulnerabilities of the market. The example below shows that the VIX is below its Monthly R LEVEL. The Monthly time frame being the highest value in terms of market influence. As long as the VIX is below the 12.35 DIR (DIRECTIONAL) R LEVEL, volatility is in a RISK OFF position. Combining this with the fact that the ES futures are trading above all 3 sentiment bias time frames puts the current rally in a strong position with supporting volatility expectations.
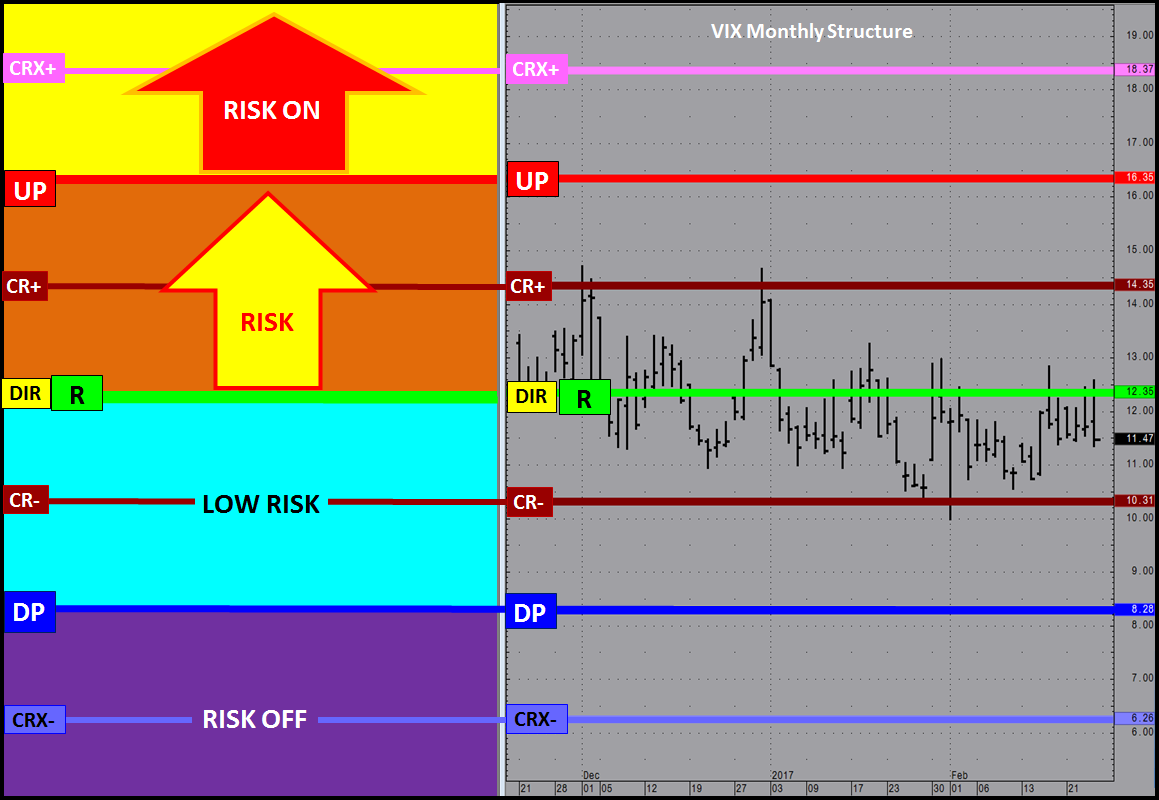
The CBOE (Chicago Board of Options Exchange) and the CFE (Chicago Futures Exchange) has expanded coverage of volatility indices or VIX into grains, currencies, crude oil and interest rates along with sector ETFs and individual stocks. Knowing the fact associated with a markets RISK STATE and STRUCTURE improves awareness and offers an indicator of confluence to standardize trading tactics into a more structured approach.
For more information Click HERE.