FEAR in trading is primarily related to financial ruin. If you are undercapitalized you fear that you will blow your account out. This emotion is overwhelming and becomes self-fulfilling following potential good decisions with bad choices.
Anxiety over losses is common but should not be. Losses are part of trading. They are inevitable and can be used to improve trading and trade management. It is important to understand the difference between taking a loss and being wrong. It is easy to feel that once you have gotten stopped out of a trade that your bias was wrong and sentiment has shifted. Most of the time it is just bad stop placement which may be based on what you can or are forced to afford. This does not mean you outlook is wrong just that your stop placement is. Poor stop placement may be the result of insufficient facts but in many instances it has its roots in other emotional decisions that lead to fear factors.
FOMO
Fear Of Missing Out is not real fear and is more related to being anxious. Real fear is gut wrenching, nauseating, emotional trauma. Anxiousness does add to anxiety by increasing risk. This is typically the result of a poor entry price from an emotional decision that disregards risks considerations in favor of satisfying the feeling of FOMO. This behavior is a typical precursor to adding leverage into the mix when the market goes against your emotional FOMO entry and you add size to dollar cost average. All too often the market continues to go against your position allowing fear to take over and cloud your subjective decision making process. Objective fact focus is replaced with “hope”. When the MKT Gods do not answer your prayers, fear overwhelms every fiber of your being. The consequence can actually produce physically effects like tightening of the throat and stomach cumulating in an emotional “I’m going to be ill, just make it stop get me out, I’m done!” response. The calculator comes out and identifies the account saving stop loss amount to cover, the order is entered, you accept your fate and then it’s over, you’re out of the market. Crushing frustration takes over, even anger that “the Algos are out to get me”, “these markets are impossible”. The price action against your bias continues for a moment as the market looks to do the same to other weak hands but with deeper pockets, which provides a sense of relief that you did not lose even more. Emotions start to settle about the same time the market momentum stabilizes and you realize that where you exited was actually near where you wanted to enter in the 1st place. At that moment the market spikes back to your original FOMO entry area. You reach for you mouse to enter again, albeit with token size, and the cycle continues. Either your stopped out again or if the market does go in your favor the gains from the small position only serve to reduce the amount of loss from being stopped out with leveraged. Your bias was correct but your account balance is diminished. The only gain is the frustration and doubt in your trading method which sets the foundation for a repeat of the same events.
NO FEAR — A Structured Approach to Risk Management
Breaking the grip of fear and anxious anxiety can be accomplished by creating a structured approach to trading;
Prerequisites
• Being properly capitalized is a prerequisite for creating a more objective standardized method.
• Understanding who you are, your core strengths, risk tolerances and how you will react in stressful situations is another requirement as a basis to developing a sustainable plan. For information on taking a Personality Profile assessment for self-identification discovery, please send inquiries to info@jsservices.com.
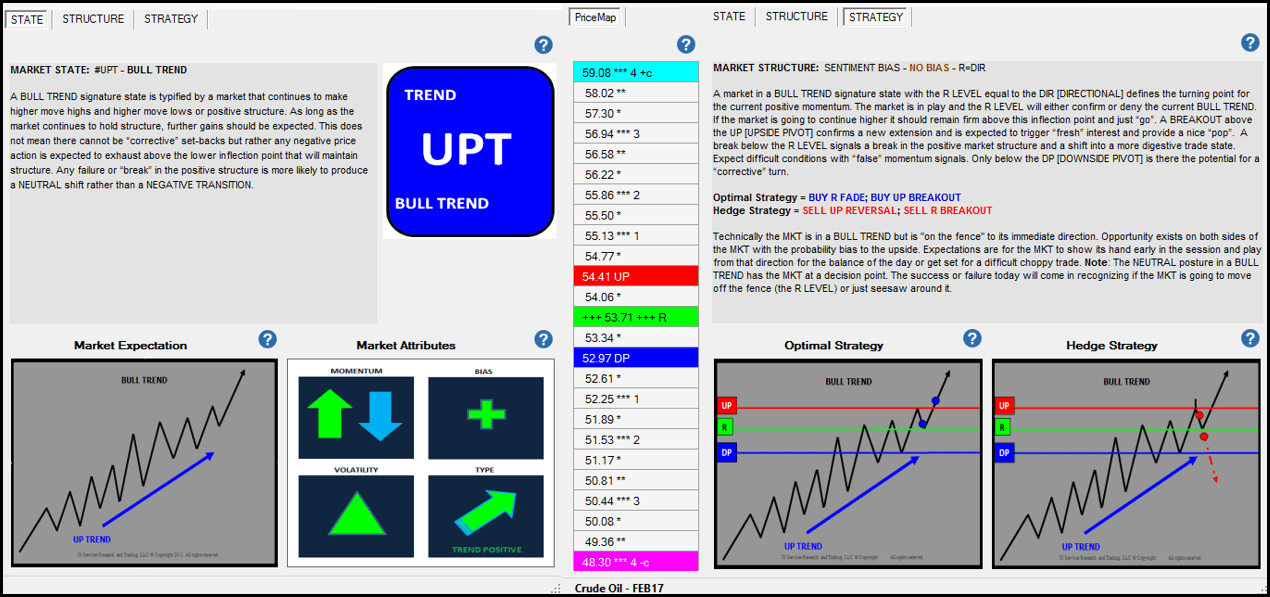
If you are properly capitalized and have a firm understanding of how your personality traits effect your trading, you can create a trade plan and risk management program that supports your unique path to success. The goal is to remove the emotional ups and downs of reactionary trading with a method that compliments a unique personality and is aligned with the structure of the market state. Market structure provides an outline to standardize the process by creating an execution framework to define risk and create a systematic approach.
Market Structure
Knowing the structure of the market State improves awareness by providing context to the current condition and its influence on a position or trade signal. This clarity instills confidence to overcome fear. With structure you have a benchmark to gauge what conditions provide opportunity and those that do not. Risk methods can be optimized with market structure to identify the value and risks associated with an opportunity.
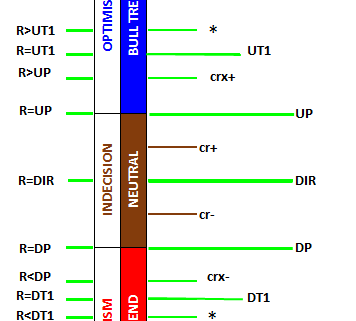
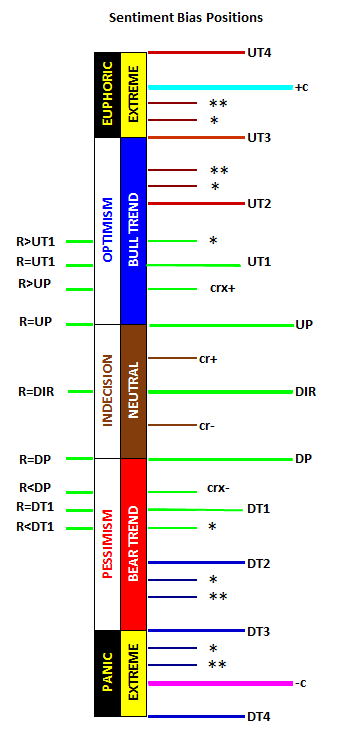
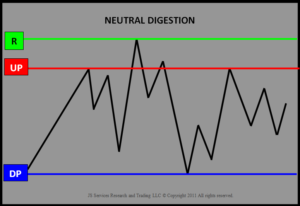
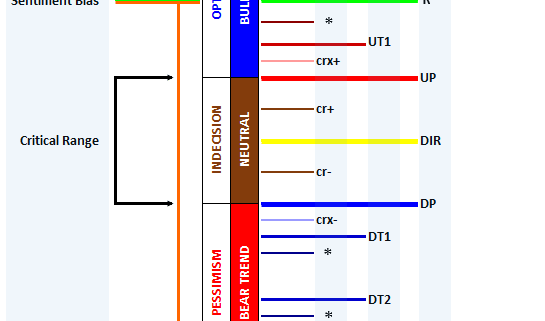
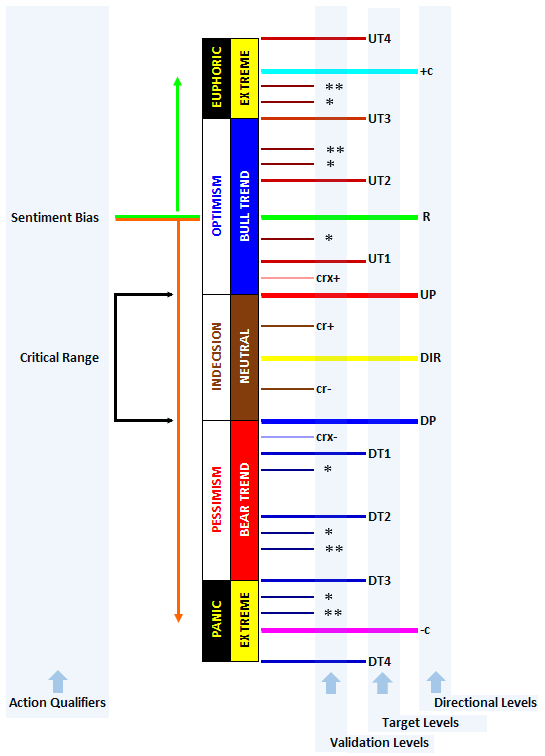
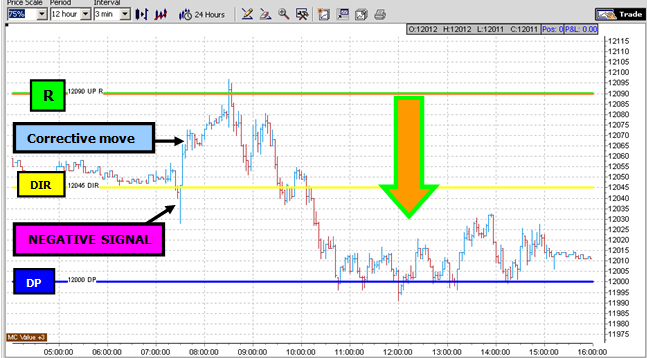
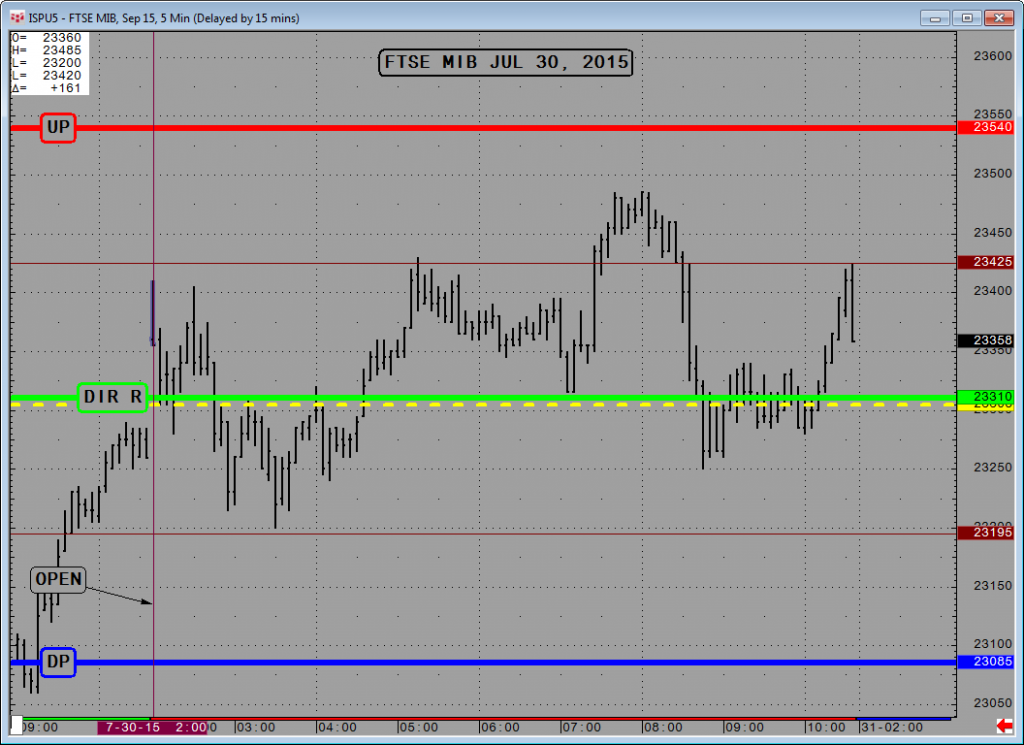
JSServices PriceMap analytics define the STRUCTURE of the market with 3 price points; a price band or CriticalRange and a Sentiment bias level (R LEVEL) which can be used to identify the risk profile of a market.
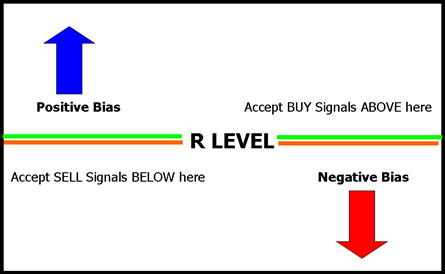
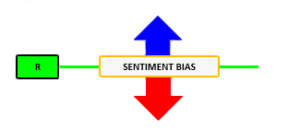
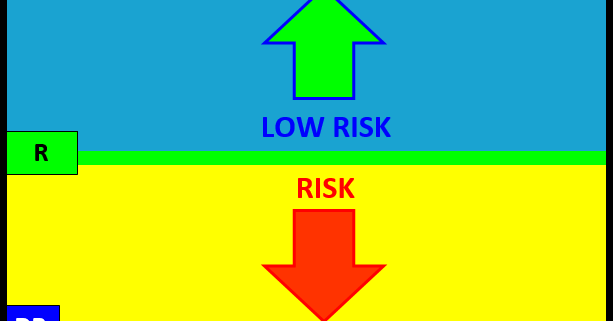
R-LEVEL
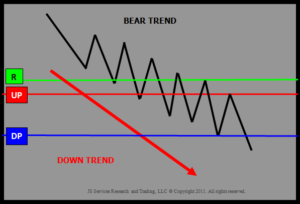
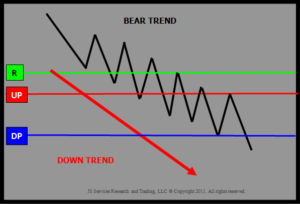
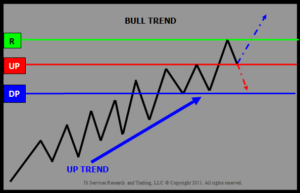
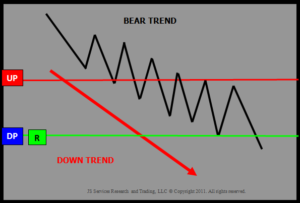
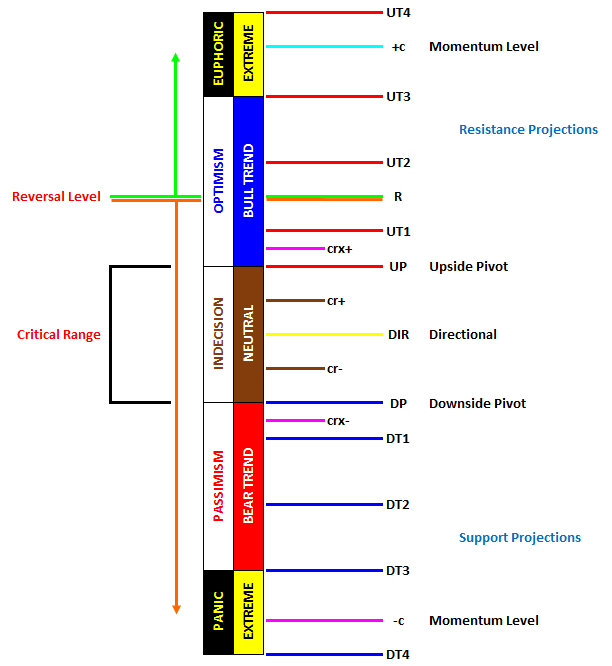
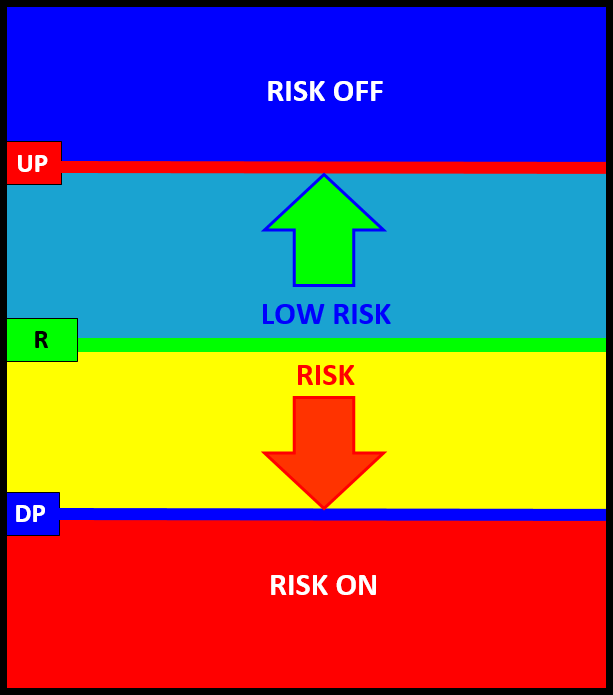
The R-LEVEL is the Structure point that defines “RISK” for the trade period as it represents the sentiment bias. Above this price point sentiment is positive and the market is in a LOW RISK posture having a bias for new gains. Below the R LEVEL sentiment is negative and the market is in a RISK position with a bias for new losses. Long trades entered closer to the R LEVEL will have a higher value than that of trades entered farther away because the risk of loss is at its lowest point with the greatest potential of reward from this price level. RISK OFF is a term used to define the risk environment and does not mean that trades established in this zone are “riskless”. In contrary they are at risk down to the R LEVEL, which is why trades entered near sentiment have the most value as they have the least amount of risk.
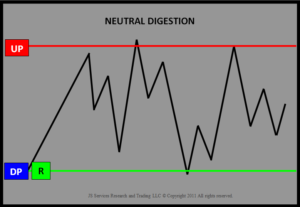
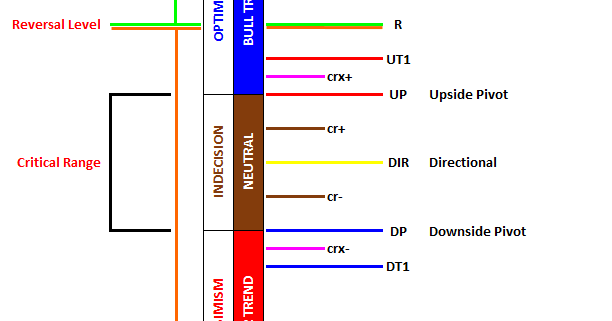
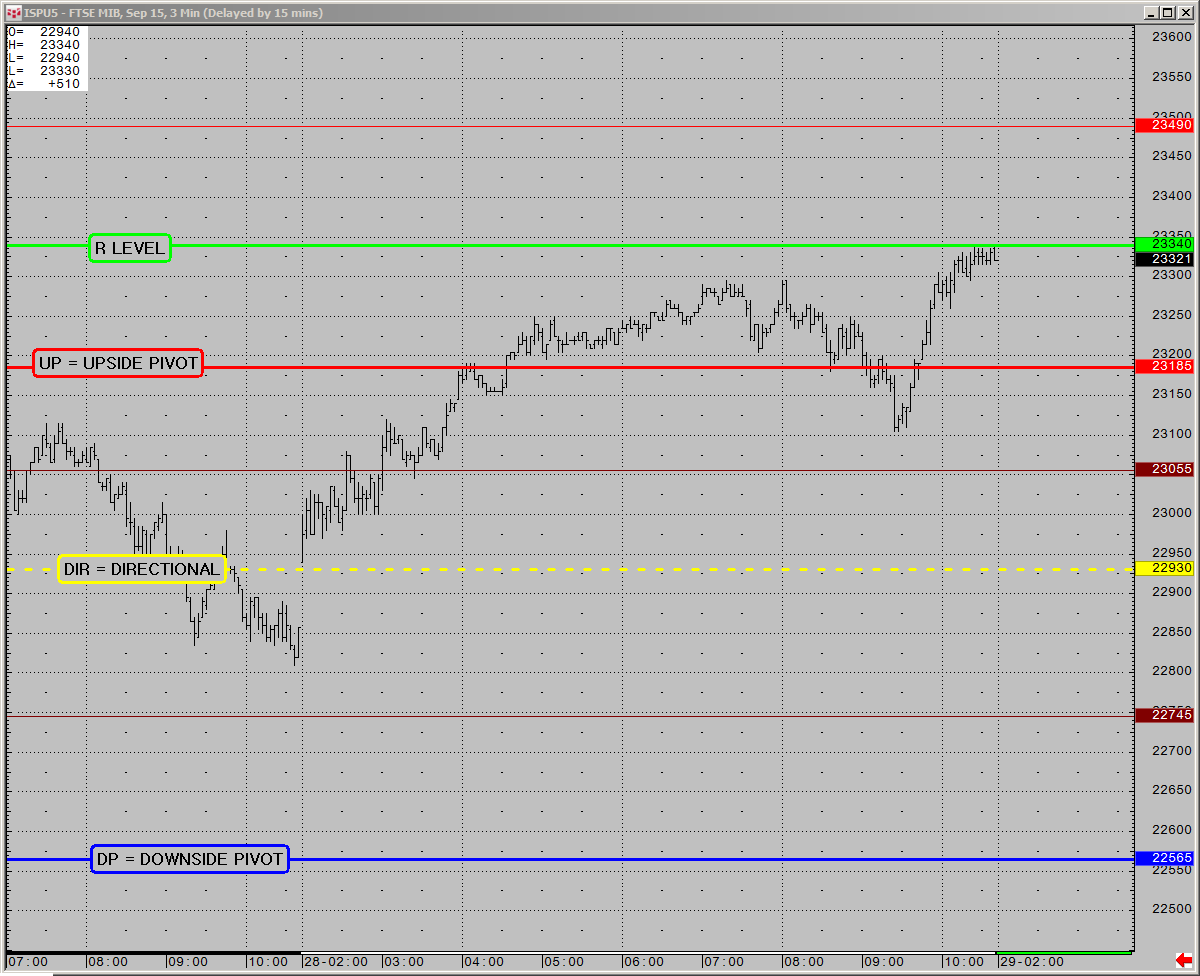
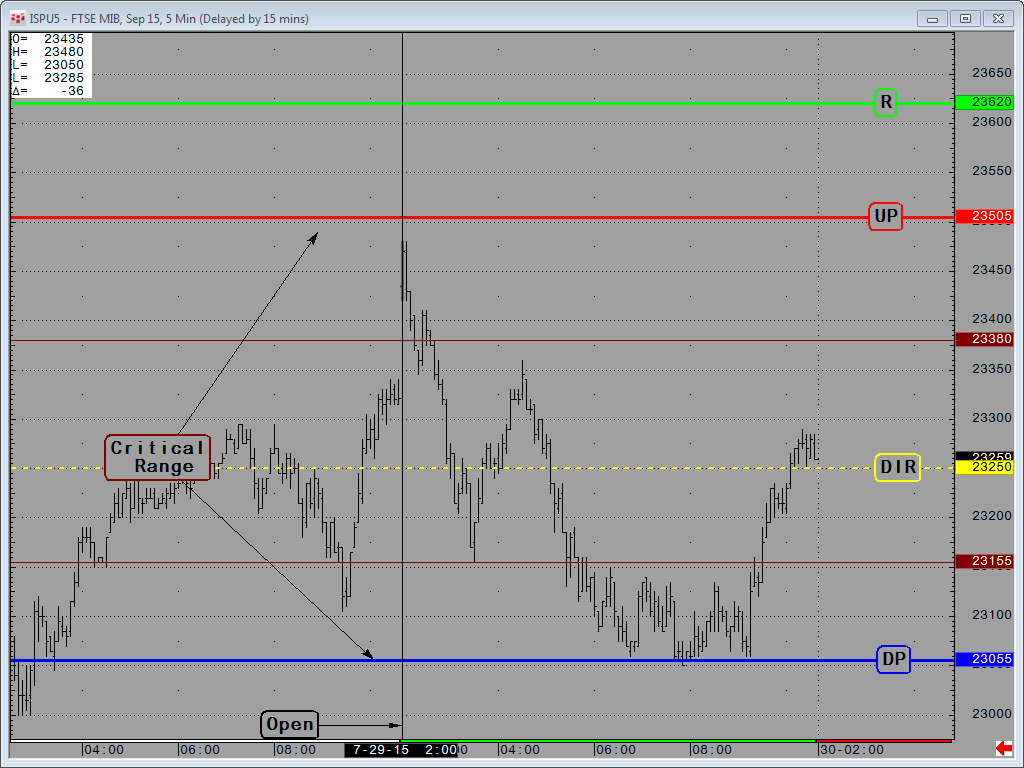
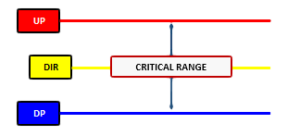
CriticalRange
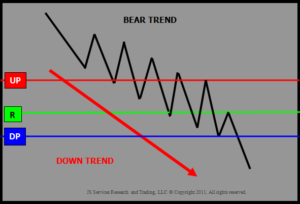
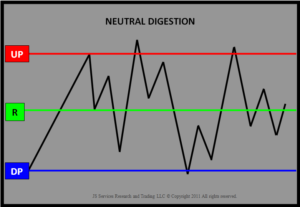
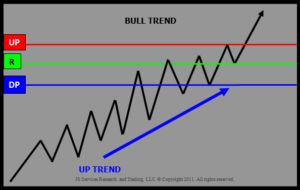
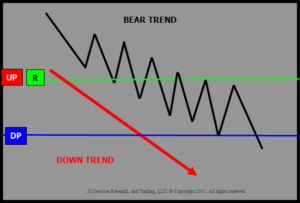
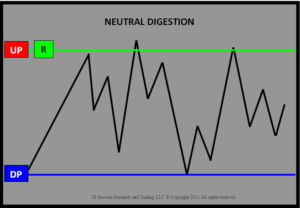
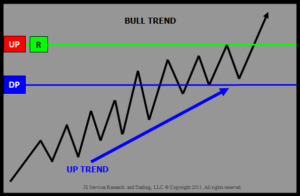
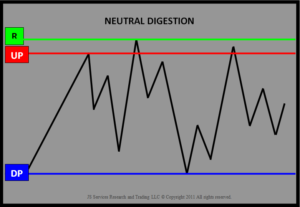
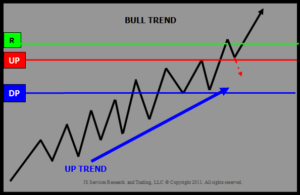
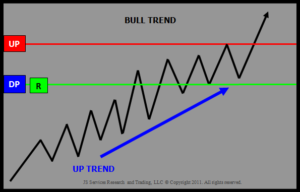
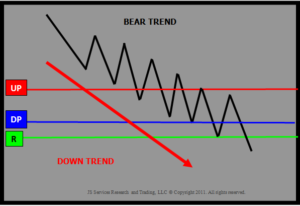
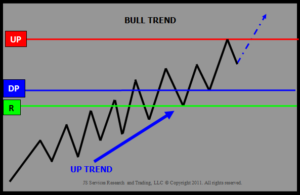
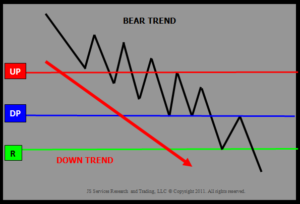
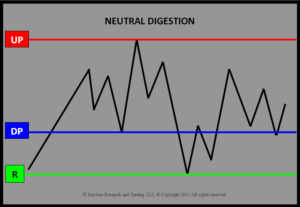
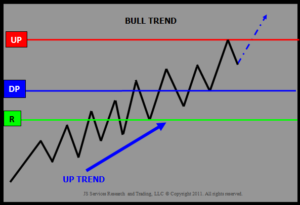
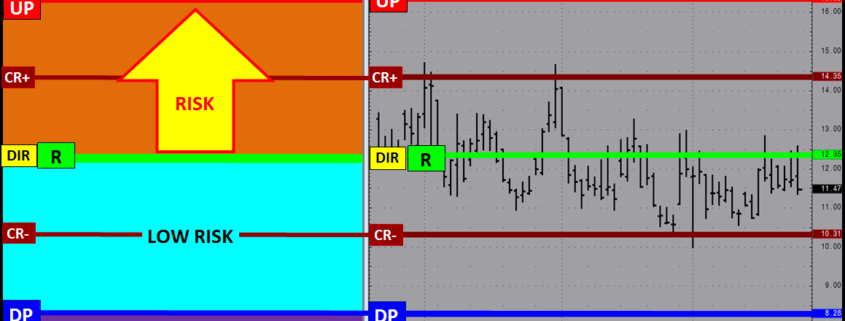
The CriticalRange (UP-DP) sets the confirmation boundary of the RISK condition. In general above the UP (Upside Pivot) confirms the positive sentiment and RISK OFF condition with a higher price expectation and below the DP (Downside Pivot) confirms the negative sentiment RISK OFF position and lower price expectation.
Risk Structure
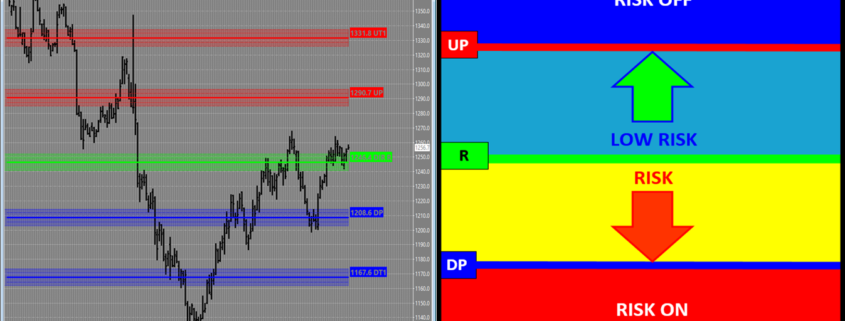
Market Structure can be used to identify the risk structure for a fundamental market position. Risk Structure outlines the context of the current risk environment based on the markets current position within the market structure framework.
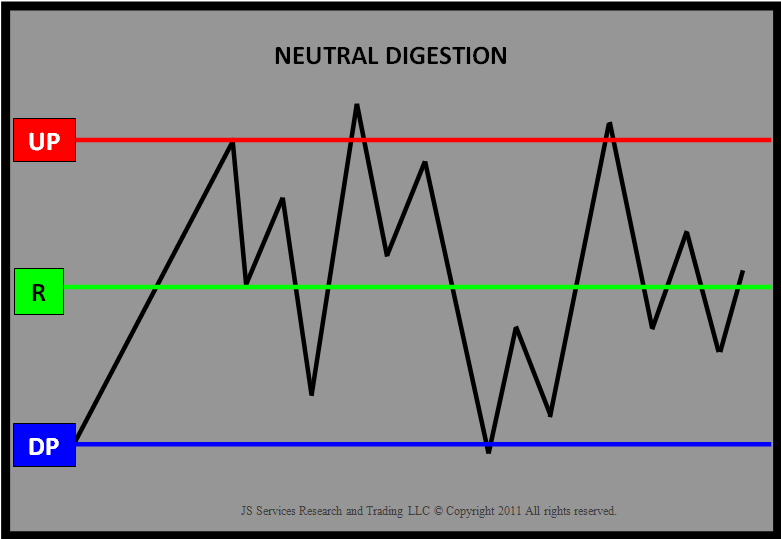
The Risk Structure profile below assumes a NET LONG POSITION with a RISK ON posture signaling a negative price expectation and a RISK OFF posture a positive price expectation. This is an example when the sentiment bias R LEVEL is equal to the CriticalRange mid-point.
Balanced Risk Structure R=DIR
Example – GOLD APRIL 2017
R-LEVEL = 1246.4 | UP (Upside Pivot) = 1290.7 | DP (Downside Pivot) = 1208.6
In the example below GOLD is basically “at Risk” which is defined by the 1246.4 R-LEVEL. If the market is going to transition higher it will maintain a trade above this price point and stay in a “LOW RISK” posture in terms of a long position, up to the 1290.7 UP (Upside Pivot). At this point the market will be at a point of equilibrium in terms of committing to a new “up trend” and a RISK OFF posture or maintaining a position of LOW RISK.
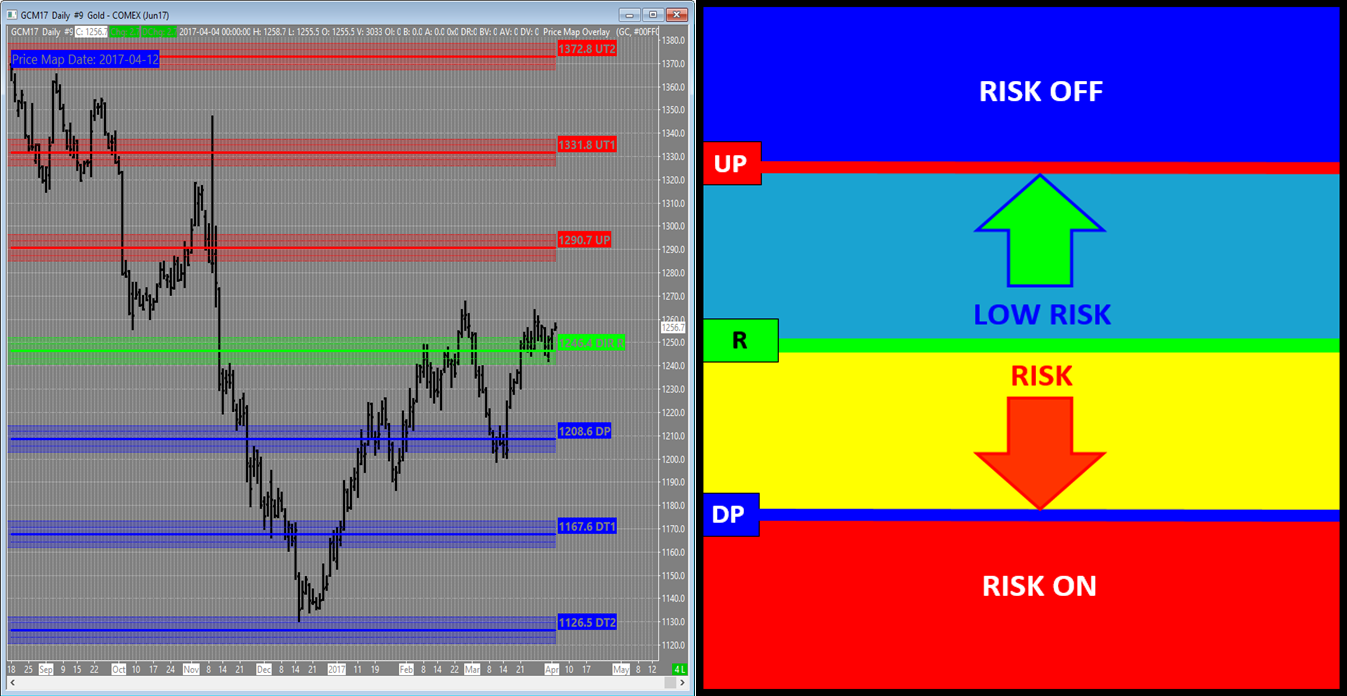
Daily GOLD May17 Chart with Monthly PriceMap
Hedge Strategy Example (Net Long Position)
If GOLD is trading at the 1290.7 UP, a net long position has a profit give-back risk of around $35. This as this is the amount of profit that will be lost with a trade back down to the 1246.4 R-LEVEL which is a “normal” reaction that can be anticipated for this structure bias if the positive trend is not ready to commit. A Hedge Strategy can be implemented to reduce this risk, specifically a SELL UP FADE Hedge Strategy. IF the market price action is going to be contained within market structure THEN it will reject “in front” of the 1290.7 UP. A SELL UP FADE execution tactic can be used to protect unrealized profits with an objective of taking off the hedge at the 1246.4 R-LEVEL.
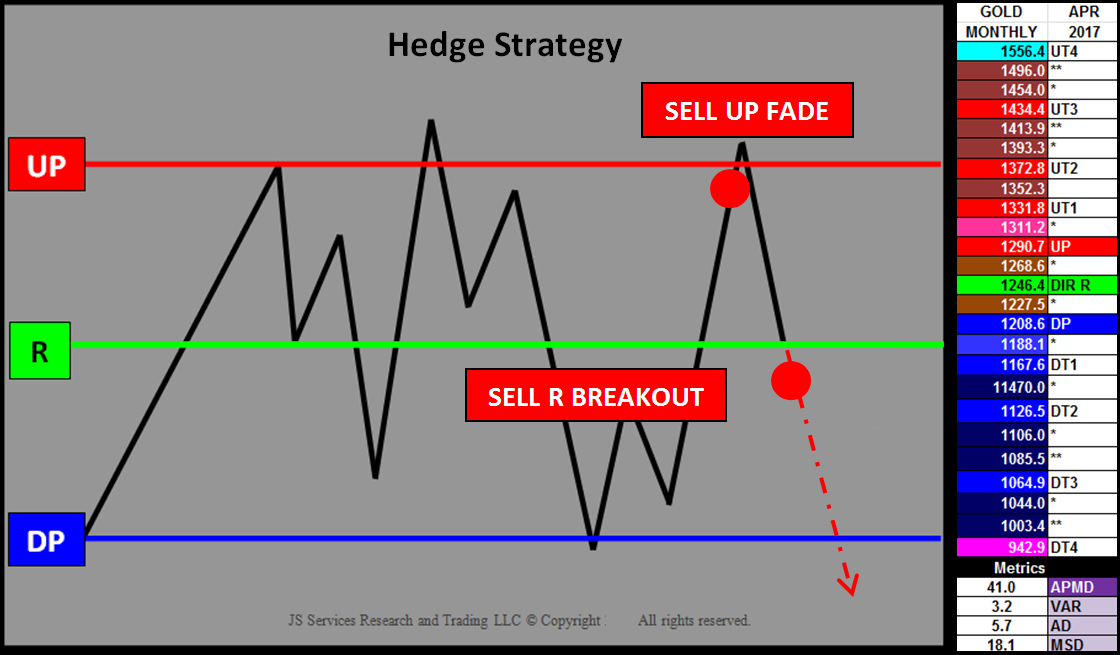 Hedge Strategy and GOLD Monthly April 2017 PriceMap
In addition to the protecting profits the Risk Structure also identifies where a hedge should be applied to protect losses. In the Hedge Strategy image above a SELL R BREAKOUT tactic can be implemented below the 1246.4. The 5.7 AD (Alert Distance) Metric can be used to confirm a “Breakout” signal (1246.4-5.7=1240.7) or a break under 1240.7, with the expectation that the market will shift into a RISK position down to the 1208.6 DP (Downside Pivot). Here again the market will be in a state of equilibrium, where it will either stabilize for a rally back up to the R-LEVEL sentiment bias or break structure and transition into a RISK ON Hedge position and potentially new Bear Trend targeting the 1126.5 DT2 (Downside Target#2).
Summary
Observing price action within Risk Structure provides clarity to the current condition and the value of an opportunity so proper risk management can be applied. Knowing where you are at risk is imperative to maintain a “fearless” focus by having the awareness of what RISK theme is currently dominating price action.
Standardizing your trade entry to the price levels that define the risk structure is an easy way to improve risk management of a trade as well as reducing fear by knowing what the risk position of the market is. If your risk profile won’t allow you to take a trade then you have the answer to if a trade should be taken or not. Once there is alignment with structure and your risk profile then there is no thinking about taking a trade or not but just executing it with the proper size based on the value of the opportunity.
When you know the facts and your trading tactics are in alignment, FEAR is replaced with RESOLVE. As long as the FACTS that confirm that the position remains true then all the fear inducing volatility becomes what it is, noise. Having a plan and a structured method to execute it eliminates fear with an emotionless IF/THEN equation.
For more information please send inquiries to info@jsservices.com
Click here to demo our analytics and enhance your trading and risk management.

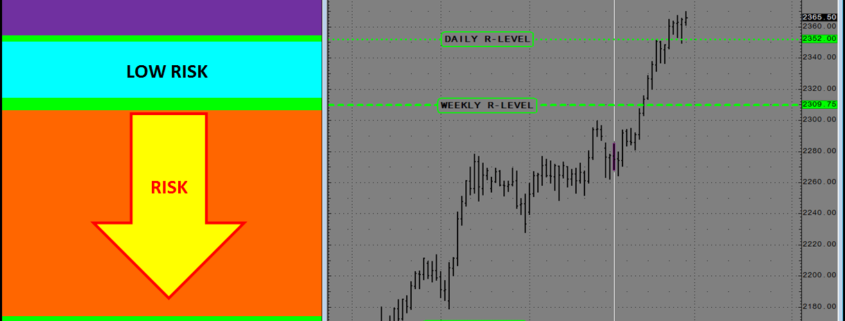
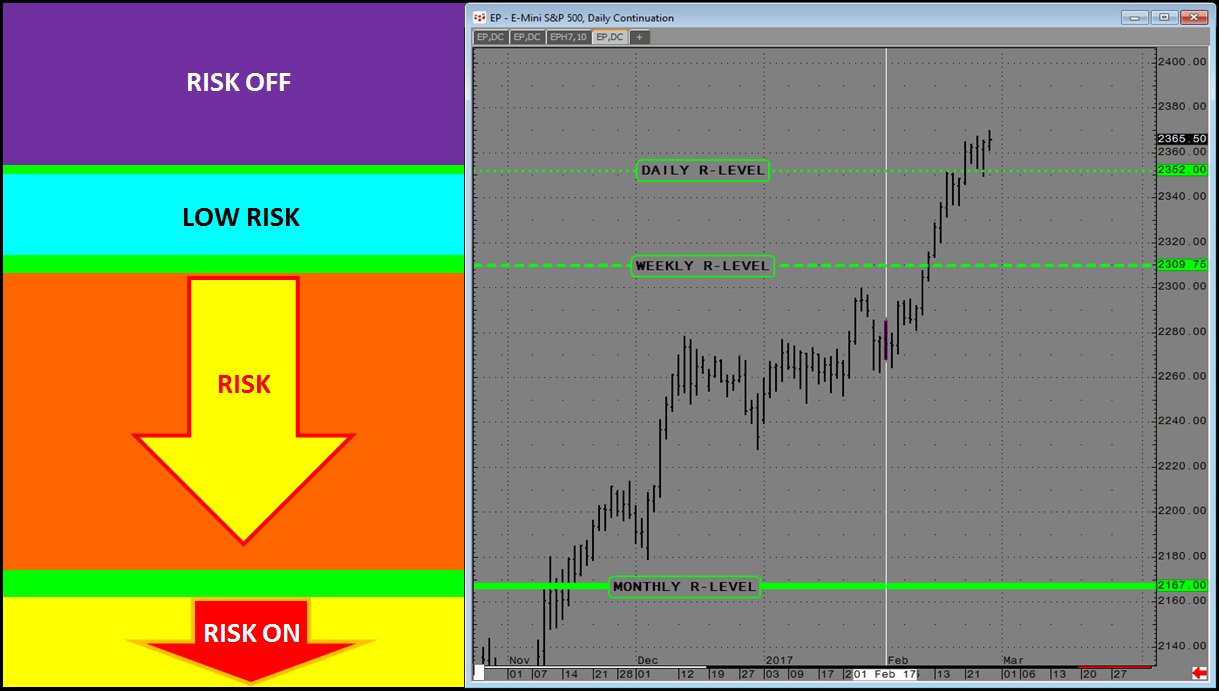 Daily, Weekly, Monthly R-LEVEL Risk Structure
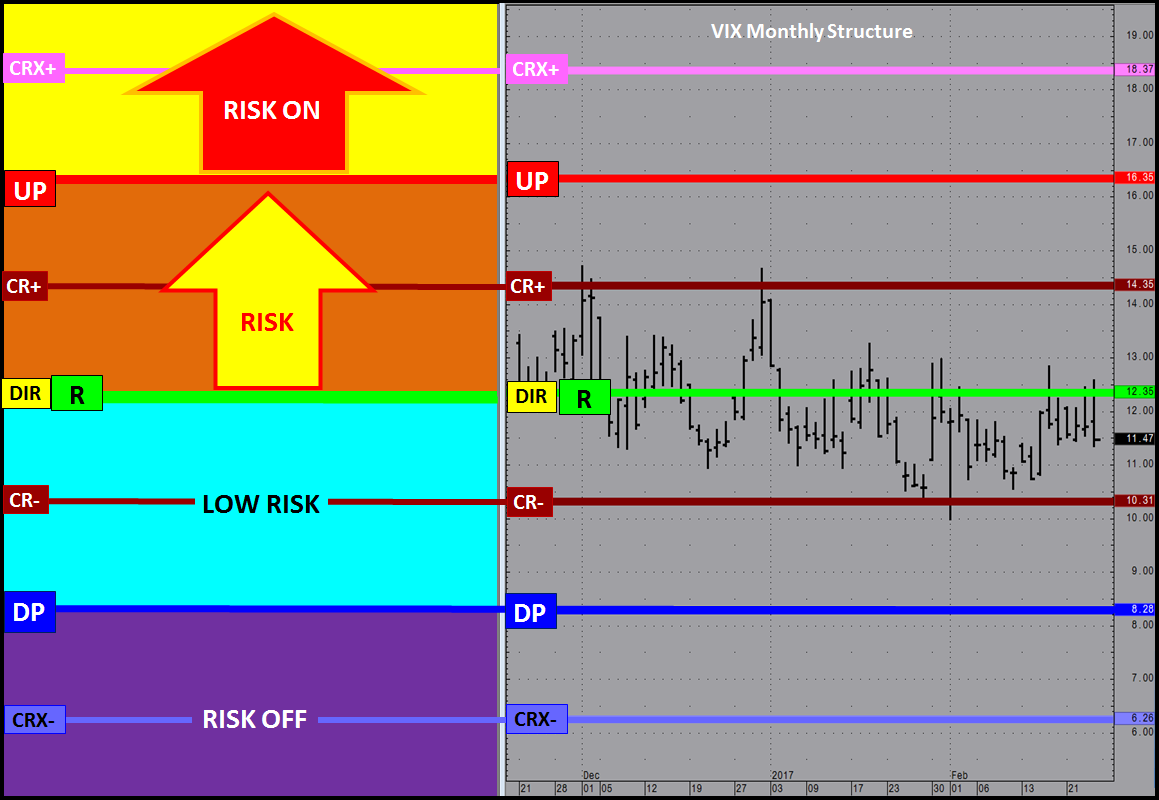

 Macro Structure Micro Structure
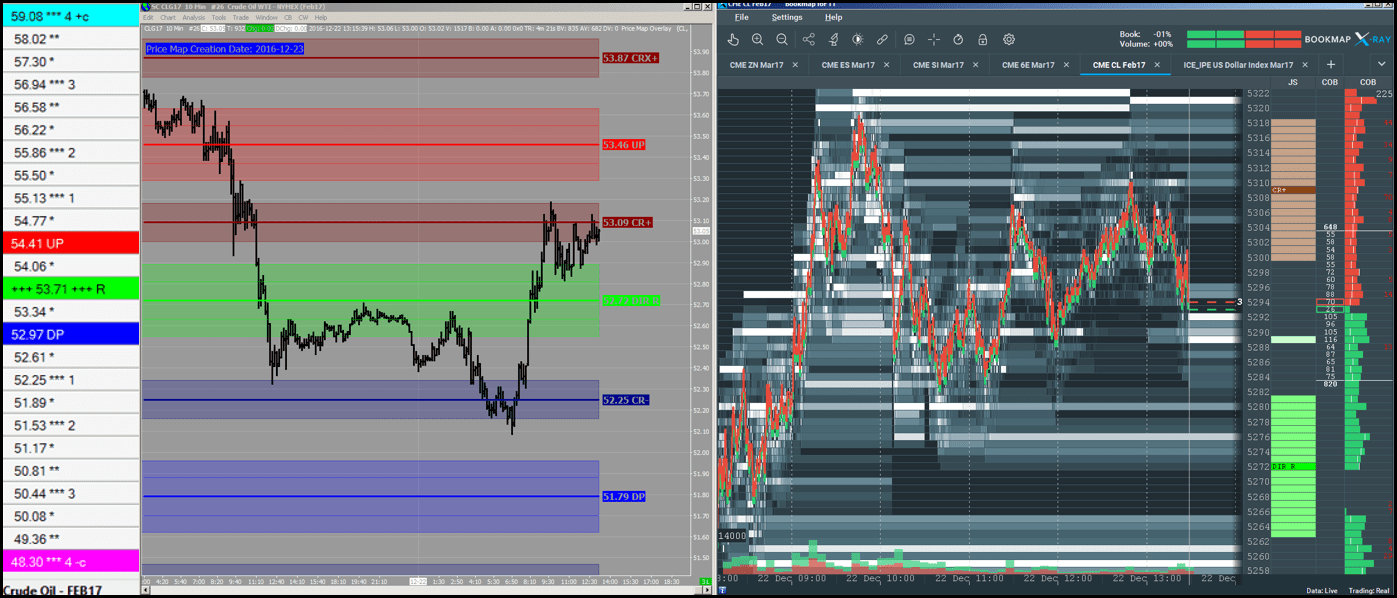
 JSDesktop
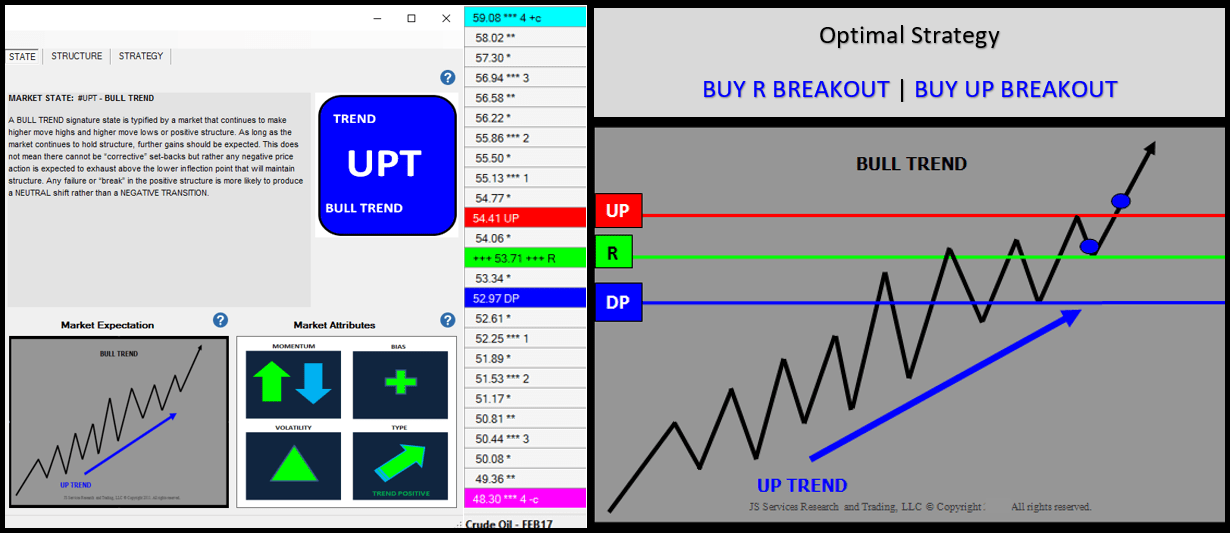 JSDesktop displays the JSAnalytics
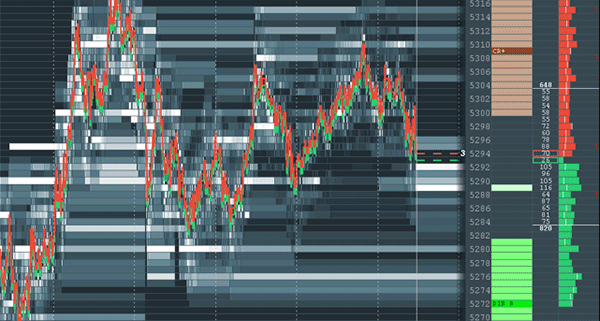
 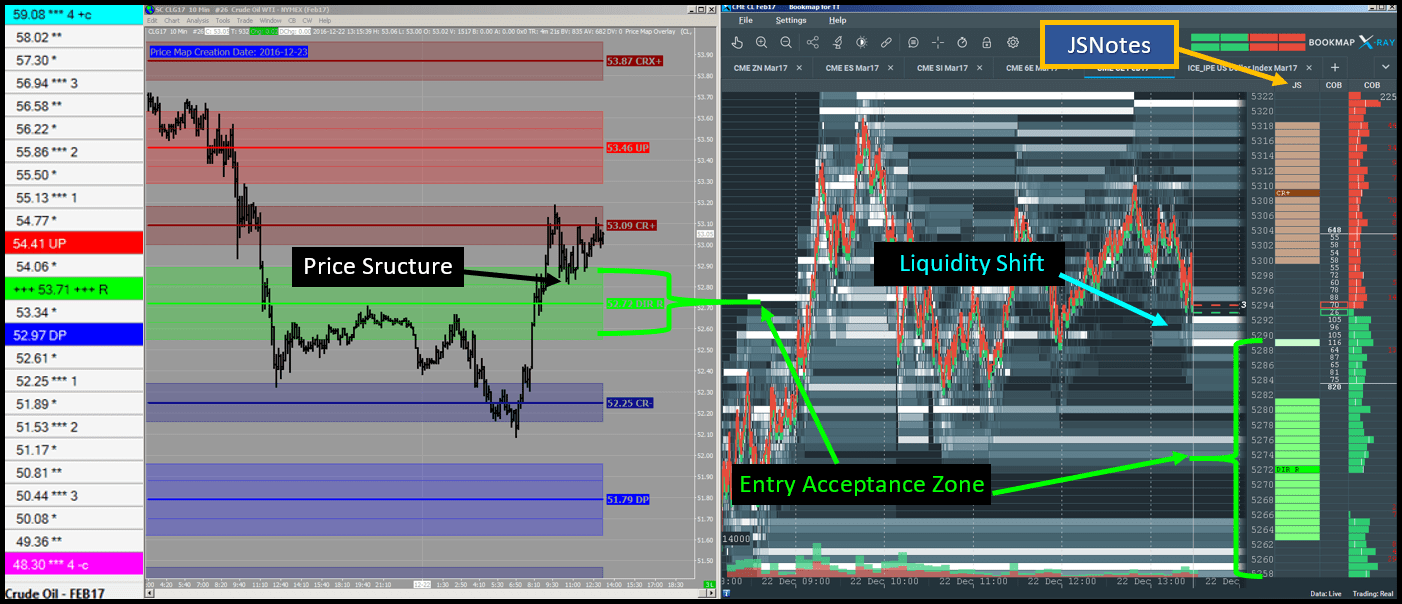 Example of a Liquidity Shift event occurring at the top of the PriceMap Entry Acceptance Zone
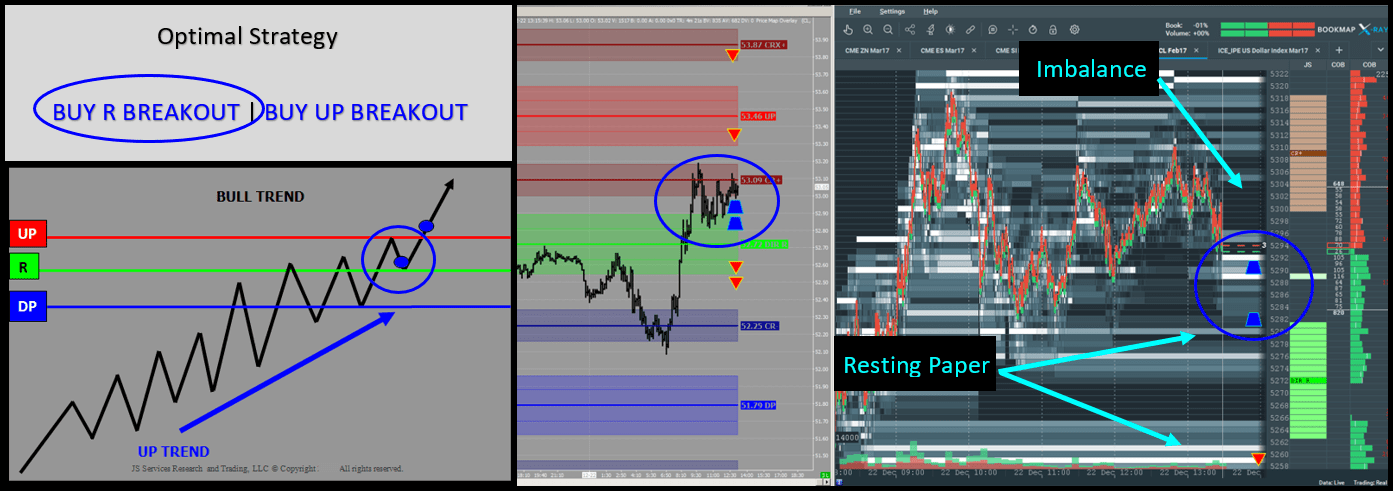 BUY R BREAKOUT Strategy Theme is “in play”