
![]()
NinjaTrader® is our #1 recommended trading software preferred by traders worldwide including our clients.
Download NinjaTrader & get immediate FREE access to:


Kinetick® delivers reliable, fast and cost-effective market data to help level the playing field for active traders. Take advantage of unfiltered, real-time quotes for stocks, futures and forex that exceed the expectations of the world’s most demanding traders, like us!
Get started with FREE end-of-day historical market data directly through the NinjaTrader platform and learn how you can significantly reduce CME Group Globex exchange fees on real-time market data with Kinetick.
Get Started with Free EOD Data
![]()
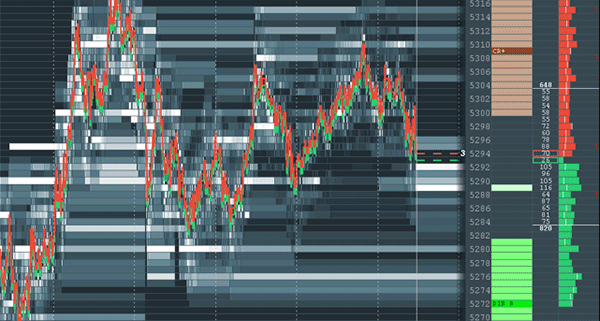
JSAnalytics provides context for dynamic order book events which improves awareness and offer a framework to apply a more systematic trading approach.
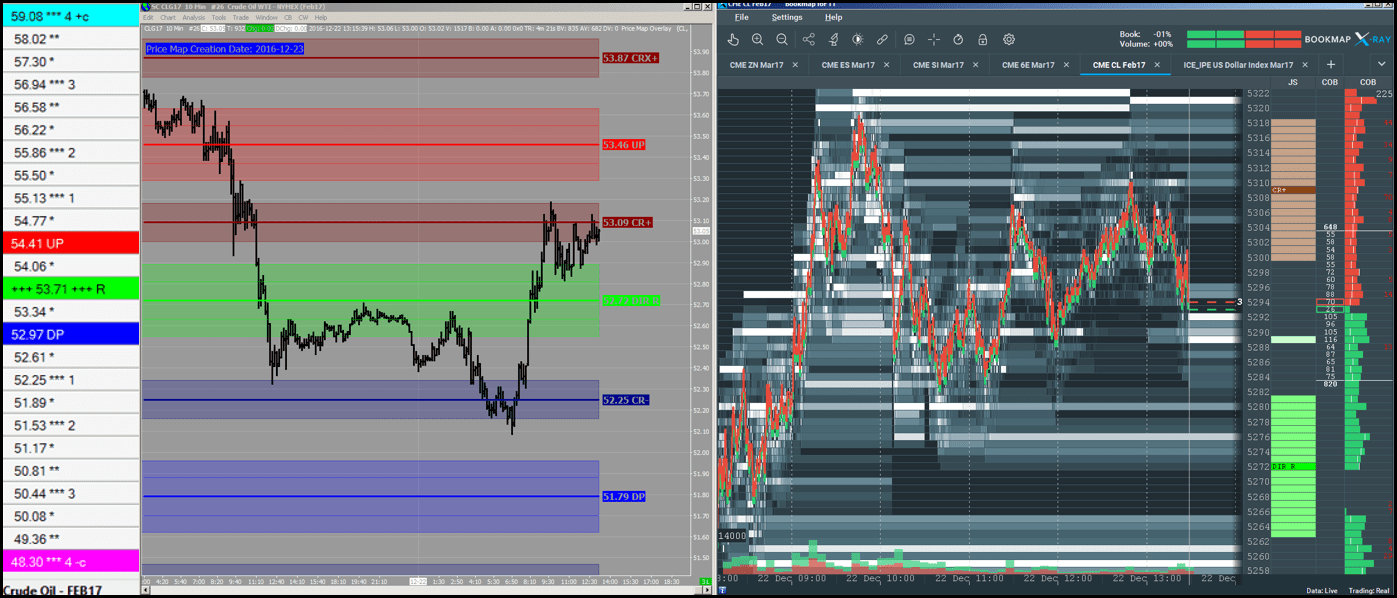
BookMap xRayMap xRay delivers a configurable heat map display that visualizes both real-time order flow and live trade analysis, showing you exactly how the limit order book evolves over time. This granularity is essential to improve awareness of the micro dynamics so trading tactics can be optimized and make the execution of a macro trade strategy more effective. It is also true that micro order book trading tactics can be made more sustainable when they are aligned with macro conditions or more specifically the structure of the market state.
JSAnalytics incorporate both technical and behavioral variables, that have been developed from observations over the past 30 years, into a quantitative model, to define the structure of the market state. This structure or PriceMap Framework is integrated into the BookMap Order-Book Heat-Map display as an independent “JSNotes” column.
PriceMap Framework Heat Map – JSNotes Column
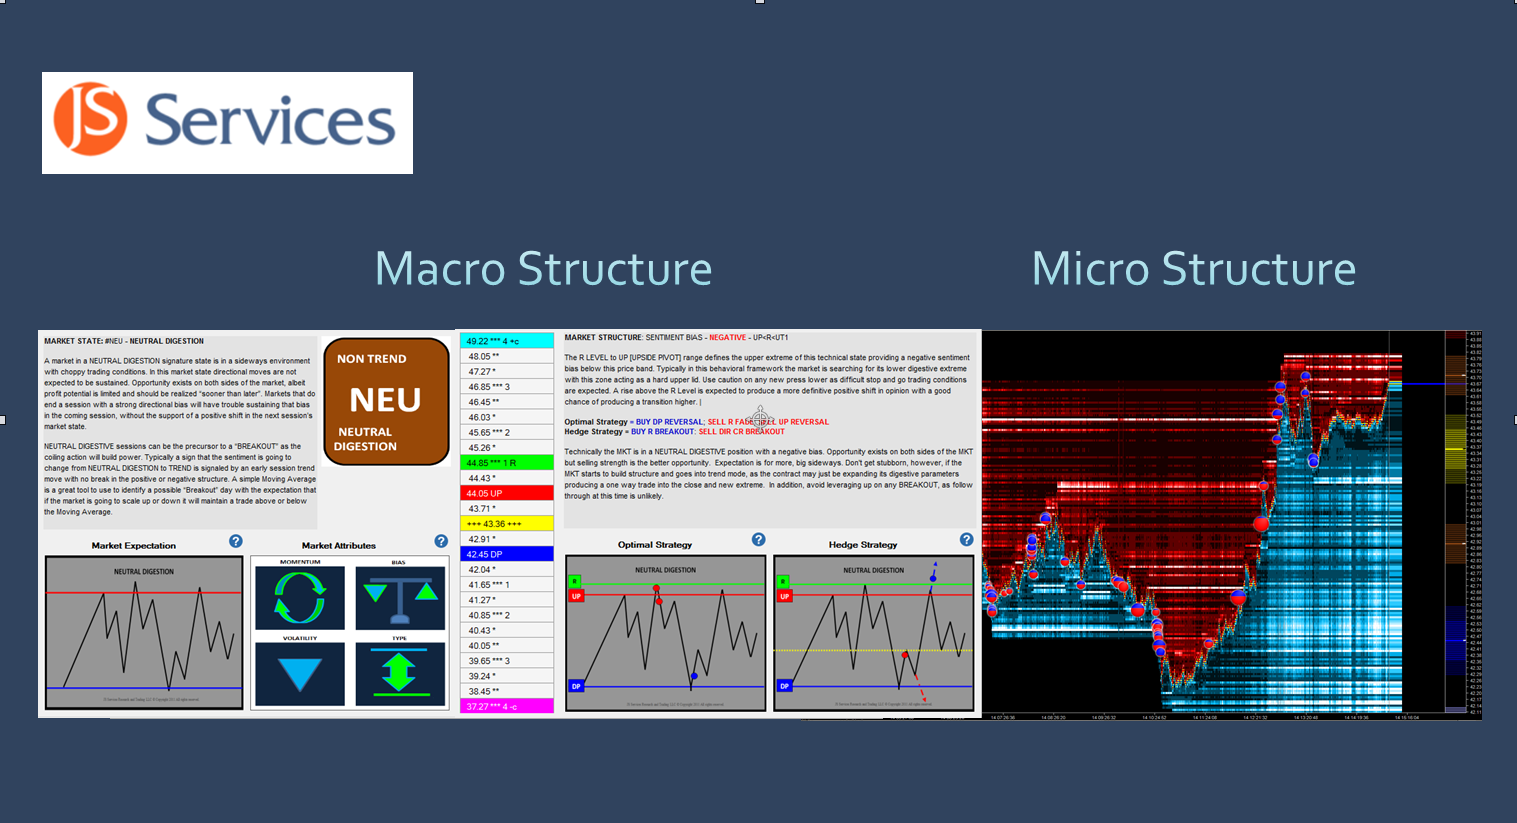
 Macro Structure Micro Structure

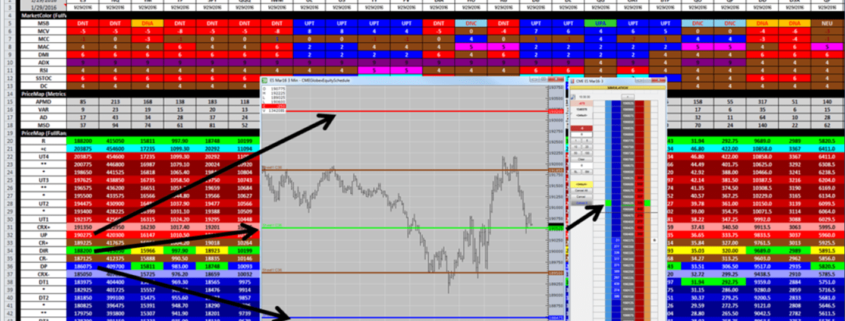
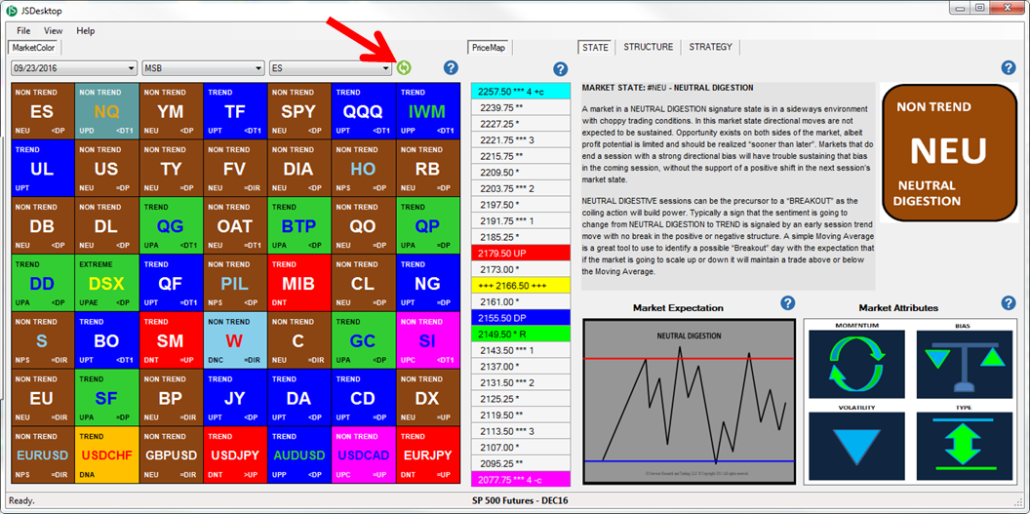
The integration is strengthened by JSServices Desktop application which identifies the current market state and optimal strategy theme, along with the PriceMap market structure framework, to provide a complete picture of the macro condition.
STATE STRUCTURE STRATEGY
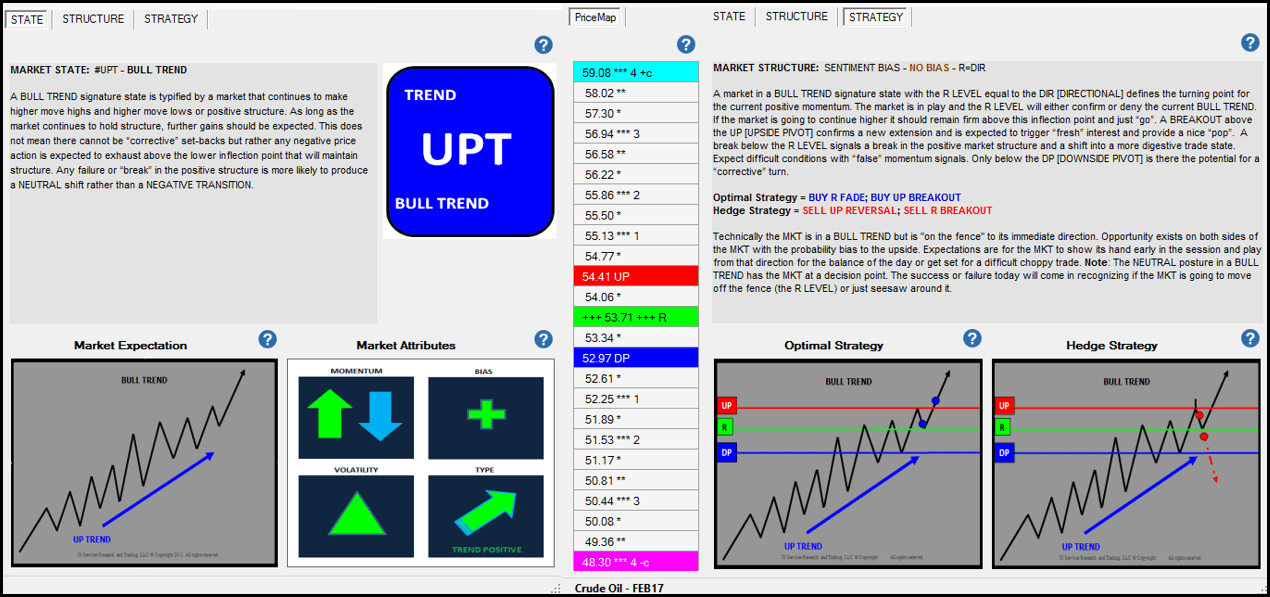 JSDesktop
Clarity of real time events is achieved by observing order flow dynamics within the PriceMap Framework in the context of the market State and PlayBook Strategy themes. JSAnalytics more than anything else, is an awareness tool that provides clarity to what the current conditions are, so trading methods can be optimized by aligning tactics with these facts.
The following is a practical application of standardizing JSAnalytics with trading tactics that incorporate dynamic order flow events to improve their effectiveness and make them more sustainable.
What is the CONTEXT of the current condition?
 JSDesktop displays the JSAnalytics
CONTEXT
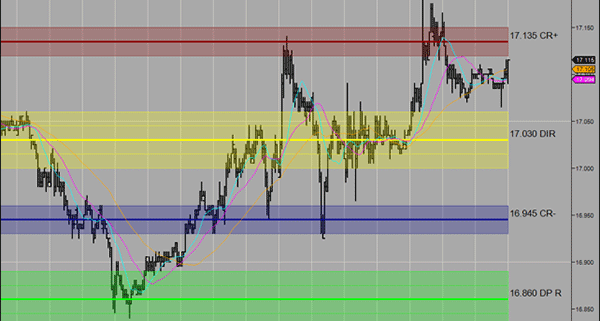
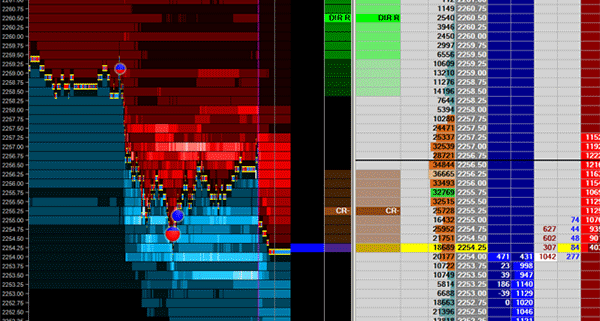
Where is an order book event occurring within the Structure of the State?
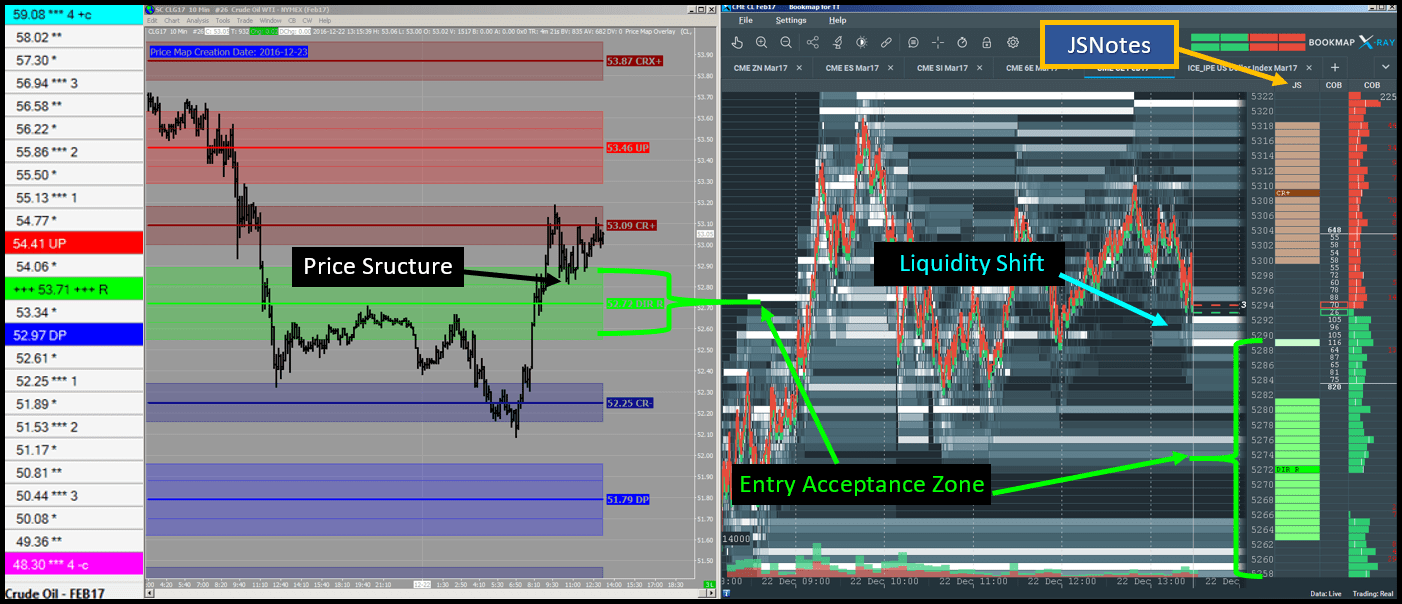 Example of a Liquidity Shift event occurring at the top of the PriceMap Entry Acceptance Zone
STRUCTURE
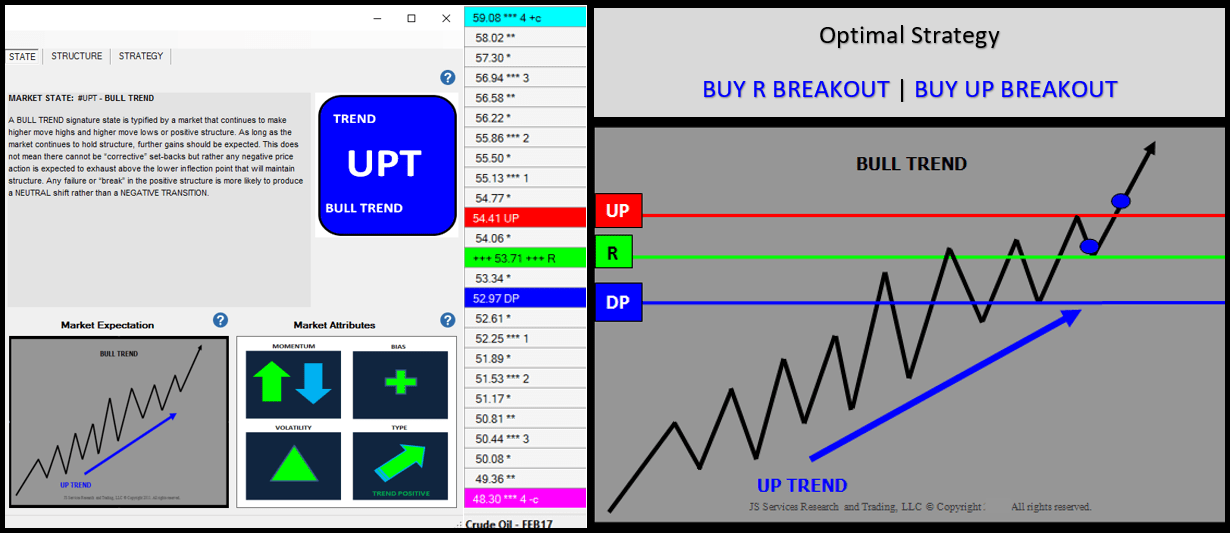
What PlayBook Strategy theme is the order book event in alignment with?
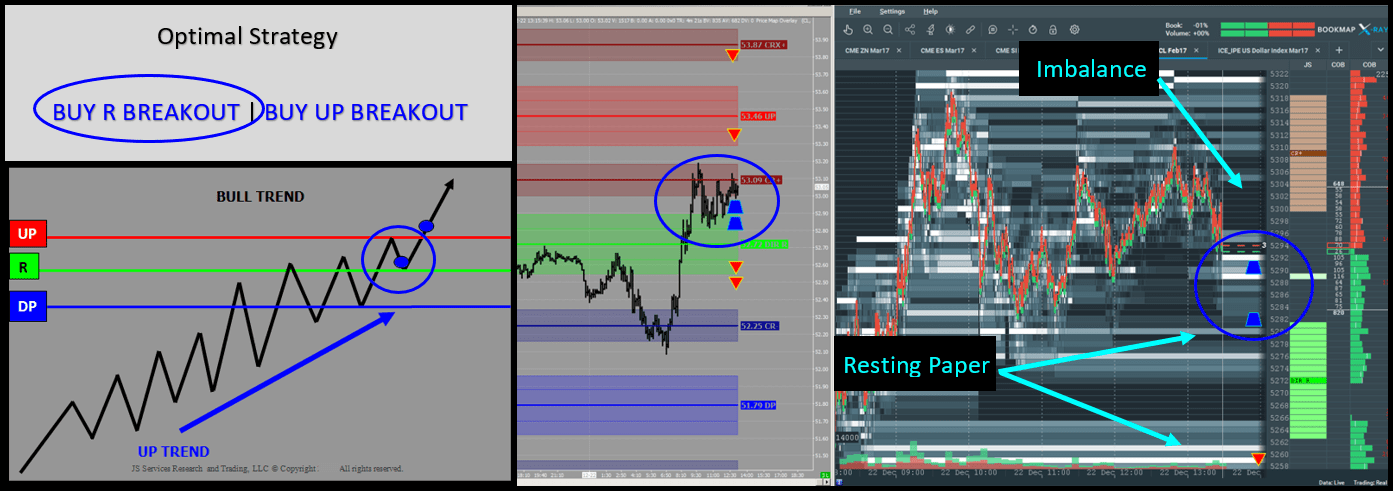 BUY R BREAKOUT Strategy Theme is “in play”
STANDARDIZE
Trade tactics can be optimized when executed within Entry Acceptance Zones and their effectiveness improved by using real time order book events that are in alignment PriceMap market metrics. By standardizing trading tactics with JSAnalytics trading methods become more structured and sustainable.
The JSNotes integration works in conjunction with the JSDesktop so you will need to download both applications.
For more information please contact us at info@jsservices.com
This webinar demonstrates how to optimizing Trade Tactics using JSServices analytics which define a markets macro structure and Jigsaw Trading micro structure order book display.
![]()
The JSServices PriceMap integration with Bookmap is contained within the Bookmap application itself as an “John Slazas Notes” or “JSNotes” Add-On.
The JSNotes integration works in conjunction with the JSDesktop so you will need to download both applications.
For more information please contact us at info@jsservices.com
Bookmap clients are able to subscribe to the John Slazas Notes through the Member area Add On section.
Once enabled the John Slazas Notes column can be inserted by right clicking on any column.
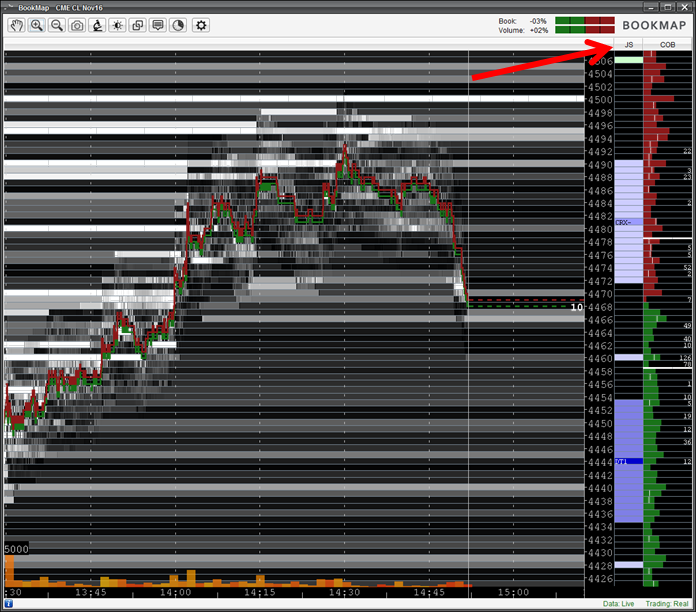
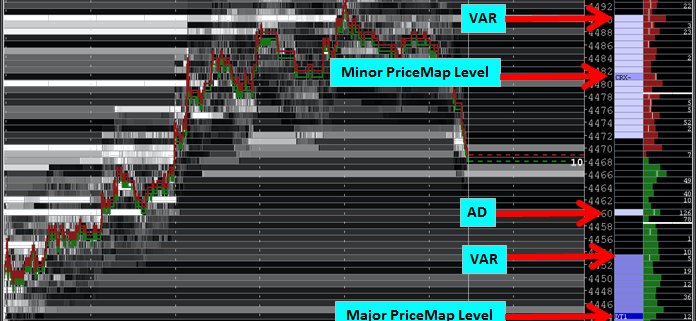
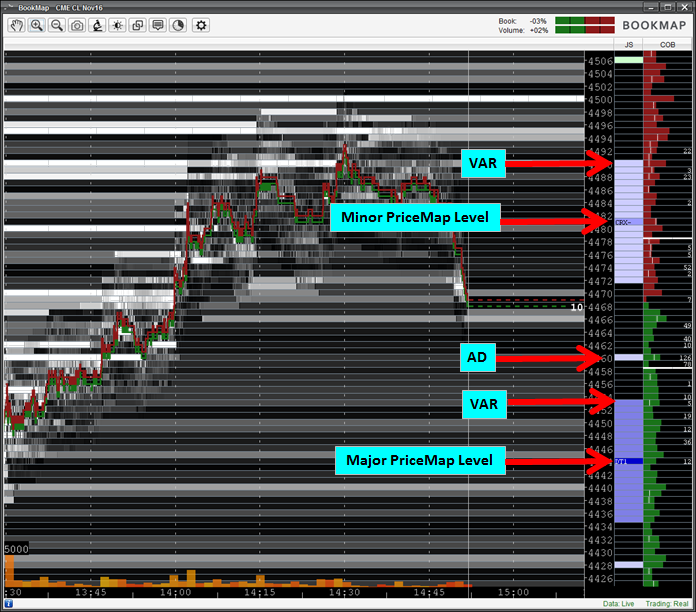
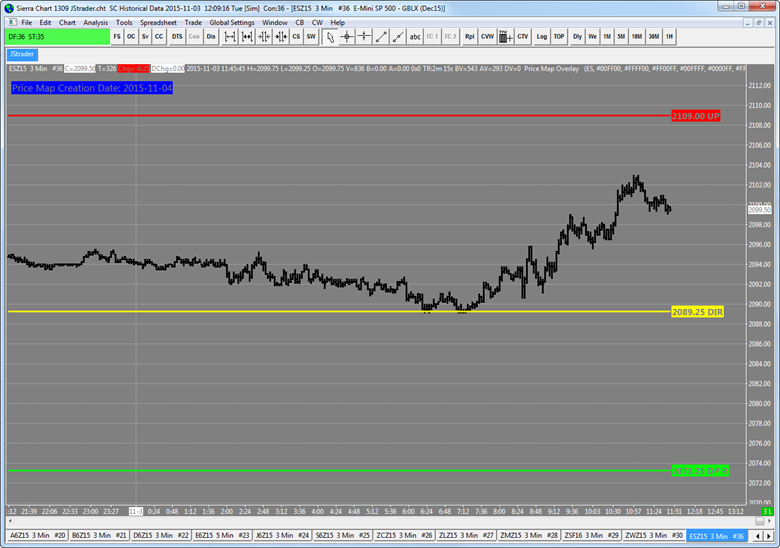
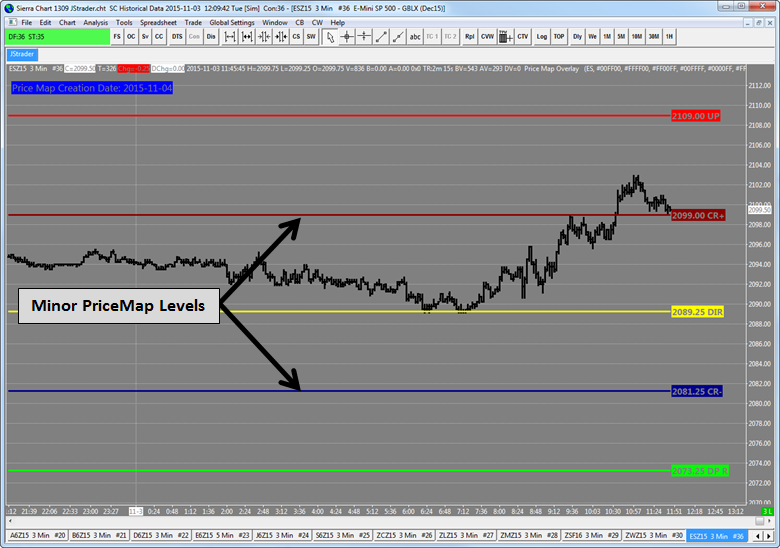
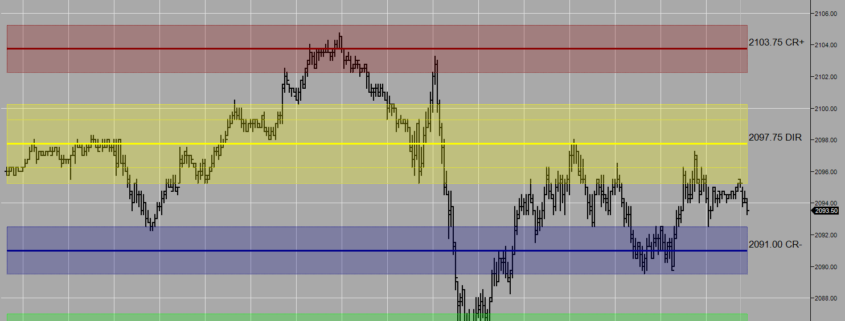
The full PriceMap Framework is presented in the JS Notes column along with the Market Metrics associated with each level.
Directional and Major PriceMap levels will have both a VAR and AD metric identified as shown below. Minor PriceMap levels will only have there VAR displayed.
Click here for more an Overview of the JSNotes.
![]()
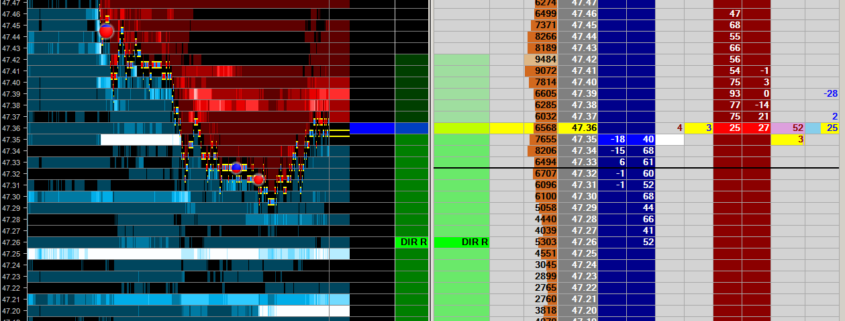
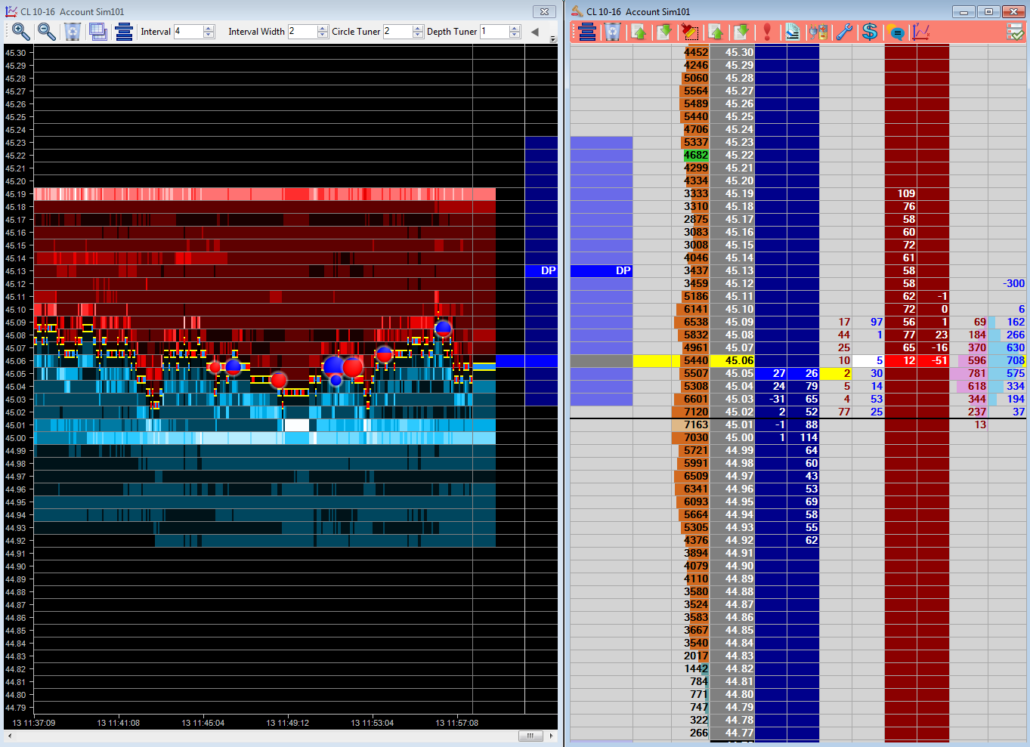
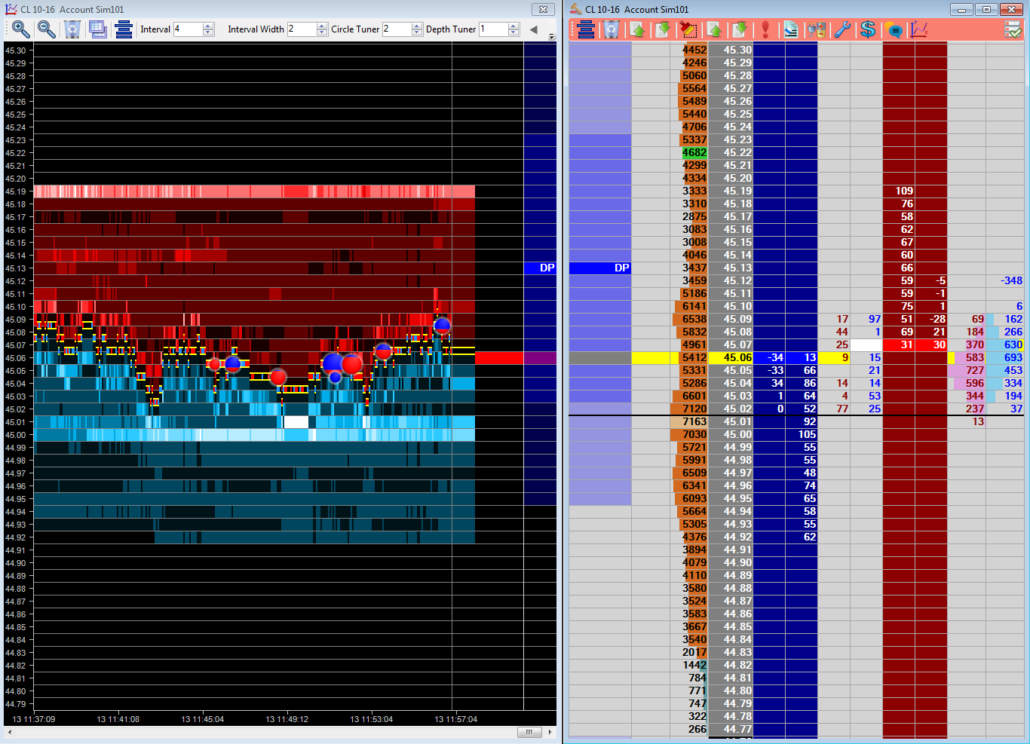
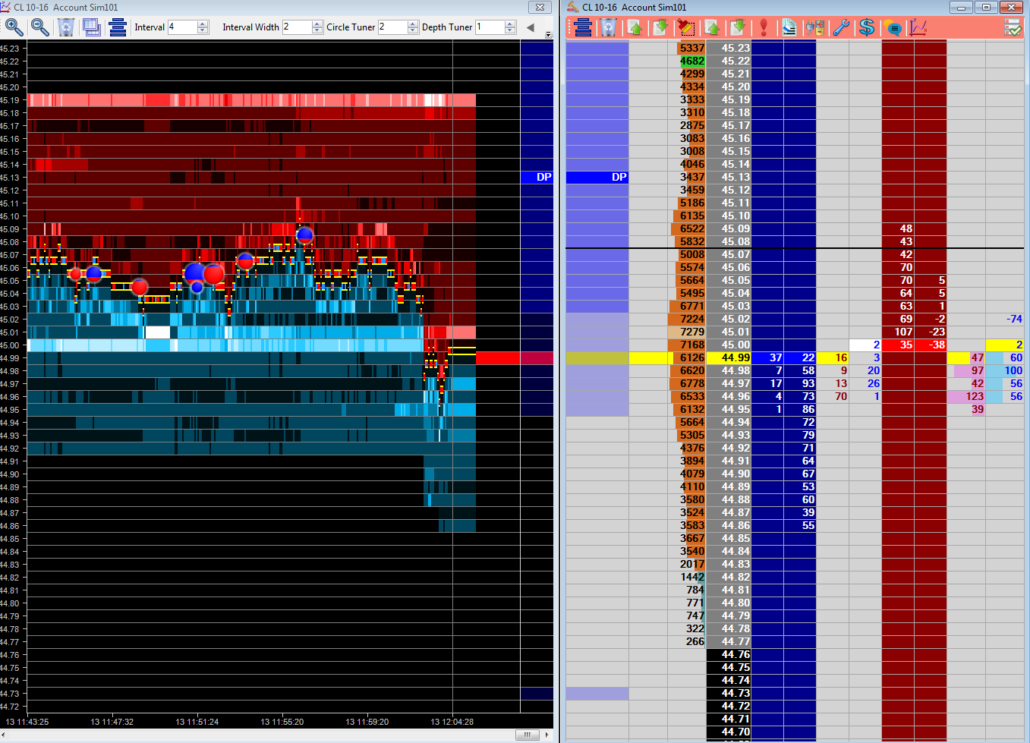
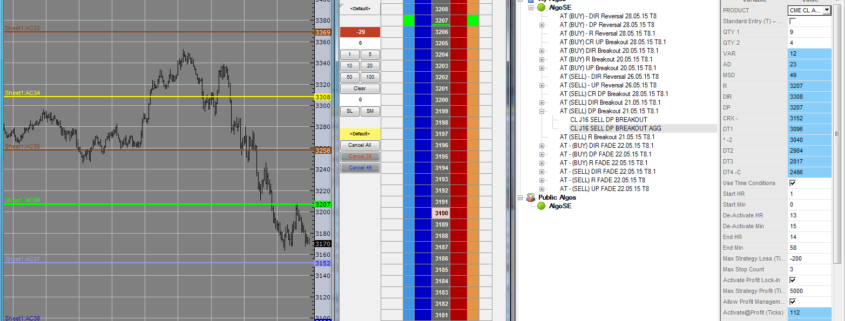
The Jigsaw Trading integration works with the JSDesktop so that the PriceMap Framework and Market Metrics are visible on both the Depth & Sales and Auction Vista.
Be sure you are running Jigsaw Trading version 5.4 or higher.
Open the JS Desktop application, which will automatically create a file with the PriceMap levels for that day. The REFRESH button can be used to request an update.
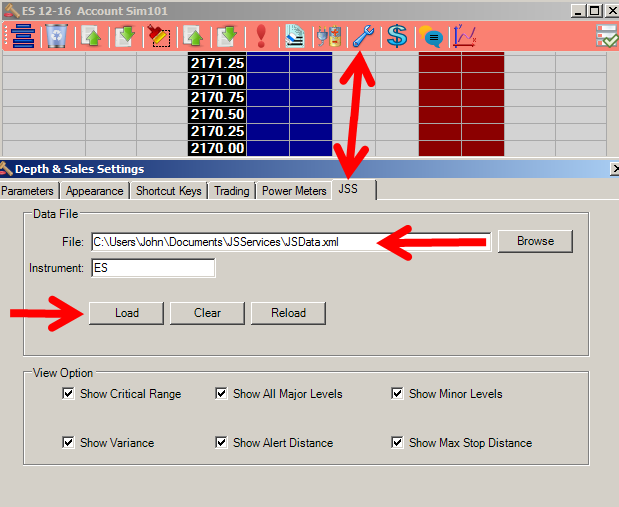
The JSS Tab defines the different options for JS Services Jigsaw Integration.

• Data File – The location of the data file produced by the JSDesktop Tool. By Default this is the (My) C:\Users\???\Documents\JSServices\JSData.xml Documents\JSServices\JSData.xml
• Instrument – The Jigsaw Depth & Sales Settings Instrument id defaults to the first 2 characters of the platform instrument id. The Instrument id must match the JS Symbol from the JSDesktop Market Grid. If it does not, then change the Instrument to the JS Symbol. For example IF ZN is entered in the Instrument box for the 10yr T-NOTE futures THEN change it to the JS Symbol TY to view the Price Map levels for the 10yr T-Note.
• Load – Click the LOAD button to update the levels each day. The data is loaded from the JSDesktop which will automatically update if left open. Note the Desktop date to confirm it is current. If not then refresh the JS Desktop so it has the correct Date and then click LOAD in the JSS integration setting to update JIGSAW.
View Options– Allow you to customize the JSServices PriceMap levels to be displayed.
o Show CriticalRange – Check if you want to display CriticalRange
o Show All Major Levels – Check if you want to display all Major PriceMap Levels
o Show All Minor Levels – Check if you want to display all Minor PriceMap Levels
o Show VAR – Check if you want to display the Variance around the level
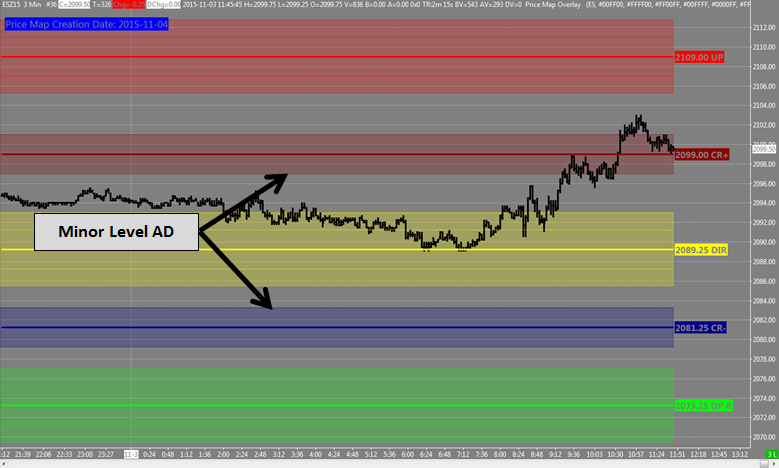
o Show AD – Check if you want to display the Alert Distance around the level
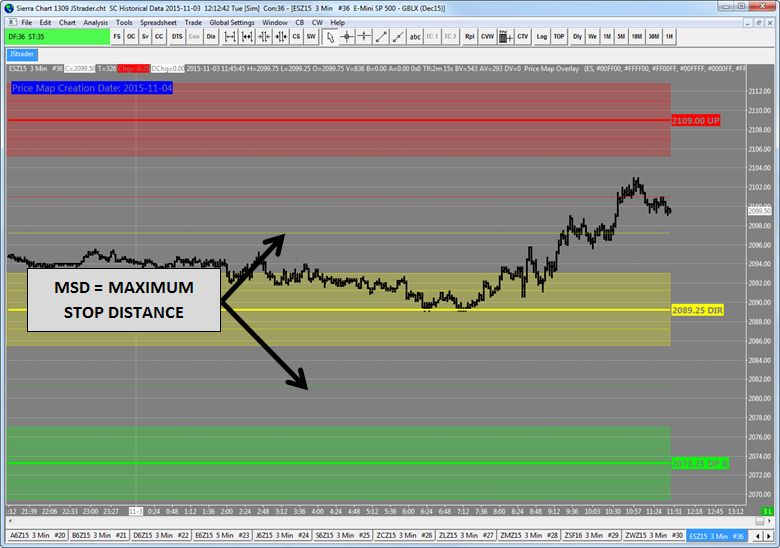
o Show MSD – Check if you want to display the Maximum Stop Distance level
Examples:
Show CriticalRange, all Major Levels and Minor levels
Show VAR
Show AD
Show MSD
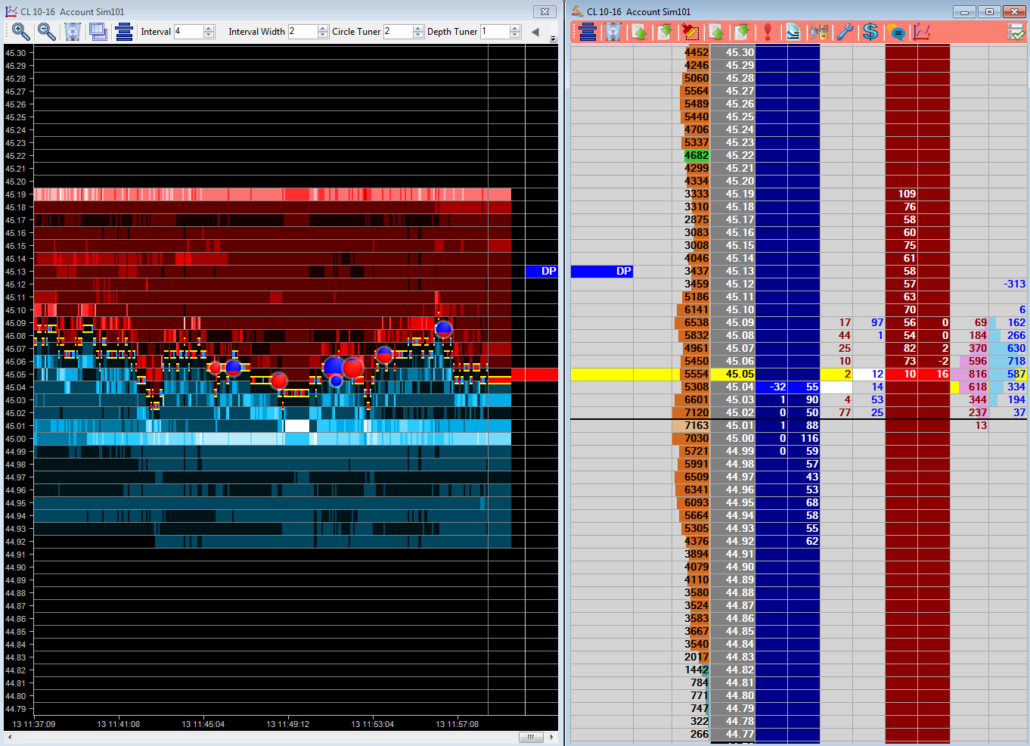
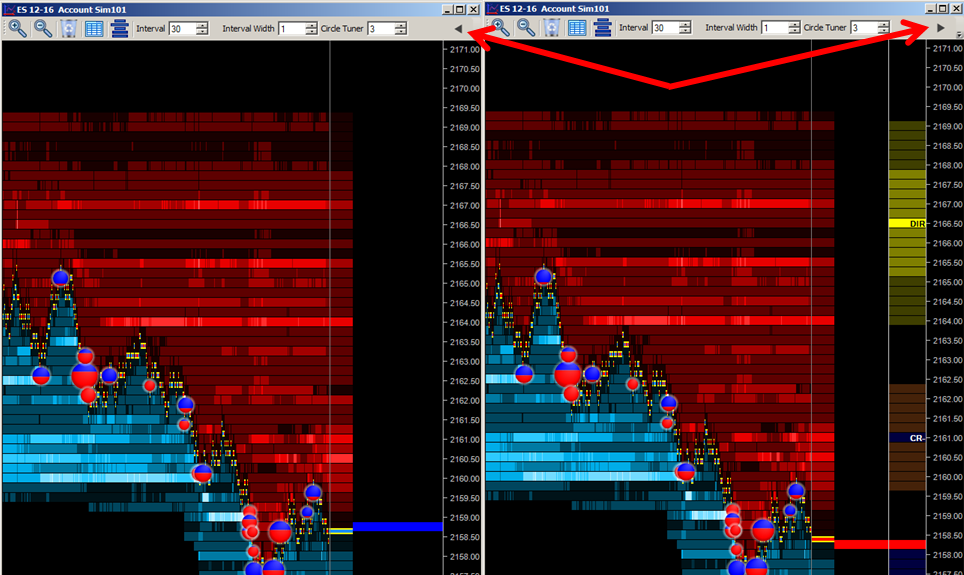
Note: Use the open arrow key to show and hide the PriceMap levels on the Auction Vista.
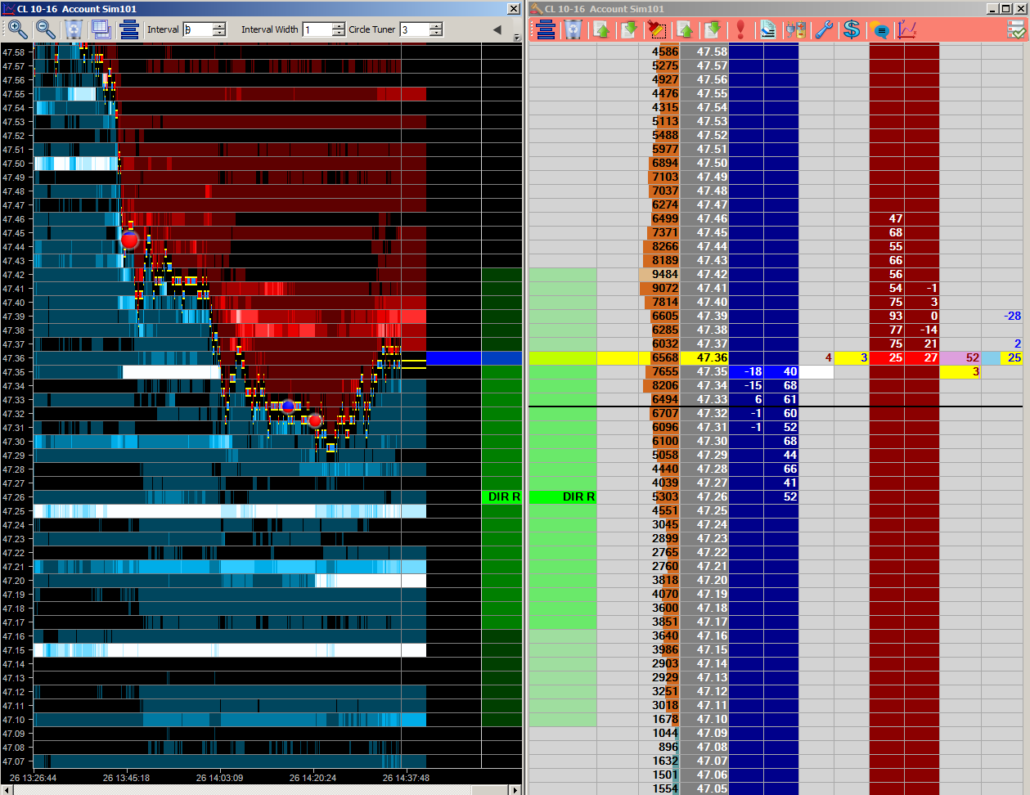
Daily Recap CL Example with Jigsaw Integration set-up
Strategy Recap: ES Example with Jigsaw Part 1
Strategy Recap: ES Example Part 2
Strategy Recap: ES Example Part 3
Optimizing Trade Tactics Jigsaw Webinar http://www.jigsawtrading.com/auction-vista/optimize-trading-tactics-to-make-them-more-effective/?mc_cid=e69e9cca58&mc_eid=30deff3432
![]()
This document will go over how to integrate JSPriceMap Analytics with Trading Technologies MDTrader, XStudy Charts and ADL.

The JSDesktop Data Utility function creates an Excel (JSSheet.xls) in its Default Integration Script which is used to dynamically link into MDTrader, XStudy and ADL.
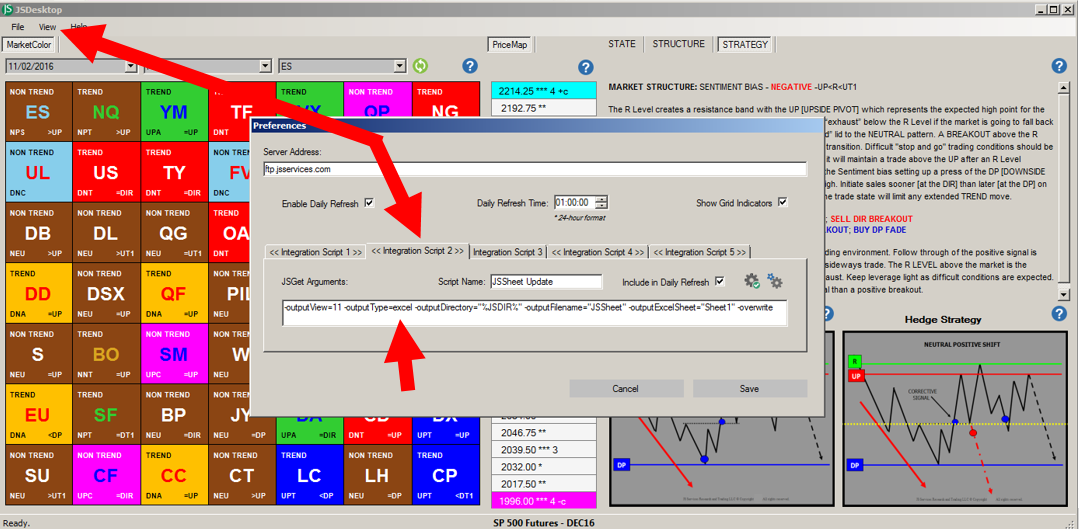
The JSSheet.xls file is saved in the C:/Users/………../Documents/JSServices/ directory.
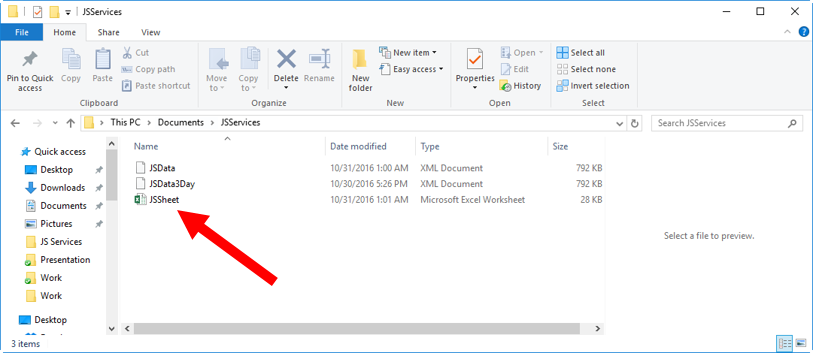
STEP1 – OPEN the JSSheet that was created using the Default Integration Script 2 first before opening TT. The Excel sheet must remain open and stay open until after TT is closed to ensure the integrity of the dynamic linking. If you close the JSSheet prior to closing TT you may lose ALL you saved links.
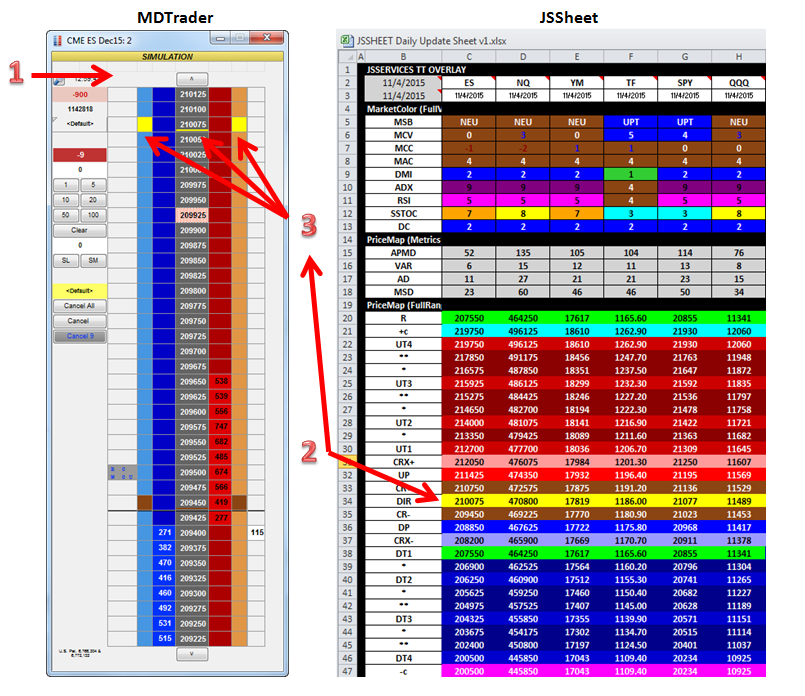
JSSheet TT VIEW 11 Example
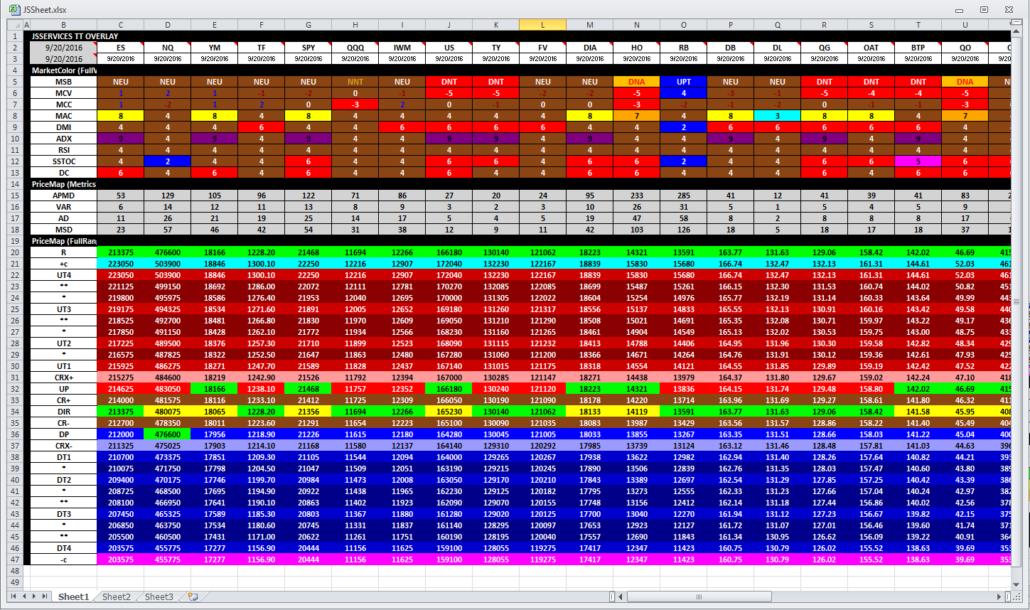
STEPS to ADD JSServices PriceMap analytics to MDTrader.
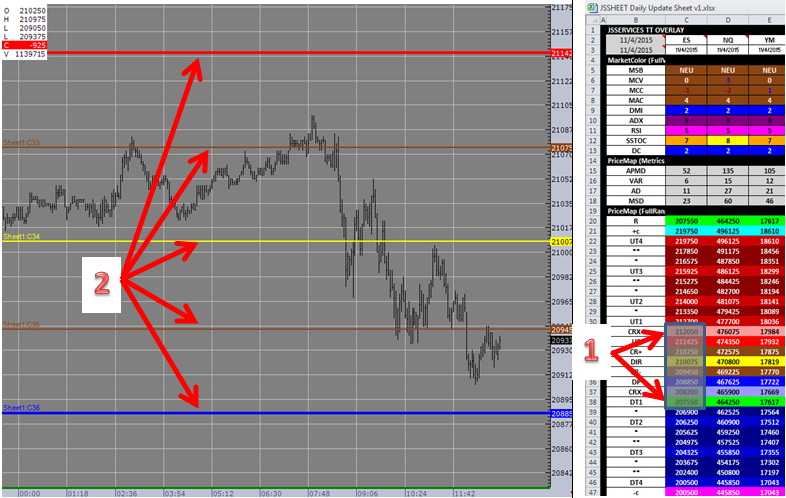
STEPS to ADD JSServices PriceMap analytics to an XStudy chart.
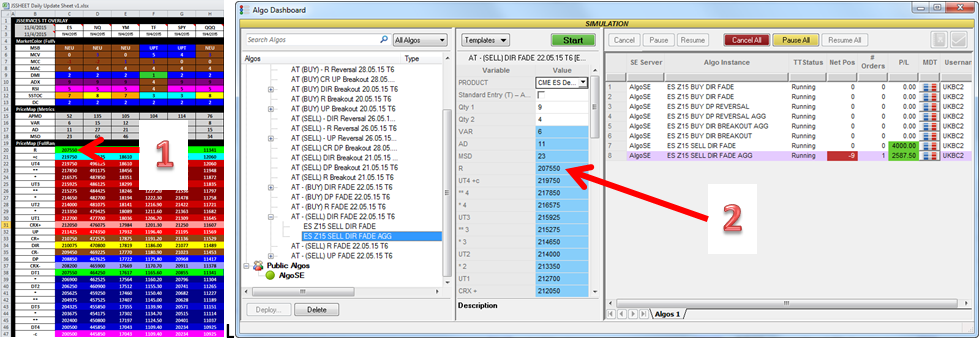
STEPS to ADD JSServices PriceMap analytics to an ADL template.

There are 2 STEPS to ADD JSServices PriceMap analytics to a Sierra Charts. Step 1 is the JSData integration which creates the js_data.xml file that Sierra Charts needs to “read” the analytics and the Step 2 is the Set-Up procedures to load the PriceMap script into Sierra Charts with the proper display settings.
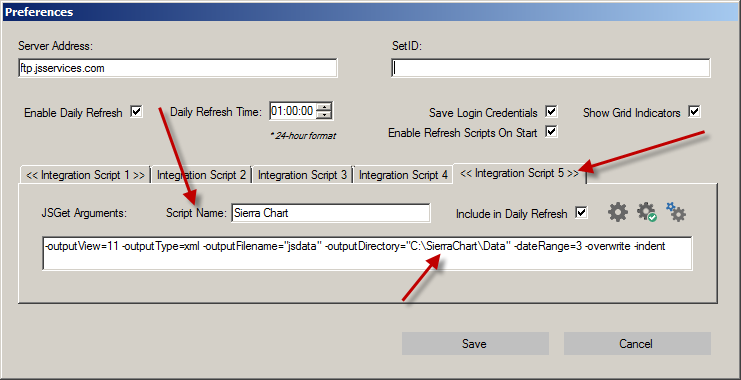
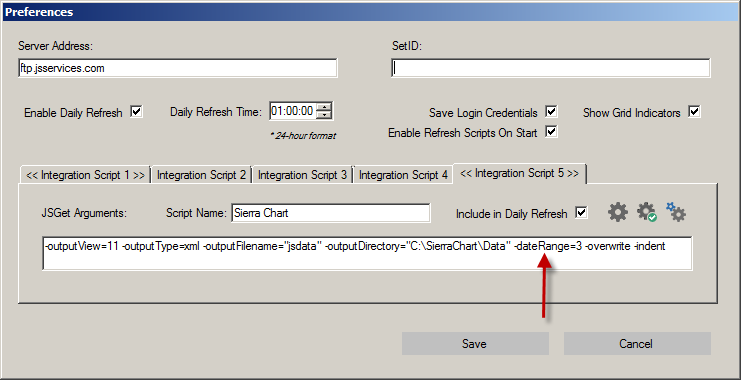
A Sierra Chart Integration Script must be created in the JSDesktop Preference section. The script must have a -outputFilename= “js_data.xml“. Sierra Chart uses the js_data.xml file to display the data. Below is a sample script which should be entered in the INTEGRATION SCRIPT tab 4 or 5.
Example
jsget -outputView=11 -outputType=xml -outputFilename=”js_data” -outputDirectory=” C:\SierraChart\Data” -dateRange=3 -overwrite –indent
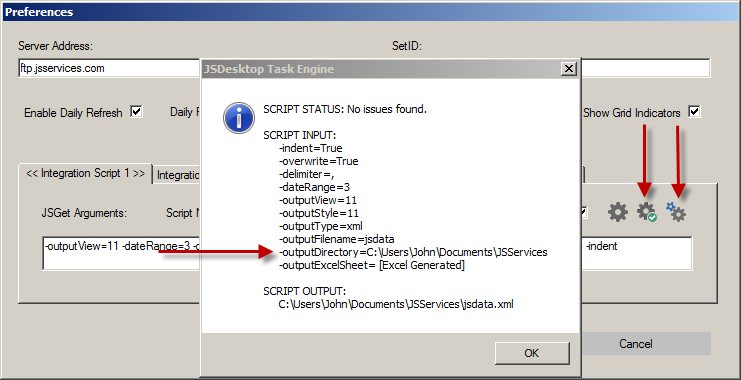
After the script is entered click on the gear with the green check to confirm that everything has been entered correctly. If not an ERROR message will alert you to the issue. If the script has been entered correctly then a message of “No Issues found” will be shown. To test that the script is working, click on the small gears to run the script. The large gear to the left will reset the script to the default settings.
Note: Prior to the Set-Up process you must send mailto:info@jsservices.com your Sierra Charts User ID. Please let us know if you are on Transact. The JSServices Sierra Chart integration does not need to be downloaded separately it is all done with permissions using your User ID within Sierra Charts. Be sure to have the latest version of Sierra Charts loaded.
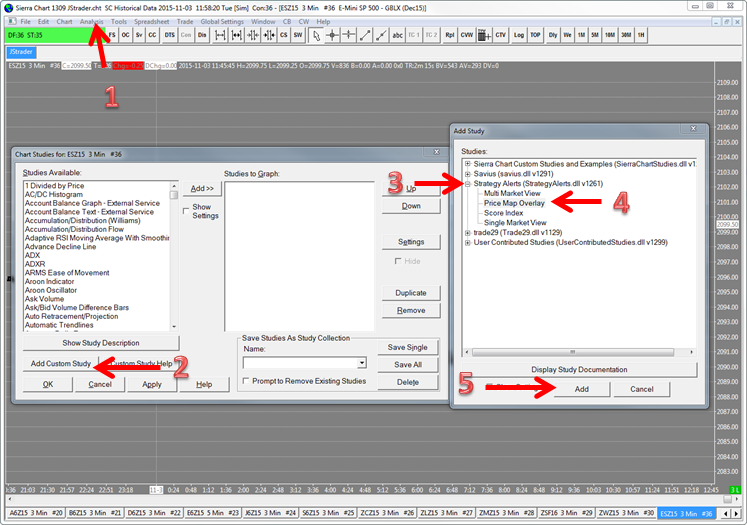
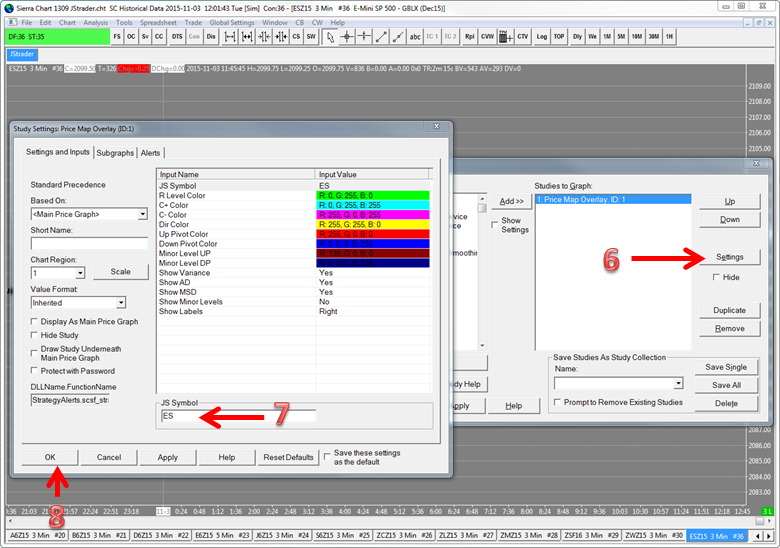
6. Click SETTINGS to open the STUDY SETTINGS PRICE MAP OVERLAY window
7. Edit the JS Symbol. The symbol should match the symbol on the JSDesktop MarketColor Grid.
8. Click OK
When you open the CHARTBOOK each day the PriceMap levels may not be visable until you change a chart parameter like the chart TIME from 3min to 5min for example. An alternative is to OPEN the CHARTBOOK and then CLOSE the CHARTBOOK. Then when you OPEN it again all the levels should be displayed.
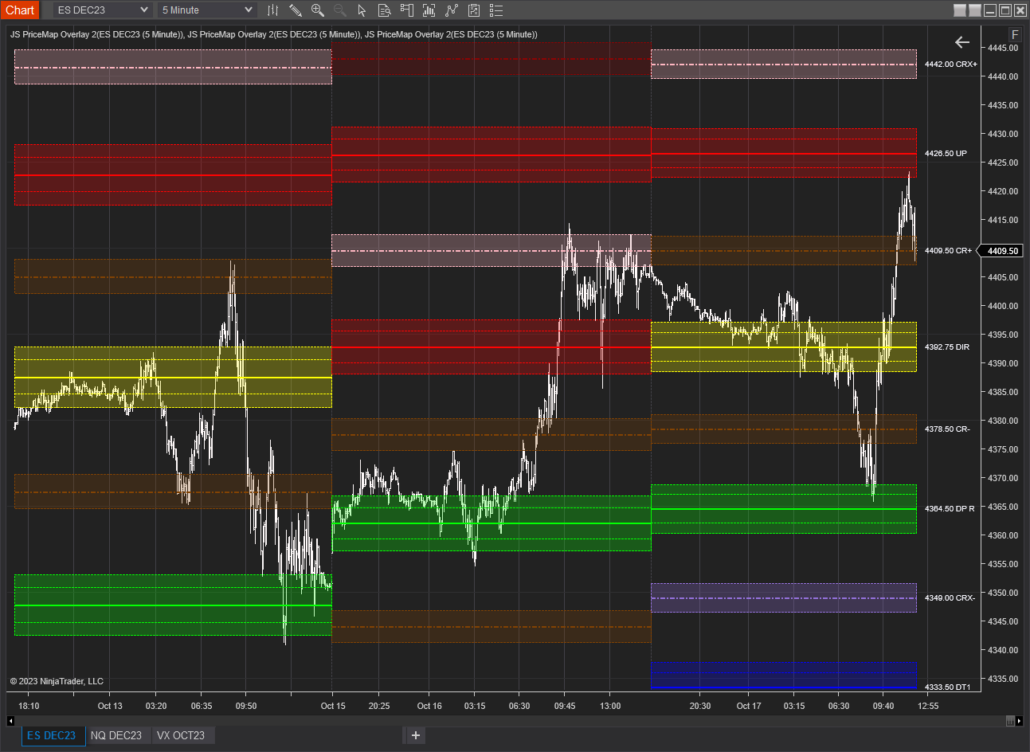
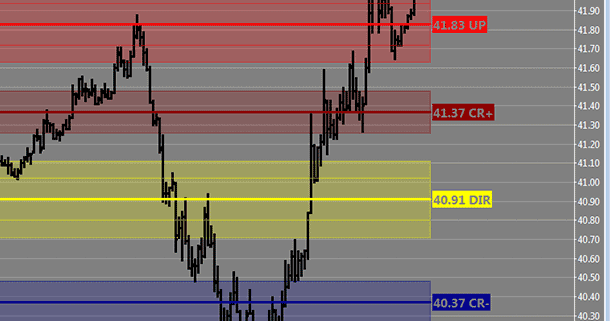
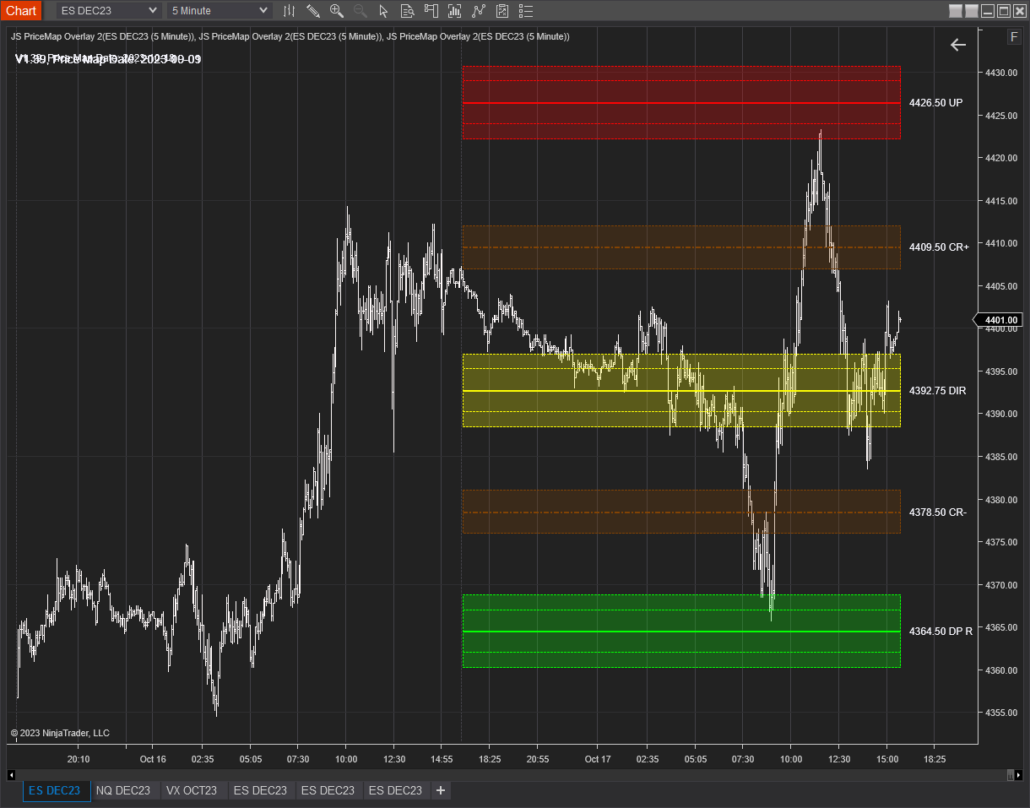
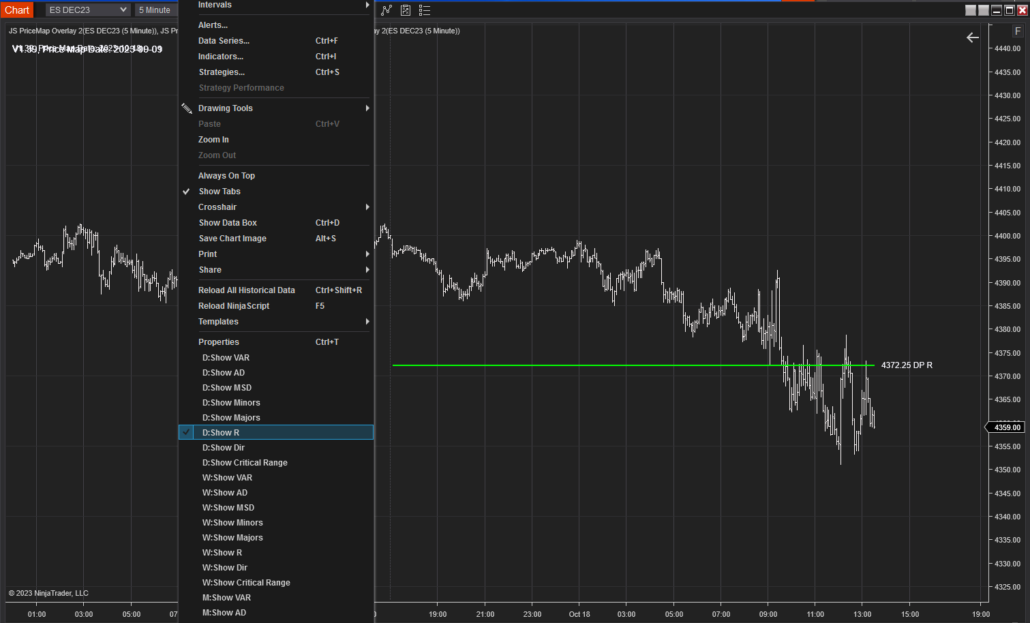
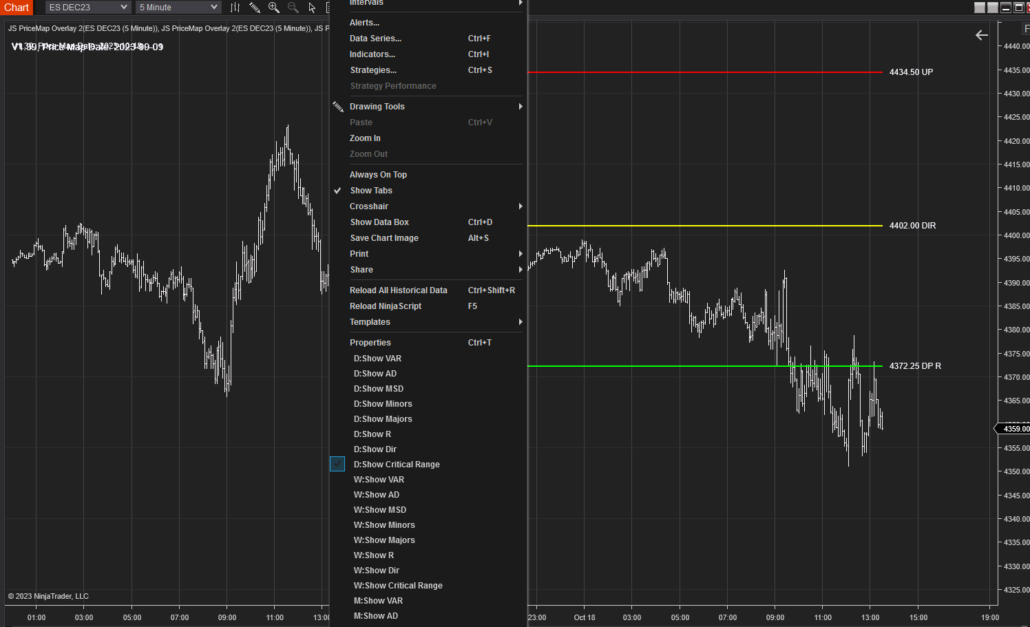
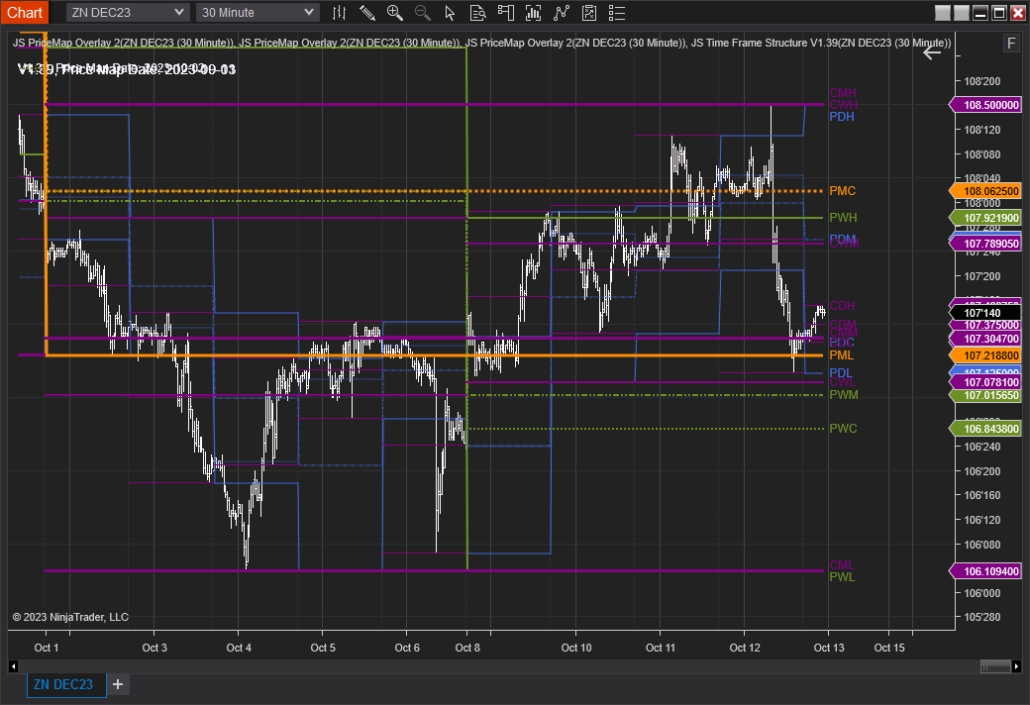
The PriceMap levels and Market Metrics can be customized by right clicking the chart.
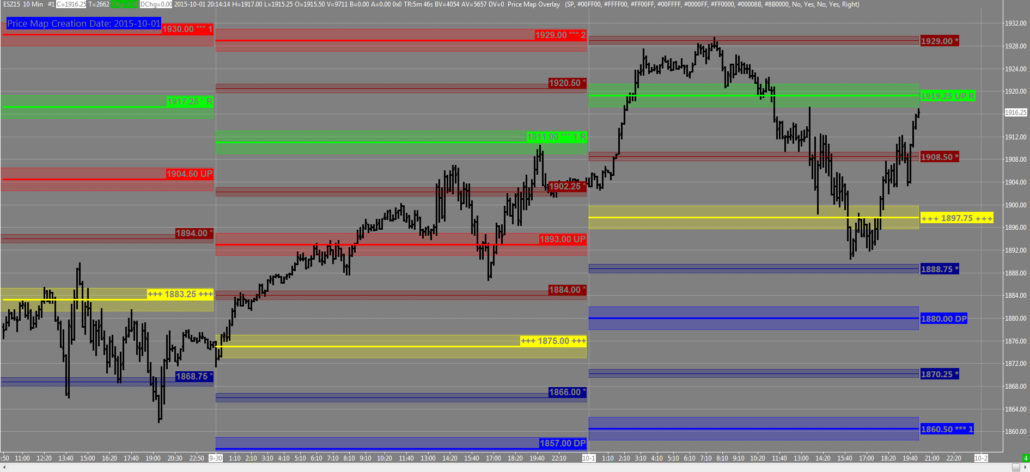
If no features are selected only the Major Price Map Levels (MPML) are displayed. This provides a nice broad overview of the key Market Structure PriceMap levels.
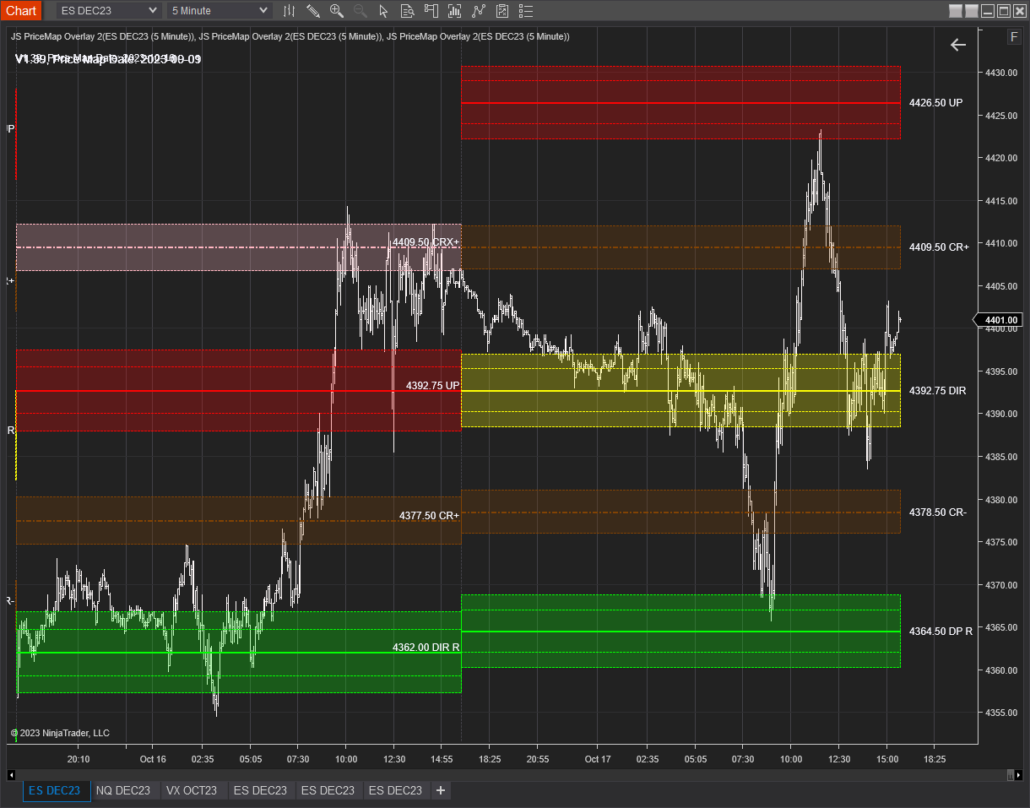
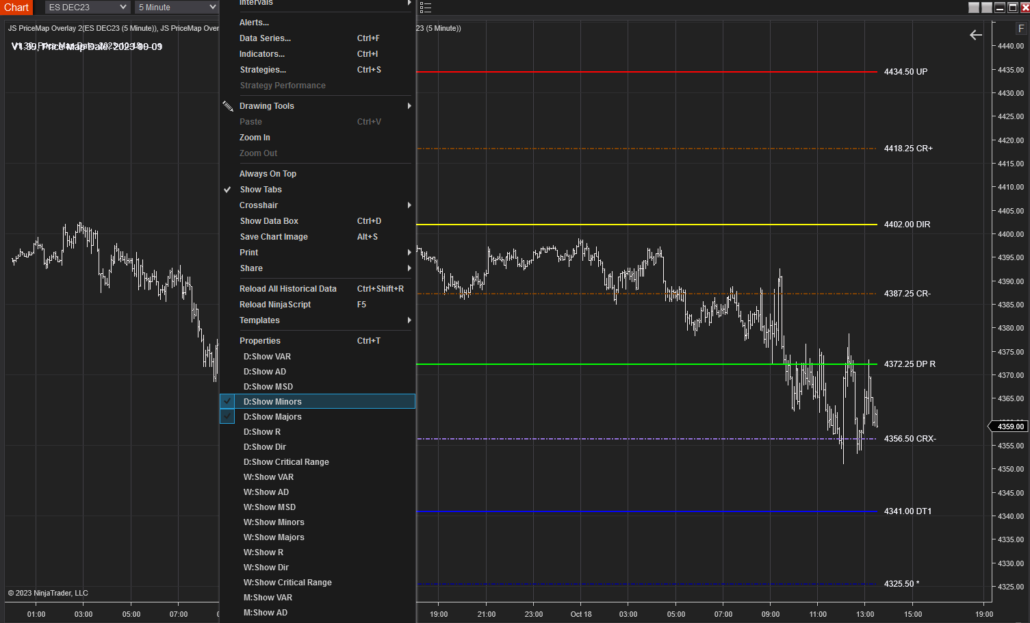
If the Show Minor Levels feature is selected the FULL PriceMap will be displayed.
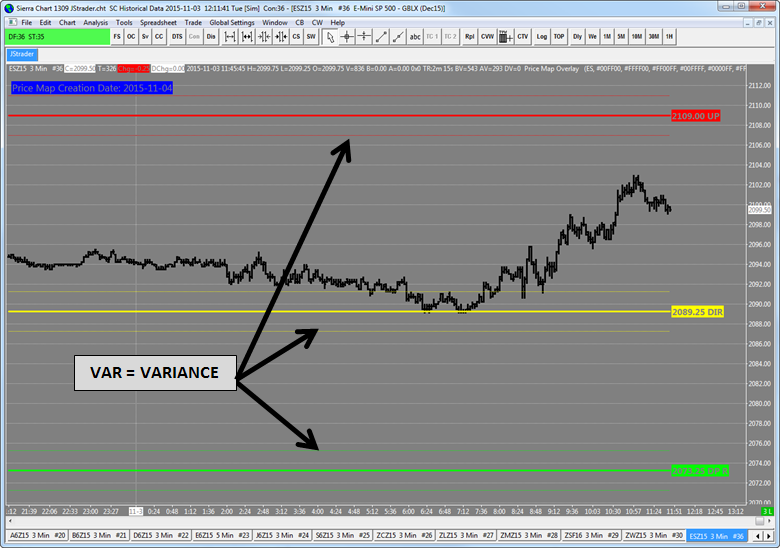
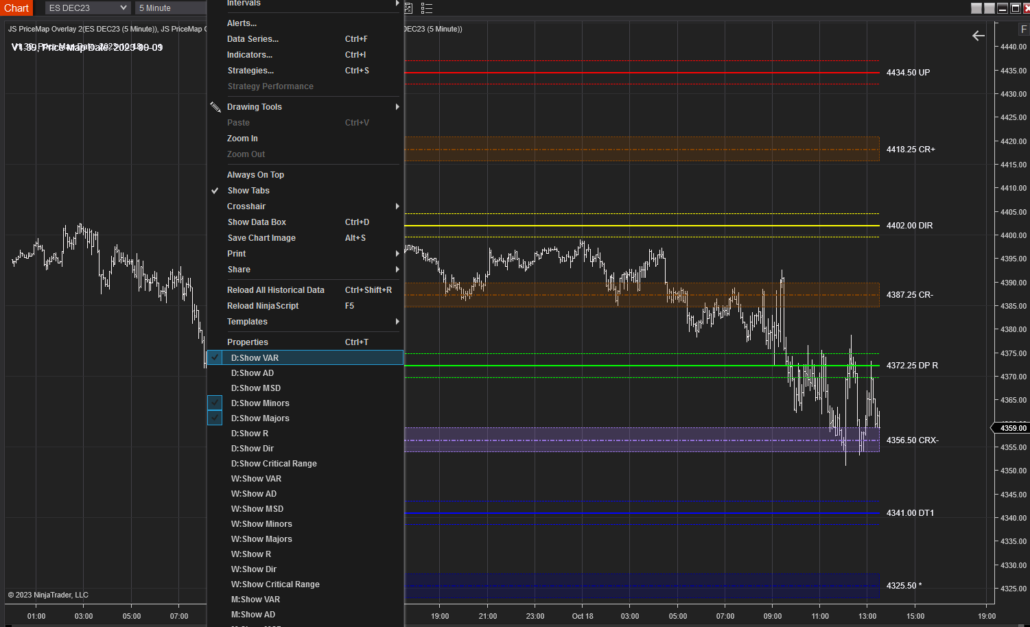
The Market Metrics identify the area of influence around a PriceMap level. Each metric has its own variance and meaning. These metrics are dynamically updated each day in accordance to the volatility expectation of the trade period.
The VAR metric represents the optimal area to entry or exit the market. It also identifies the potential “slippage” area around a Major PricMap level.
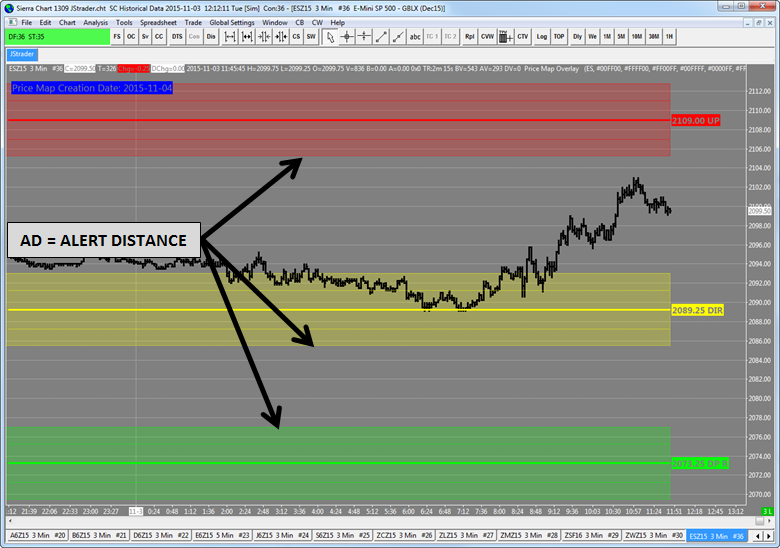
The AD identifies the value area or sweet spot around a PriceMap level. This is the distance that defines the zone that most profitable trades will occur within. In addition it is a good metric to identify when market price is “through” a level.
The MSD is the maximum distance for any influence a PriceMap level with have and confirmation that the level has been violated.
In the FULL VIEW the Minor PriceMap levels will only have the AD displayed. There are no VAR or MSD metrics for the Minor PriceMap levels.
The default setting displays the current trading session PriceMap data. Up to 3 days’ worth of data can be requested by adding the following parameter to the Integration script : -dateRange=3. Below is an example that will grab 3 days’ worth of JSData. 3 is the maximum number of days that can be displayed. This may slow the daily retrieval down slightly.
Script Example:
-outputView=11 -outputStyle=5 -outputType=xml -outputFilename=”js_data” -outputDirectory=”C:\SierraChart\Data” -dateRange=3 -overwrite –indent

How to set-up the JS PRICEMAP Integration Video click HERE
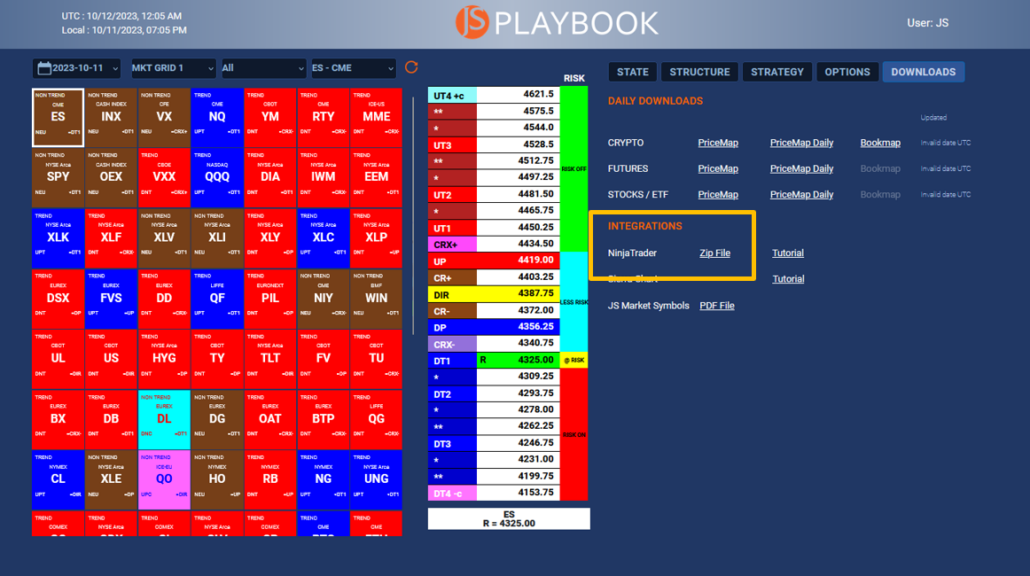
The PRICEMAP integration for NinjaTrader comprises two essential parts:
Updating this data is a crucial part of your DAILY WORKFLOW.
To DOWNLOAD DATA:
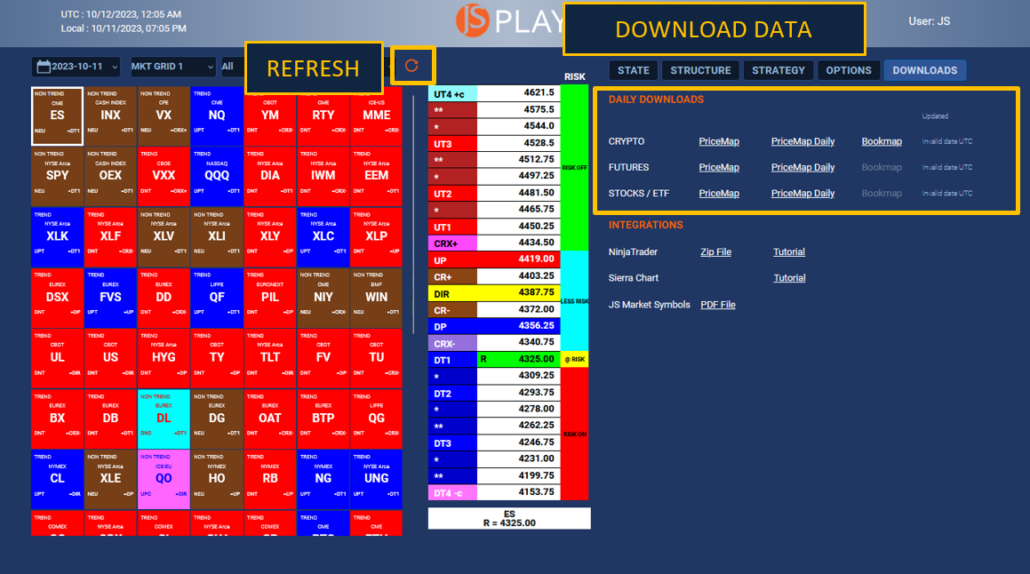
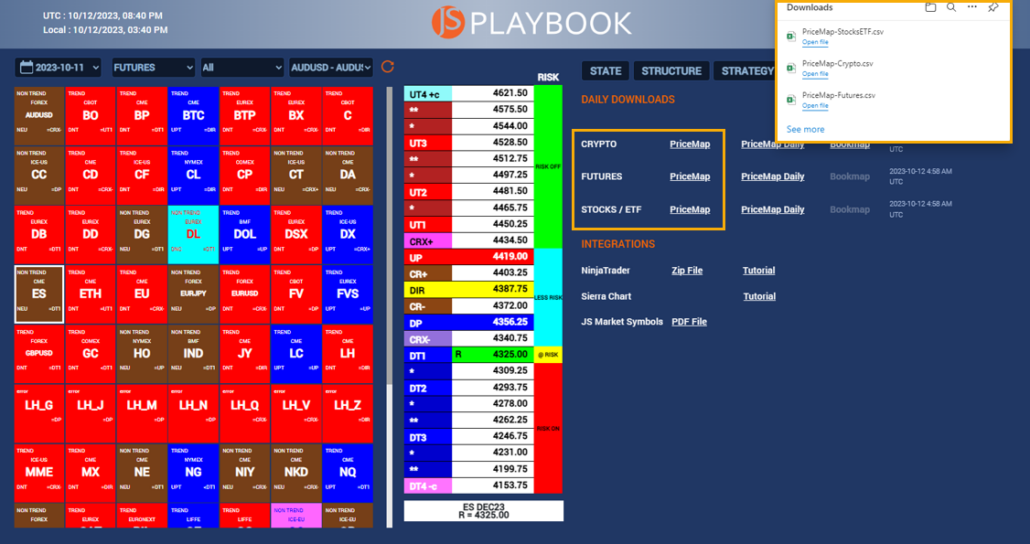
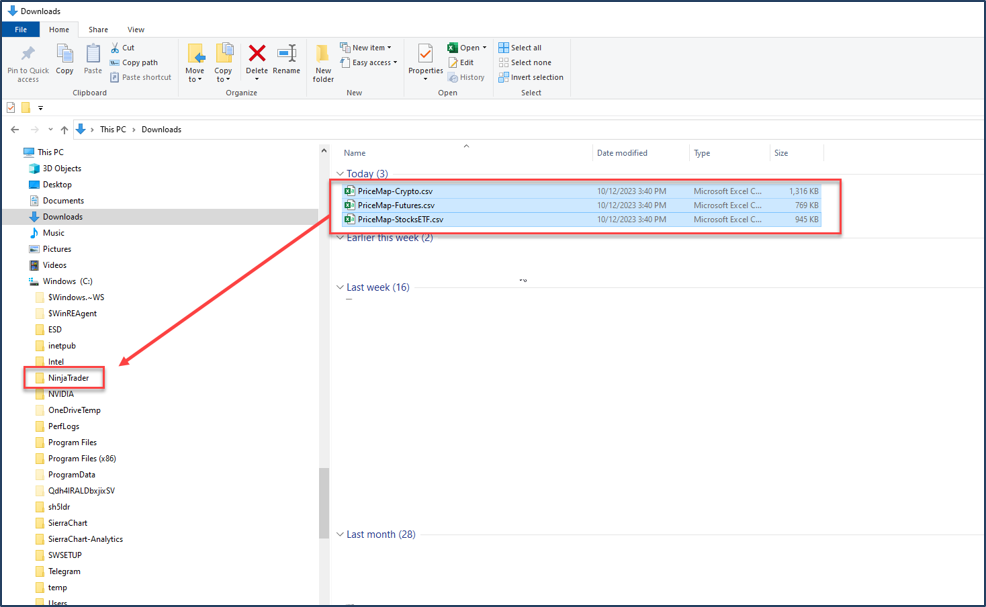
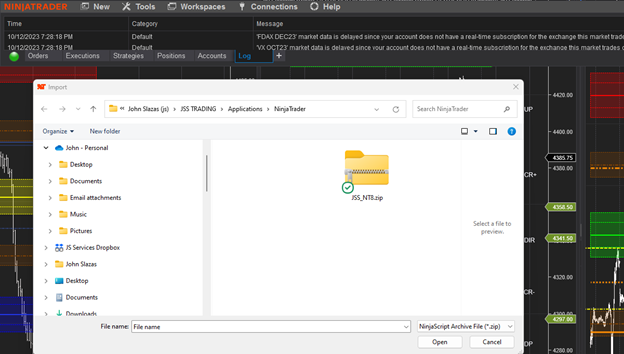
Download and save the JS_NT8.zip file from the JS PLAYBOOK DOWNLOAD tab. You can save it in the same directory you created for your data files.
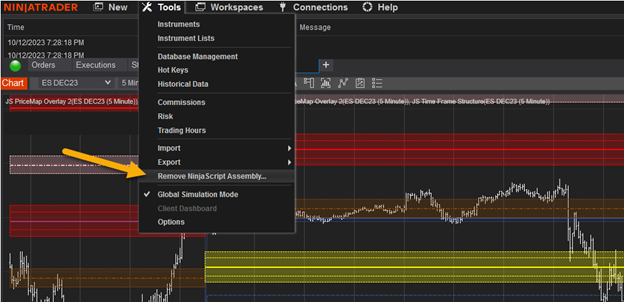
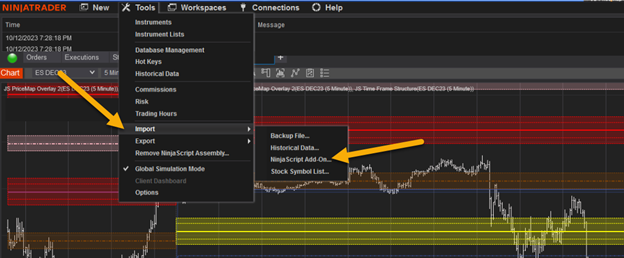
NinjaTrader will confirm the success of the IMPORT. If not close and re-open the NT application and repeat STEP 2.
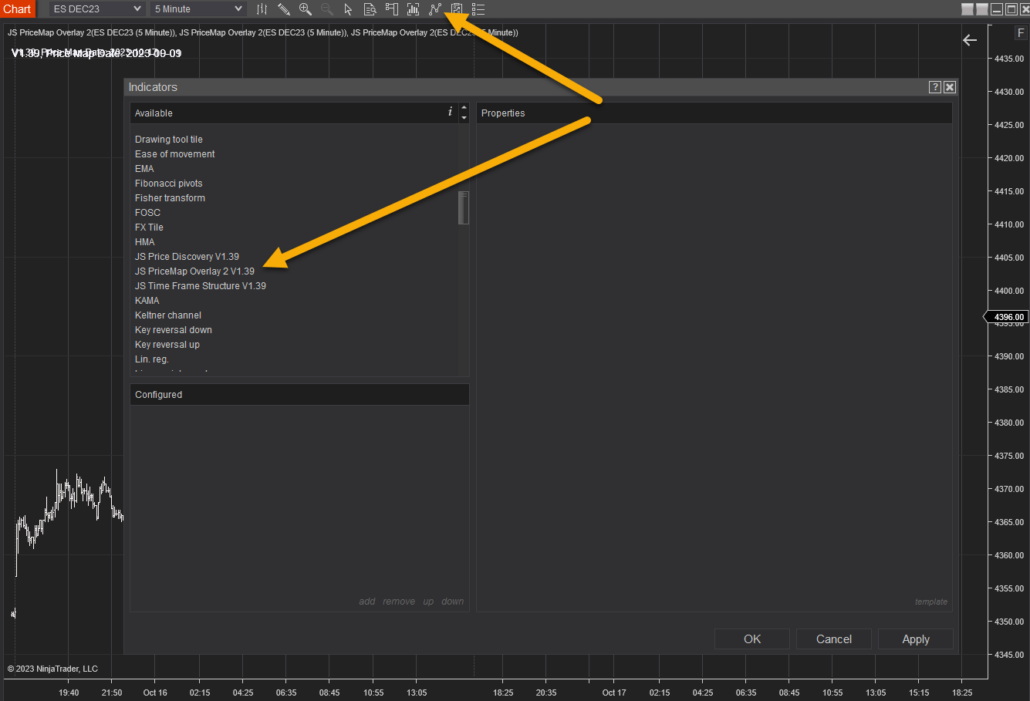
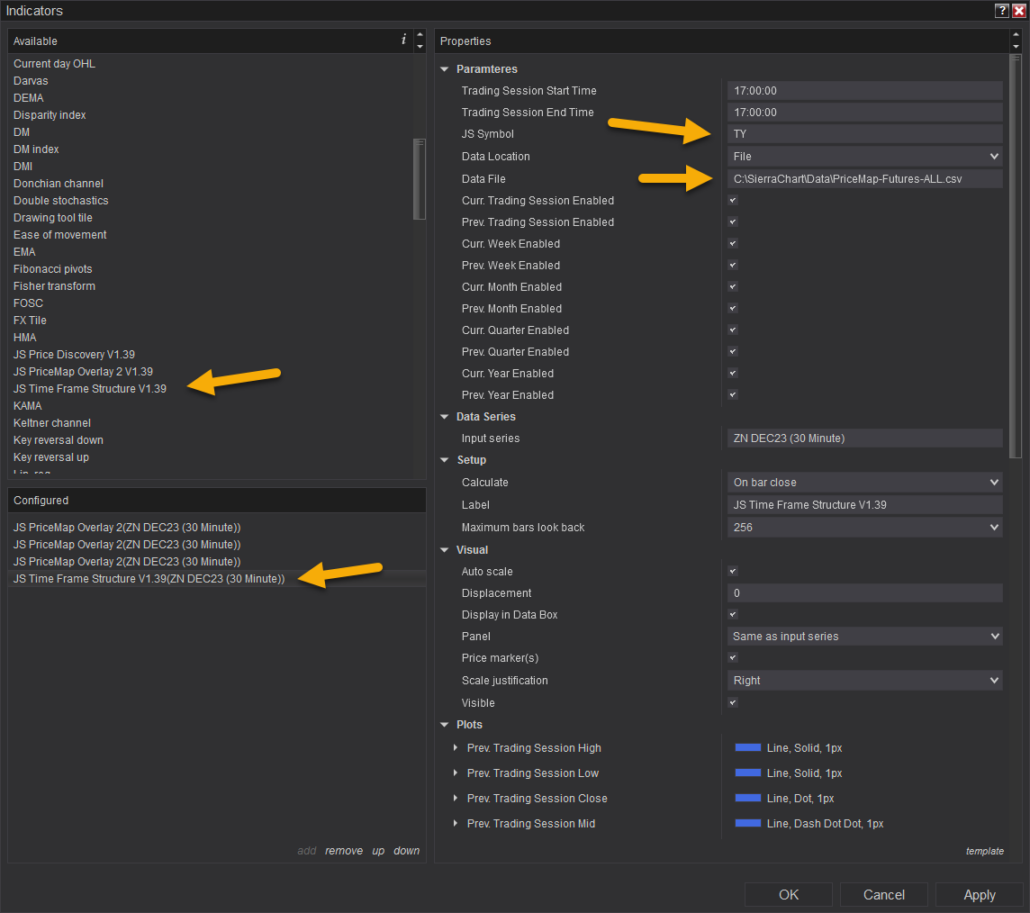
2. Select the JS PriceMap Overlay Indicator and select ADD.
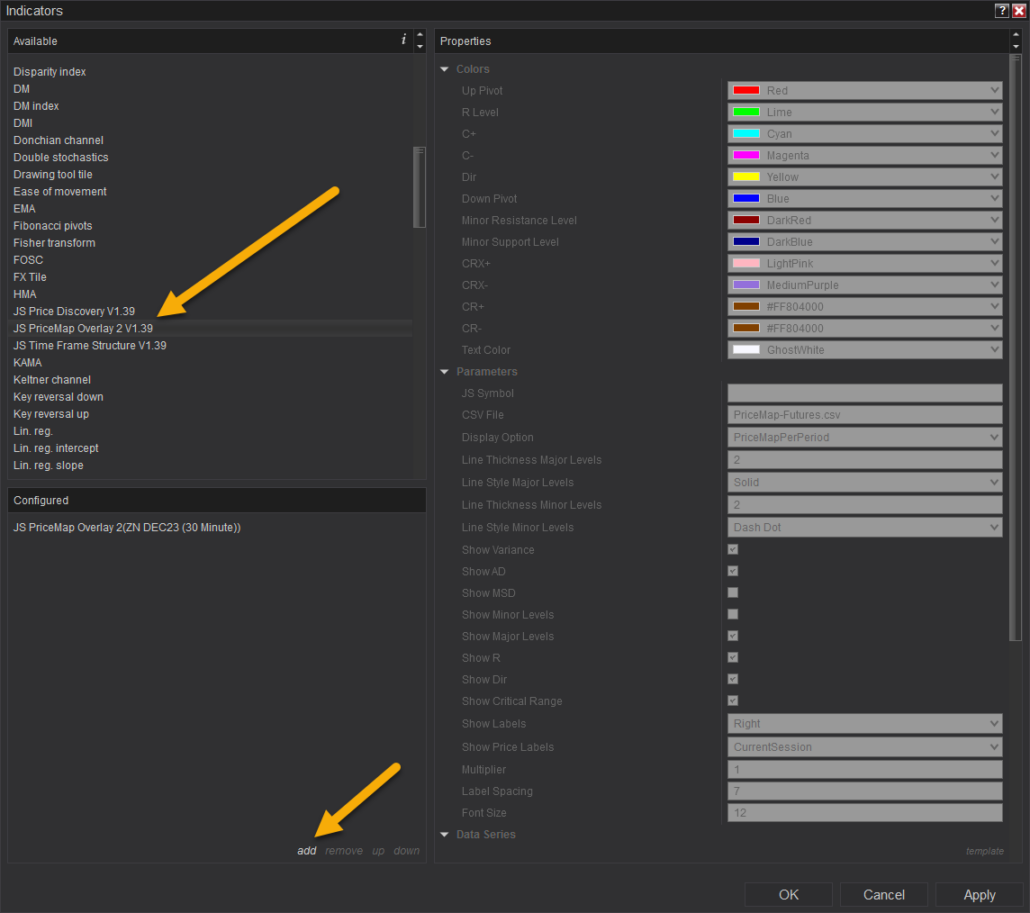
3. Enter the JS Symbol with the Time Frame for the desired PriceMap period. Example below:
TY.D = 10yr T-NOTE DAILYPriceMap
TY.W = 10yr T-NOTE WEEKLY PriceMap
TY.M = 10yr T-NOTE MONTHLY
4. Enter the CSV FILE path. Be sure to enter the entire directory name, file name and extension. Example below (Your path will be unique to your machine):
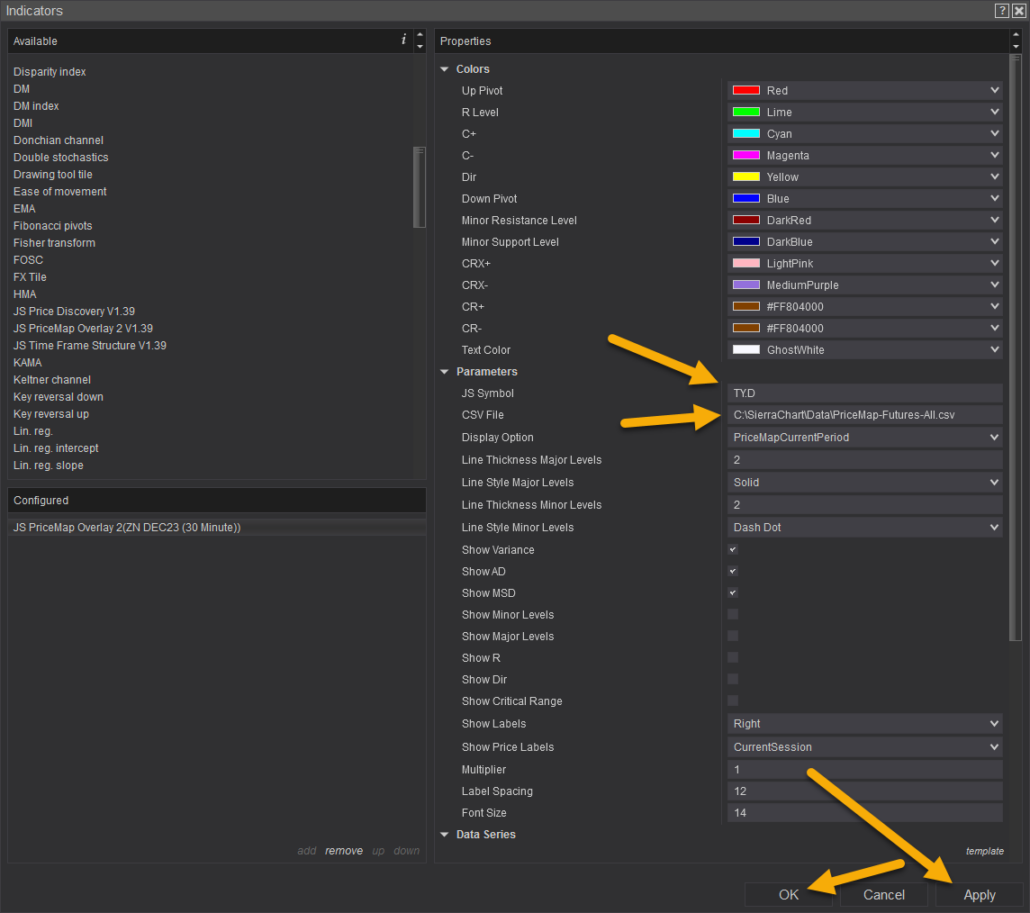
5. Click APPLY then OK. The PriceMap Levels should appear.
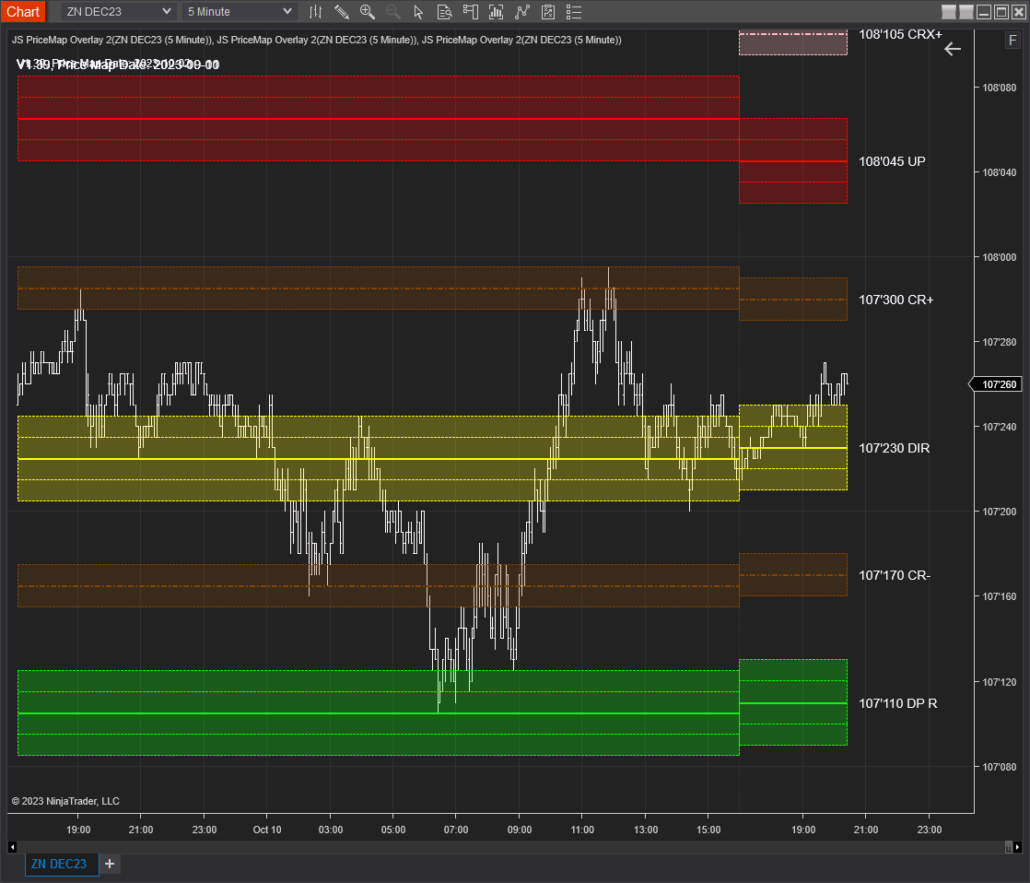
If the PriceMap levels do not show up
6. Set up All PriceMap Indicator Timeframes
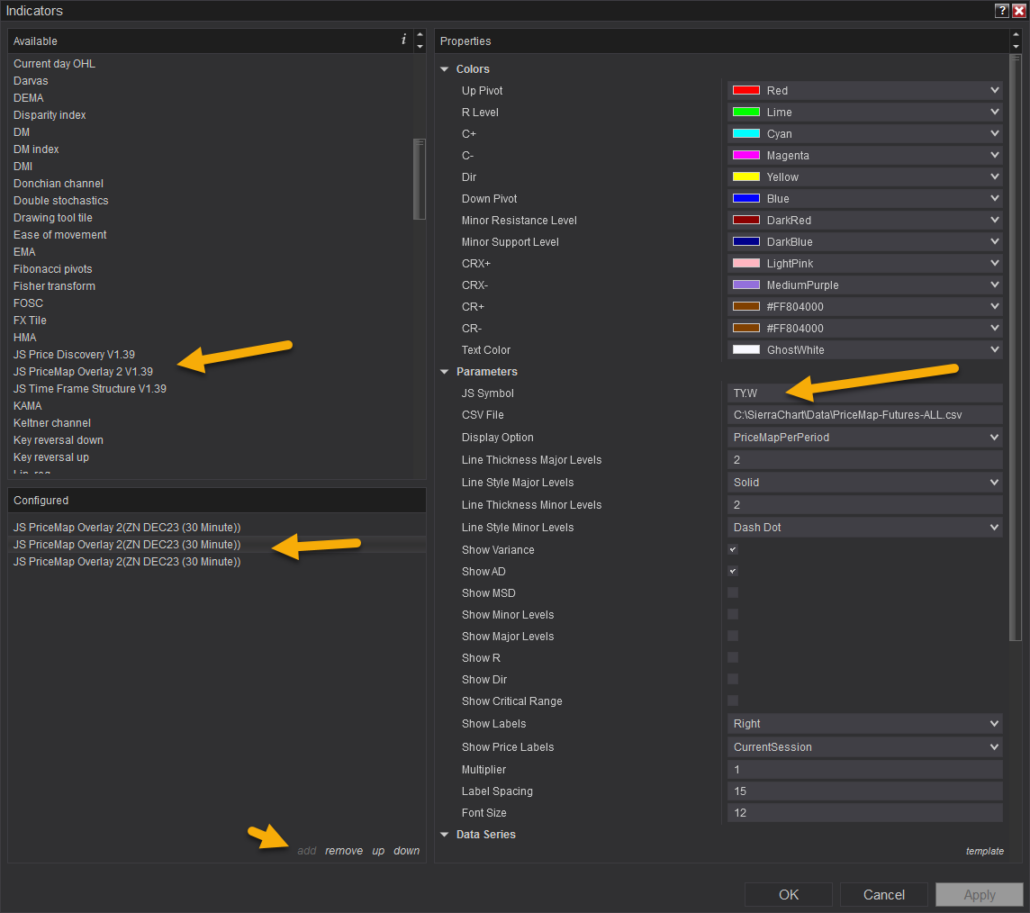
The PriceMap Overlay Indicator has many customization settings. This section will go over the key ones that can ONLY be modified in the setting Properties not directly from the chart Display:
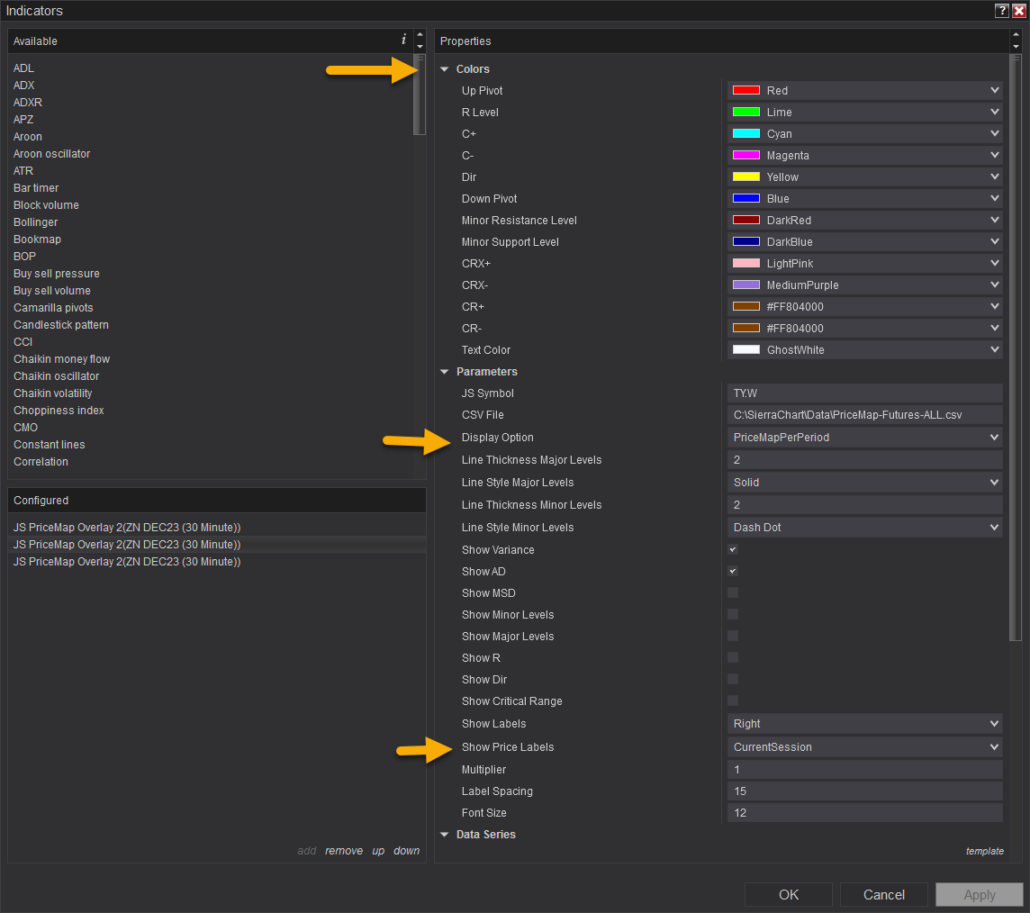
Remember, use this feature wisely and understand its limitations.
For optimal trading accuracy, it’s essential to use this recommended setting.
For effective trading, rely predominantly on the current period’s PriceMap levels.

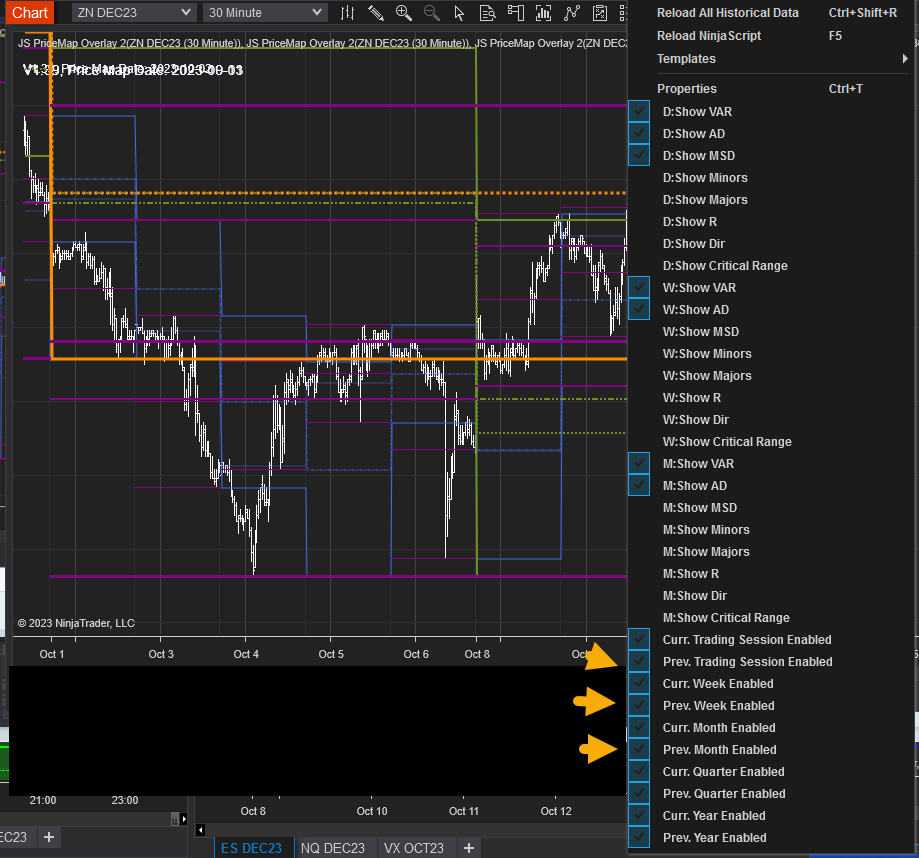
The display features are accessed by RIGHT CLICK on the chart. Here are the basic Display Features:
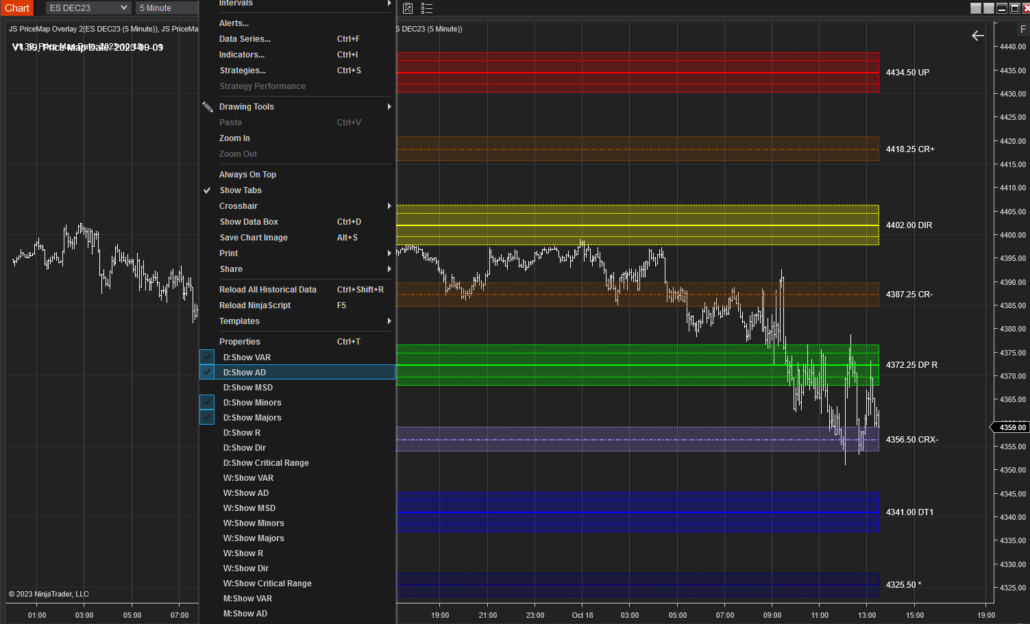
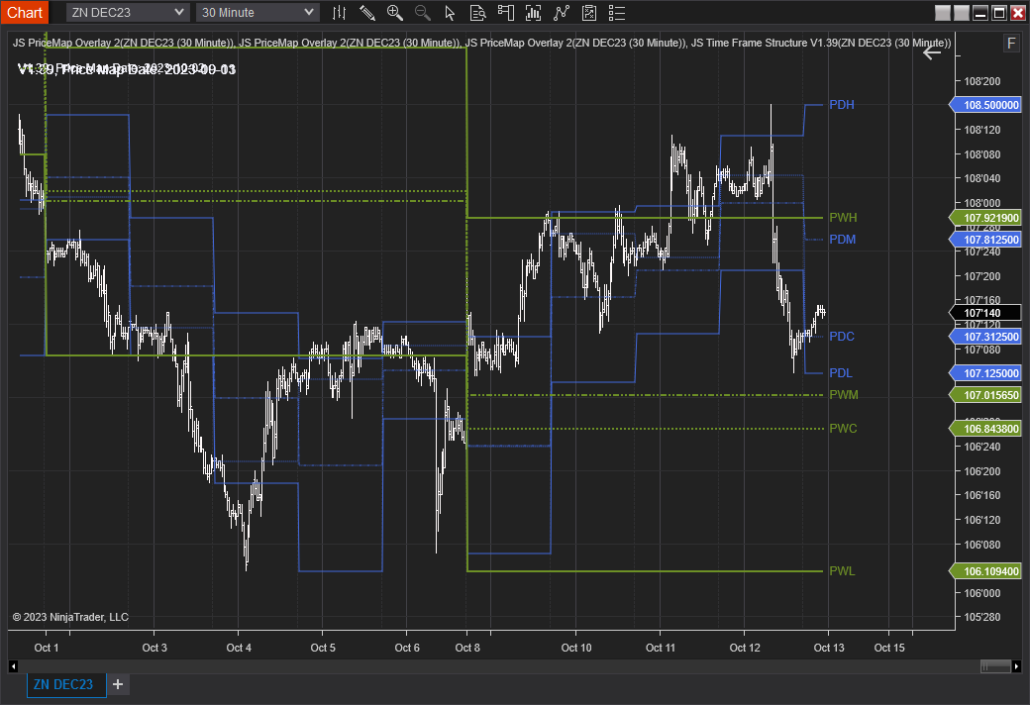
The JS TIME FRAME STRUCTURE Indicator can be accessed in the same manner as the JS PriceMap Overlay. The TIME FRAME STRUCTURE plots the Previous Period HIGH, LOW, CLOSE and MIDPOINT and the Current Period HIGH, LOW and MIDPOINT.
4. Click APPLY and OK
The default setting is for the indicator to display all time frames for both the Current and Previous Period.
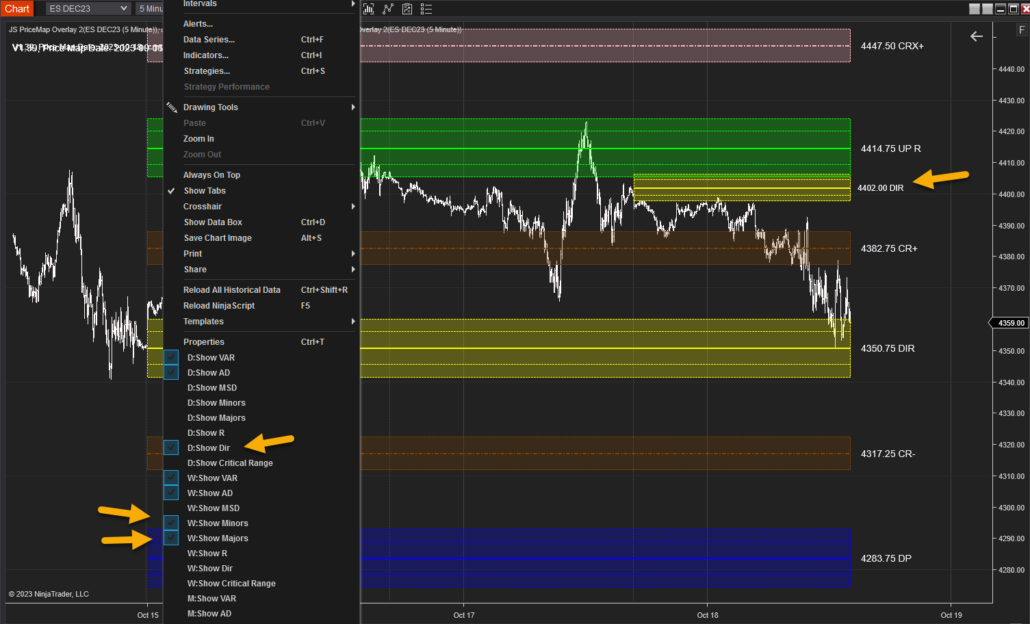
RIGHT CLICK on the chart to select the desired Time Frame and period to display. You may have to scroll down to view all the display options.
Below is a view of the PREVIOUS DAY and the PREVIOUS WEEK parameters.
NOTE on Time Frame Structure:
Prioritizing the PREVIOUS PERIOD TIME FRAME STRUCTURE is essential, as it holds more significance than the CURRENT PERIOD. The data for the CURRENT PERIOD, sourced from the data file, can be outdated, especially if the market is recording new highs or lows for that time frame.
However, as we approach the end of a time frame period, the CURRENT PERIOD structure gains relevance. A notable exception is the CURRENT PERIOD MIDPOINT, equivalent to the period’s VWAP, which remains consistently valid.
Recommendation: Focus primarily on the PREVIOUS PERIOD. It serves as the main time frame structure and provides a more reliable foundation for trading decisions.
