Application Integration Sierra Charts

Sierra Charts Webvideo Tutorial Click here
There are 2 STEPS to ADD JSServices PriceMap analytics to a Sierra Charts. Step 1 is the JSData integration which creates the js_data.xml file that Sierra Charts needs to “read” the analytics and the Step 2 is the Set-Up procedures to load the PriceMap script into Sierra Charts with the proper display settings.
Step 1 : JSData Integration
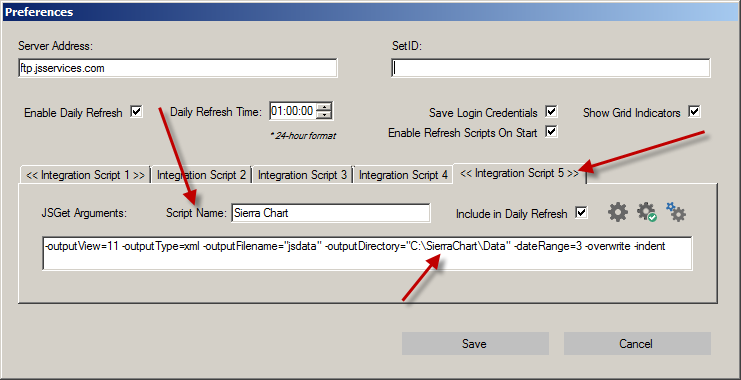
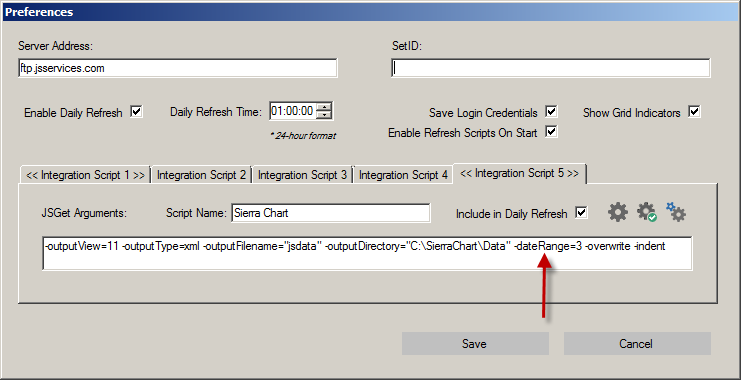
A Sierra Chart Integration Script must be created in the JSDesktop Preference section. The script must have a -outputFilename= “js_data.xml“. Sierra Chart uses the js_data.xml file to display the data. Below is a sample script which should be entered in the INTEGRATION SCRIPT tab 4 or 5.
Example
jsget -outputView=11 -outputType=xml -outputFilename=”js_data” -outputDirectory=” C:\SierraChart\Data” -dateRange=3 -overwrite –indent
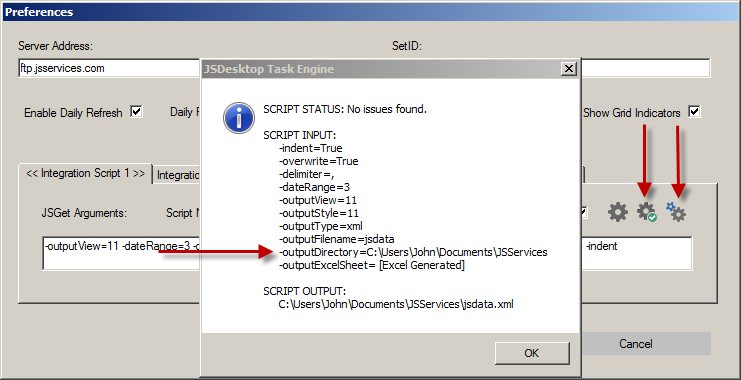
After the script is entered click on the gear with the green check to confirm that everything has been entered correctly. If not an ERROR message will alert you to the issue. If the script has been entered correctly then a message of “No Issues found” will be shown. To test that the script is working, click on the small gears to run the script. The large gear to the left will reset the script to the default settings.
STEP 2 : Sierra Charts Set-Up
Note: Prior to the Set-Up process you must send mailto:info@jsservices.com your Sierra Charts User ID. Please let us know if you are on Transact. The JSServices Sierra Chart integration does not need to be downloaded separately it is all done with permissions using your User ID within Sierra Charts. Be sure to have the latest version of Sierra Charts loaded.
Set- Up procedures
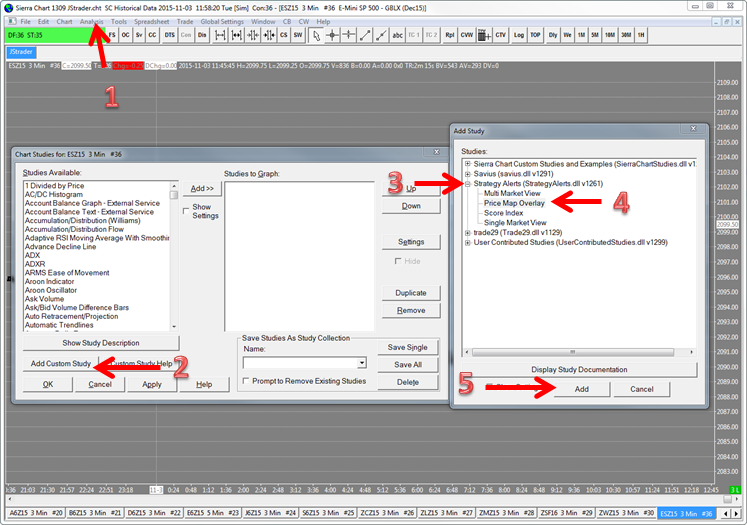
- Open ANALYSIS –> STUDIES editor or type F6
- Select ADD CUSTOM STUDY to open the Add Study Window
- Locate STRATEGY ALERTS and select PRICE MAP OVERLAY
- Select PRICE MAP OVERLAY
- Click ADD
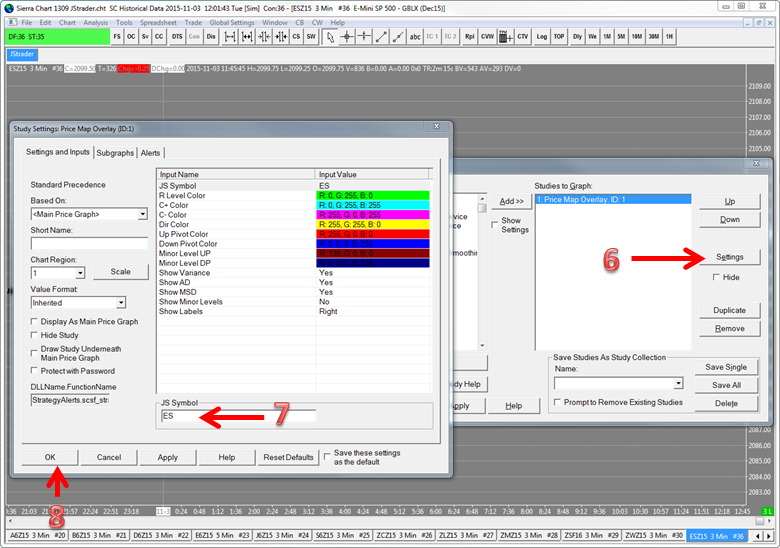
6. Click SETTINGS to open the STUDY SETTINGS PRICE MAP OVERLAY window
7. Edit the JS Symbol. The symbol should match the symbol on the JSDesktop MarketColor Grid.
8. Click OK
- Note: You can right click on the chart tab and select DUPLICATE CHART. This will create a chart with the identical settings. To create additional market hit F5 to open the CHART SETTINGS menu and edit the SYMBOL of your choice. Save and then HIT F6 to open the STUDIES window and edit the JS SYMBOL SETTINGS. After you have created all the charts you want by repeating this process save them in a CHARTBOOK.
DAILY REFRESH
When you open the CHARTBOOK each day the PriceMap levels may not be visable until you change a chart parameter like the chart TIME from 3min to 5min for example. An alternative is to OPEN the CHARTBOOK and then CLOSE the CHARTBOOK. Then when you OPEN it again all the levels should be displayed.
CUSTOMIZATION
The PriceMap levels and Market Metrics can be customized by right clicking the chart.
- Show Minor
- Show VAR
- Show AD
- Show MSD
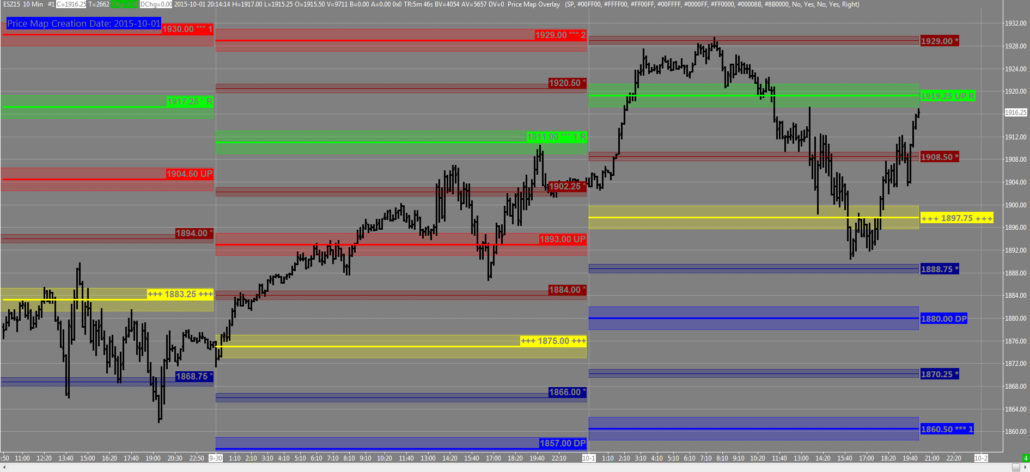
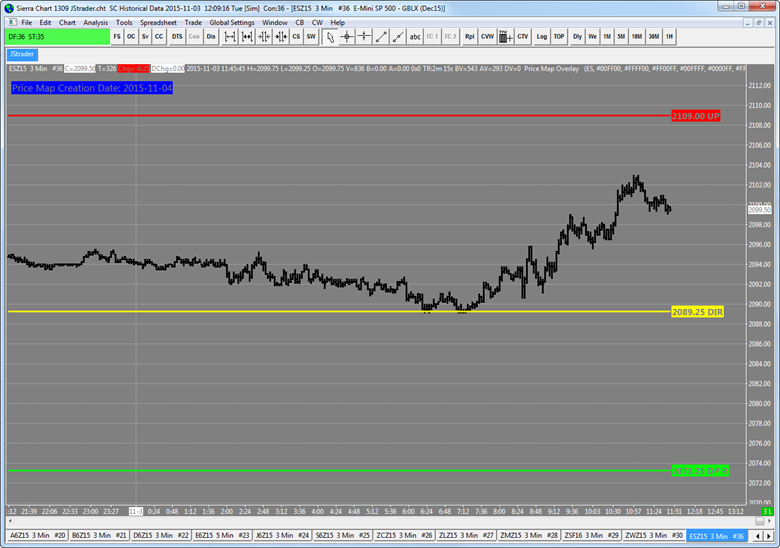
PriceMap BASIC VIEW
If no features are selected only the Major Price Map Levels (MPML) are displayed. This provides a nice broad overview of the key Market Structure PriceMap levels.
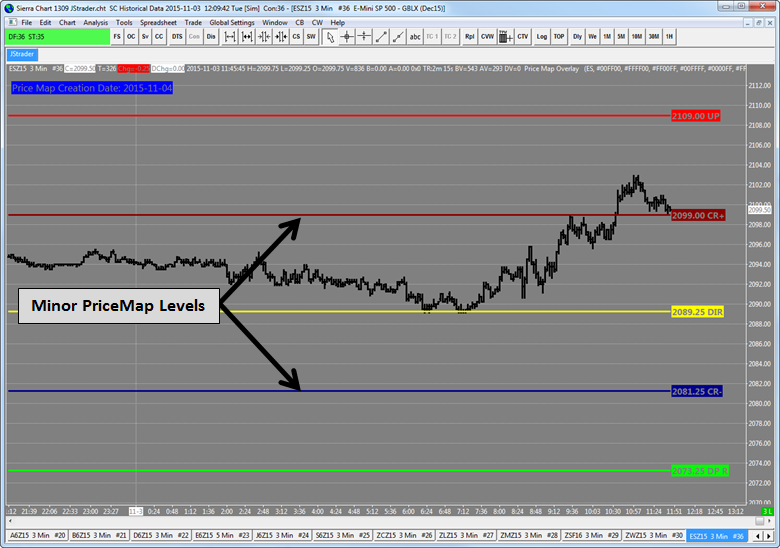
PriceMap FULL view
If the Show Minor Levels feature is selected the FULL PriceMap will be displayed.
MARKET METRICS
The Market Metrics identify the area of influence around a PriceMap level. Each metric has its own variance and meaning. These metrics are dynamically updated each day in accordance to the volatility expectation of the trade period.
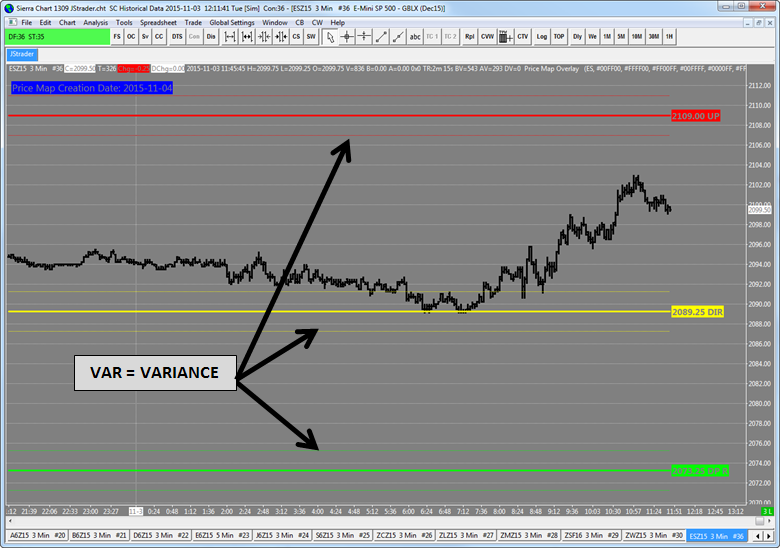
VARIANCE (VAR)
The VAR metric represents the optimal area to entry or exit the market. It also identifies the potential “slippage” area around a Major PricMap level.
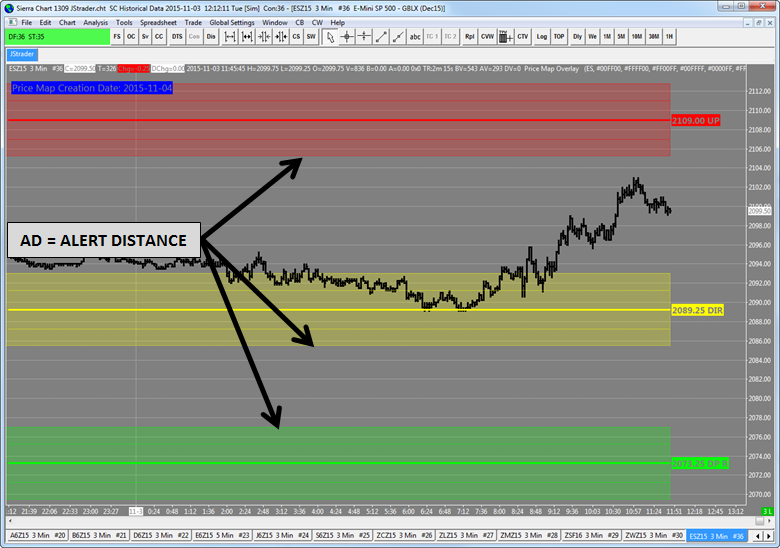
ALERT DISTANCE (AD)
The AD identifies the value area or sweet spot around a PriceMap level. This is the distance that defines the zone that most profitable trades will occur within. In addition it is a good metric to identify when market price is “through” a level.
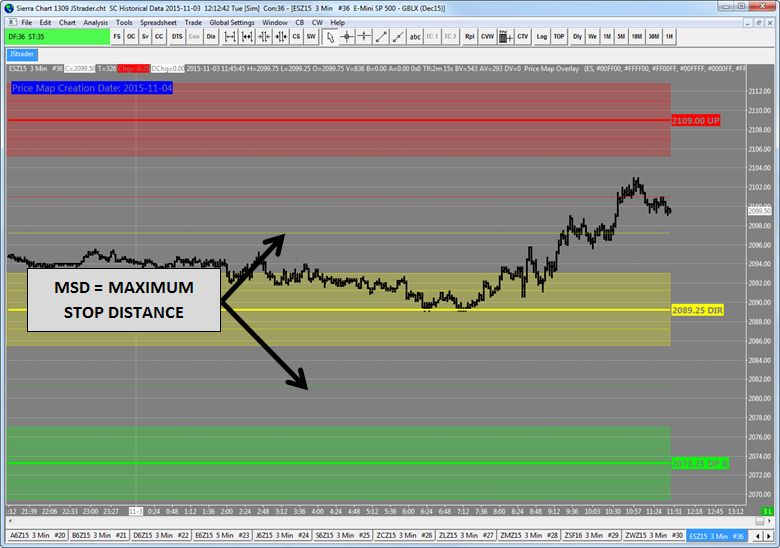
MAXIMUM STOP DISTANCE (MSD)
The MSD is the maximum distance for any influence a PriceMap level with have and confirmation that the level has been violated.
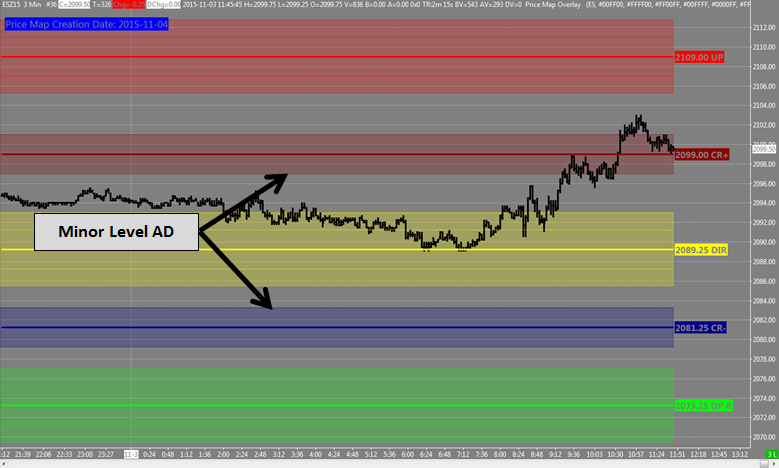
PriceMap Market Metric FULL VIEW
In the FULL VIEW the Minor PriceMap levels will only have the AD displayed. There are no VAR or MSD metrics for the Minor PriceMap levels.
Additional Features
The default setting displays the current trading session PriceMap data. Up to 3 days’ worth of data can be requested by adding the following parameter to the Integration script : -dateRange=3. Below is an example that will grab 3 days’ worth of JSData. 3 is the maximum number of days that can be displayed. This may slow the daily retrieval down slightly.
Script Example:
-outputView=11 -outputStyle=5 -outputType=xml -outputFilename=”js_data” -outputDirectory=”C:\SierraChart\Data” -dateRange=3 -overwrite –indent