
Application Integration Jigsaw Trading
![]()
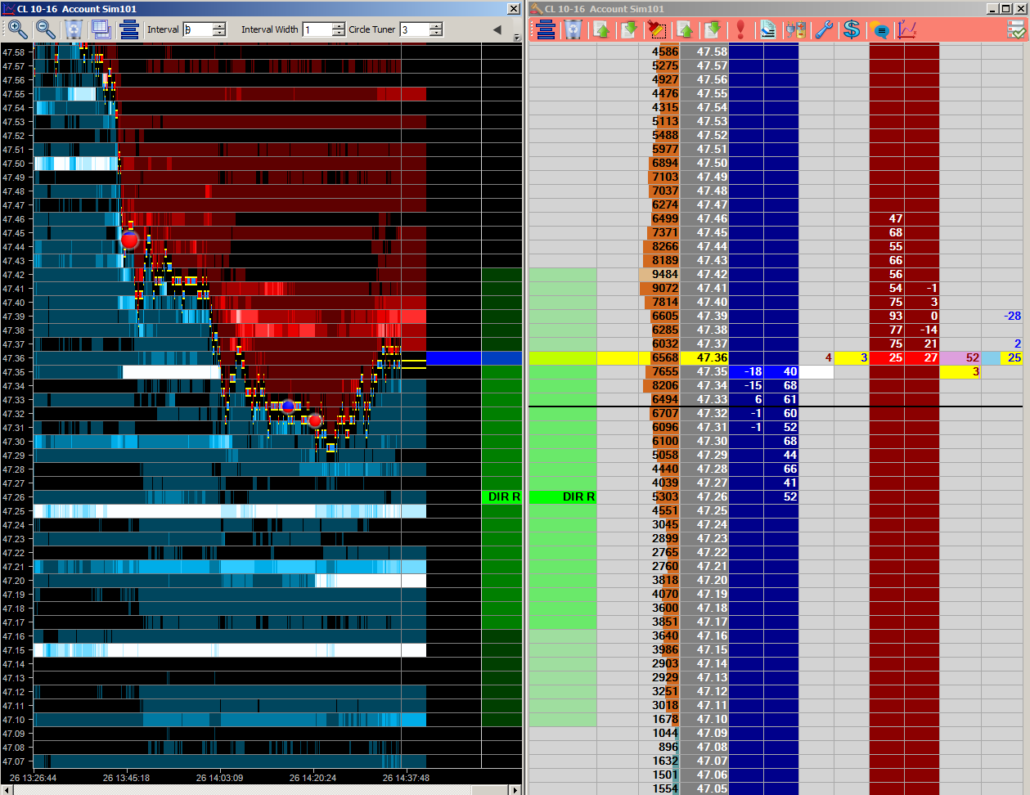
The Jigsaw Trading integration works with the JSDesktop so that the PriceMap Framework and Market Metrics are visible on both the Depth & Sales and Auction Vista.
STEP 1
Be sure you are running Jigsaw Trading version 5.4 or higher.
STEP 2
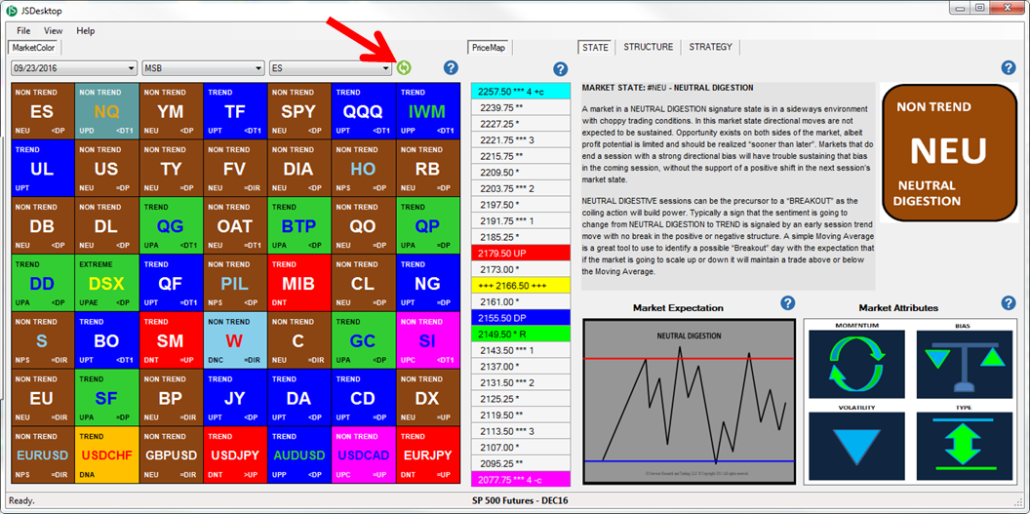
Open the JS Desktop application, which will automatically create a file with the PriceMap levels for that day. The REFRESH button can be used to request an update.
STEP 3
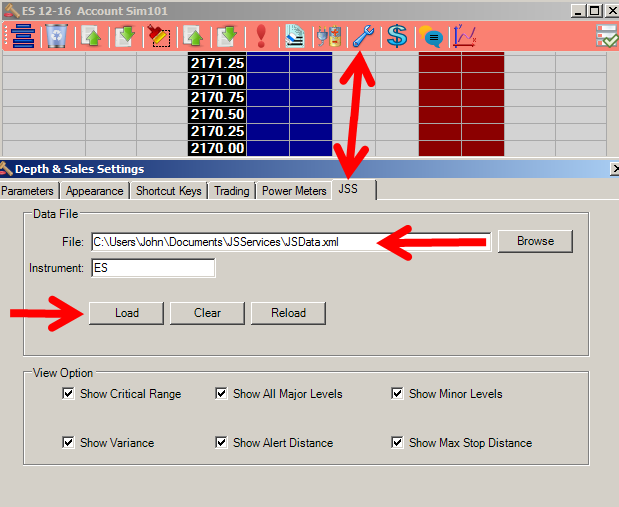
- OPEN the Jigsaw TOOLS Depth & Sales Settings window and select the JSS tab.
- The DATA FILE path should be set to your C:\Users\???\Documents\JSServices\ directory with the \JSData.xml file extension that you want to LOAD
- Select LOAD to import JSData into Jigsaw
STEP 4
The JSS Tab defines the different options for JS Services Jigsaw Integration.

• Data File – The location of the data file produced by the JSDesktop Tool. By Default this is the (My) C:\Users\???\Documents\JSServices\JSData.xml Documents\JSServices\JSData.xml
• Instrument – The Jigsaw Depth & Sales Settings Instrument id defaults to the first 2 characters of the platform instrument id. The Instrument id must match the JS Symbol from the JSDesktop Market Grid. If it does not, then change the Instrument to the JS Symbol. For example IF ZN is entered in the Instrument box for the 10yr T-NOTE futures THEN change it to the JS Symbol TY to view the Price Map levels for the 10yr T-Note.
• Load – Click the LOAD button to update the levels each day. The data is loaded from the JSDesktop which will automatically update if left open. Note the Desktop date to confirm it is current. If not then refresh the JS Desktop so it has the correct Date and then click LOAD in the JSS integration setting to update JIGSAW.
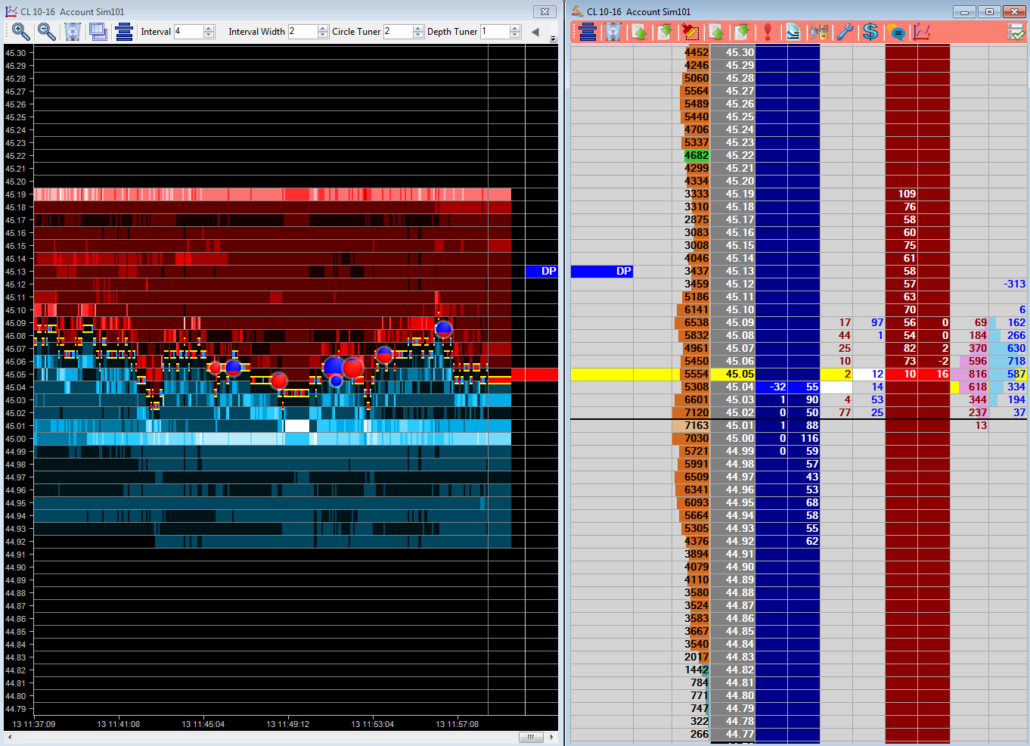
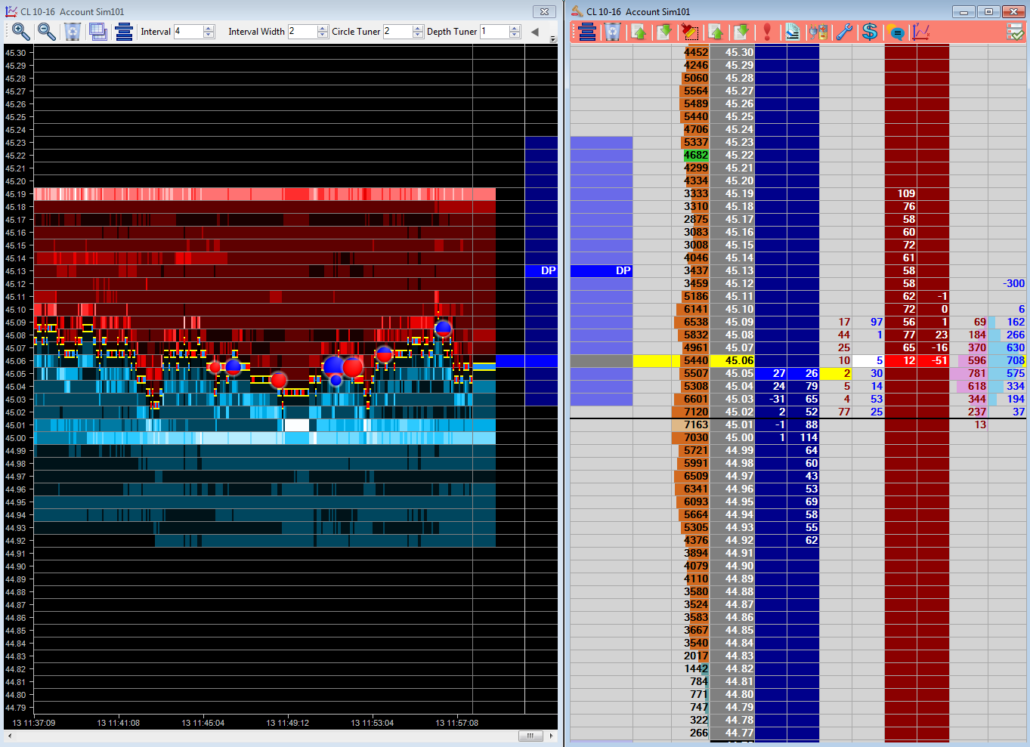
View Options– Allow you to customize the JSServices PriceMap levels to be displayed.
o Show CriticalRange – Check if you want to display CriticalRange
o Show All Major Levels – Check if you want to display all Major PriceMap Levels
o Show All Minor Levels – Check if you want to display all Minor PriceMap Levels
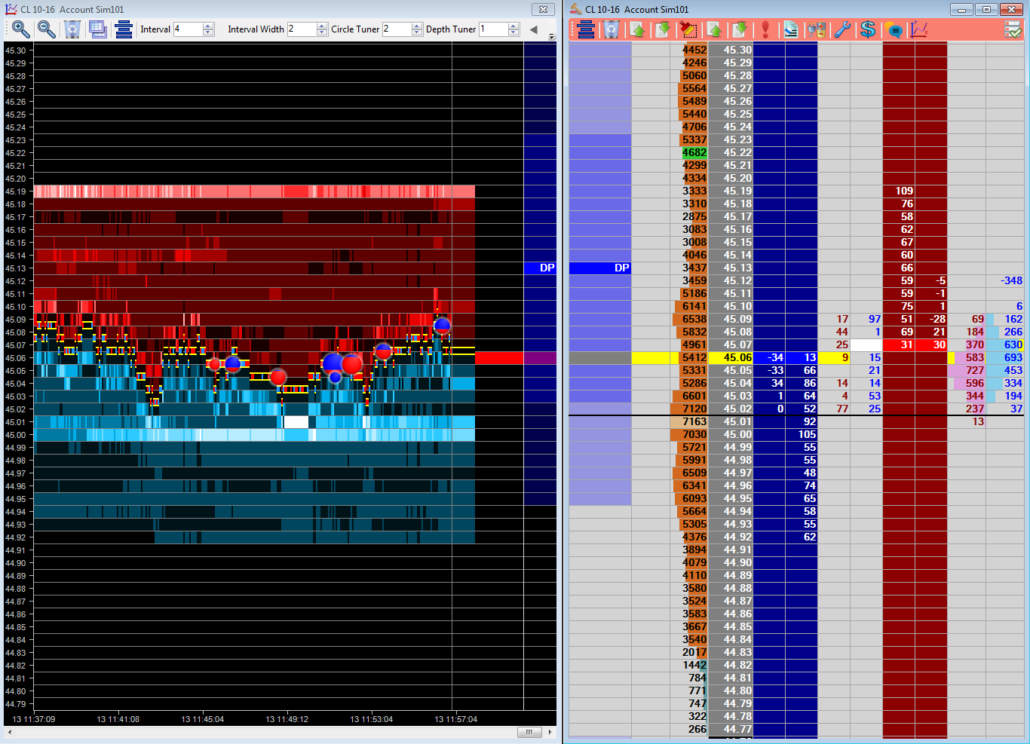
o Show VAR – Check if you want to display the Variance around the level
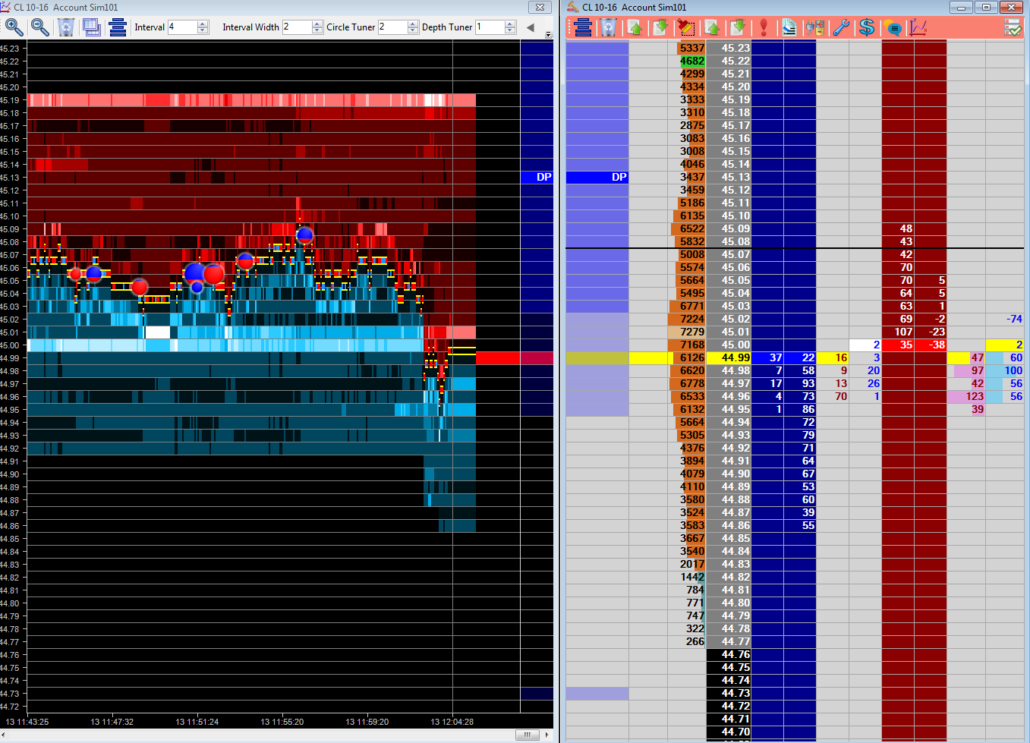
o Show AD – Check if you want to display the Alert Distance around the level
o Show MSD – Check if you want to display the Maximum Stop Distance level
Examples:
Show CriticalRange, all Major Levels and Minor levels
Show VAR
Show AD
Show MSD
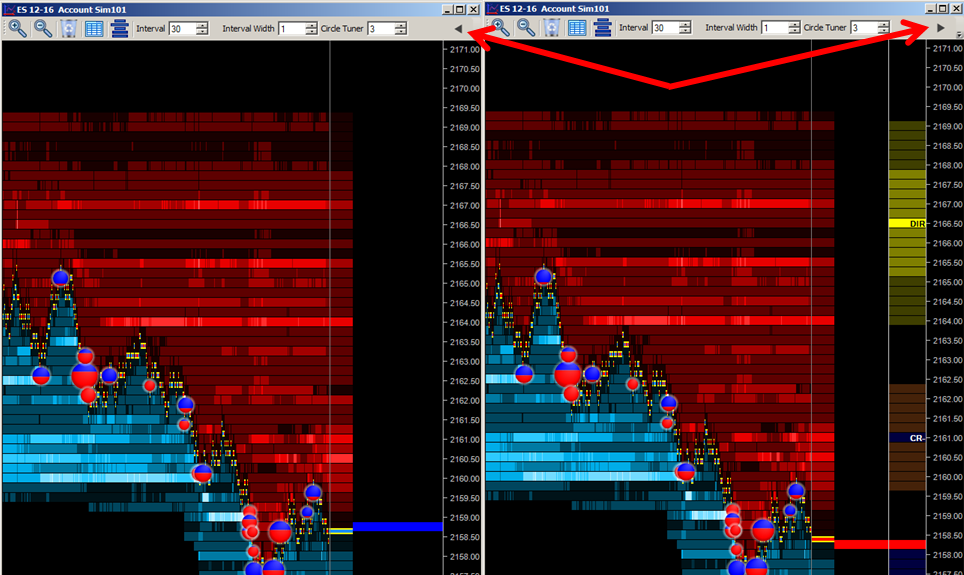
Note: Use the open arrow key to show and hide the PriceMap levels on the Auction Vista.
Web Videos
Daily Recap CL Example with Jigsaw Integration set-up
Strategy Recap: ES Example with Jigsaw Part 1
Strategy Recap: ES Example Part 2
Strategy Recap: ES Example Part 3
Webinar
Optimizing Trade Tactics Jigsaw Webinar http://www.jigsawtrading.com/auction-vista/optimize-trading-tactics-to-make-them-more-effective/?mc_cid=e69e9cca58&mc_eid=30deff3432


