

The JSSheet generated by the JSDesktop can be used to integrate the PriceMap levels into Trading Technologies X_Study chart. The following are a few procedures to follow to create dynamic linking using the JSSheet.xls file.
STEP 1. Open JSSheet.xlsx
The JSSheet.xls file should always be opened 1st prior to launching X_Trader.
STEP 2. Open X_Trader
Open X_Trader and launch all charts and MD_Trader ladders that you want to create laser-lines in.
X_Study Chart Linking
STEP 1. Copy Cells
Highlight the cells you want to link by clicking on a cell and dragging the mouse over the range of cells you want to copy. It is recommended that you only copy 10 cells at a time.
STEP 2. Paste Cells
Right click on the X_Study chart you want to link to and select paste. Repeat STEP1 and 2 until all the PriceMap levels are displayed.
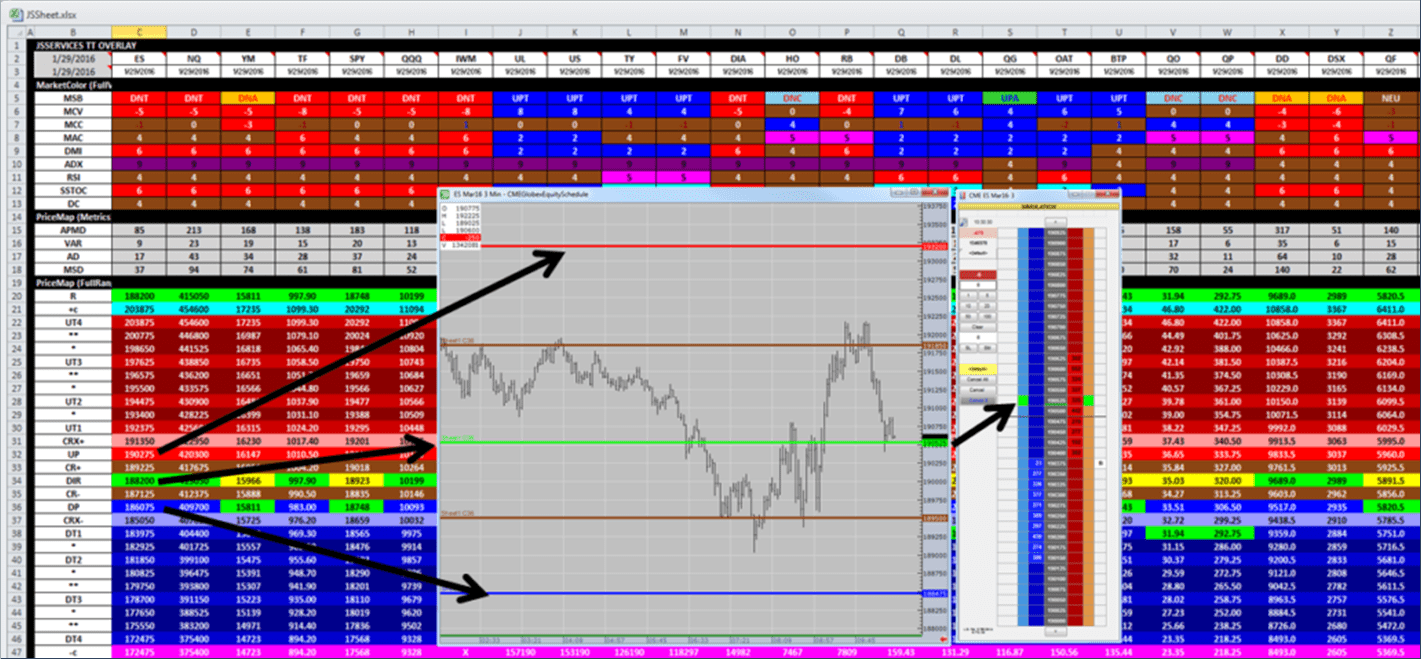
STEP 3. Modify Chart Levels
Right click on a PriceMap level on the X_Study chart to modify the line thickness. It is recommended to use the following settings:
- R-LEVEL = 4pts
- UP | DP = 3pts
- DIR | UT | DT = 2pts
- All other levels = 1pt
MD_Trader Linking
STEP 1. Configure MD_Trader
Configure the MD_Trader so the indicator column is displayed.
STEP 2. Copy Cells
Highlight the cell you want to link by clicking on a cell and dragging the mouse over the range of cells you want to copy. It is recommended that you only copy 10 cells at a time.
