GOLD Risk Structure APR 2017
![]()
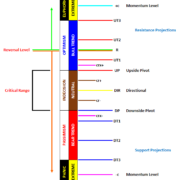
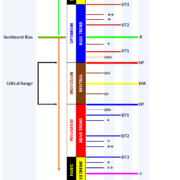
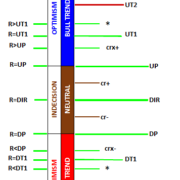
Risk Structure outlines the context of the current risk environment based on the markets position within the PriceMap MARKET STRUCTURE framework. Click here to learn more about using risk and market structure to create a systematic approach to managing risk and fear.
The example below assumes a net long position with a RISK ON posture signaling a negative price expectation and a RISK OFF posture a positive price expectation. The current Risk Structure for Gold has the sentiment bias (R-LEVEL) equal to the CriticalRange mid-point.
Example – GOLD APRIL 2017
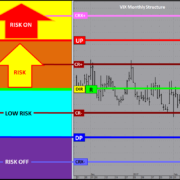
R-LEVEL = 1246.4 | UP (Upside Pivot) = 1290.7 | DP (Downside Pivot) = 1208.6
The image below identifies GOLD is basically “at Risk” which is defined by the 1246.4 R-LEVEL. If the market is going to transition higher it will maintain a trade above this price point and stay in a “LOW RISK” posture in terms of a long position, up to the 1290.7 UP (Upside Pivot). At this point the market will be at a point of equilibrium in terms of committing to a new “up trend” and a RISK OFF posture or maintaining a position of LOW RISK.
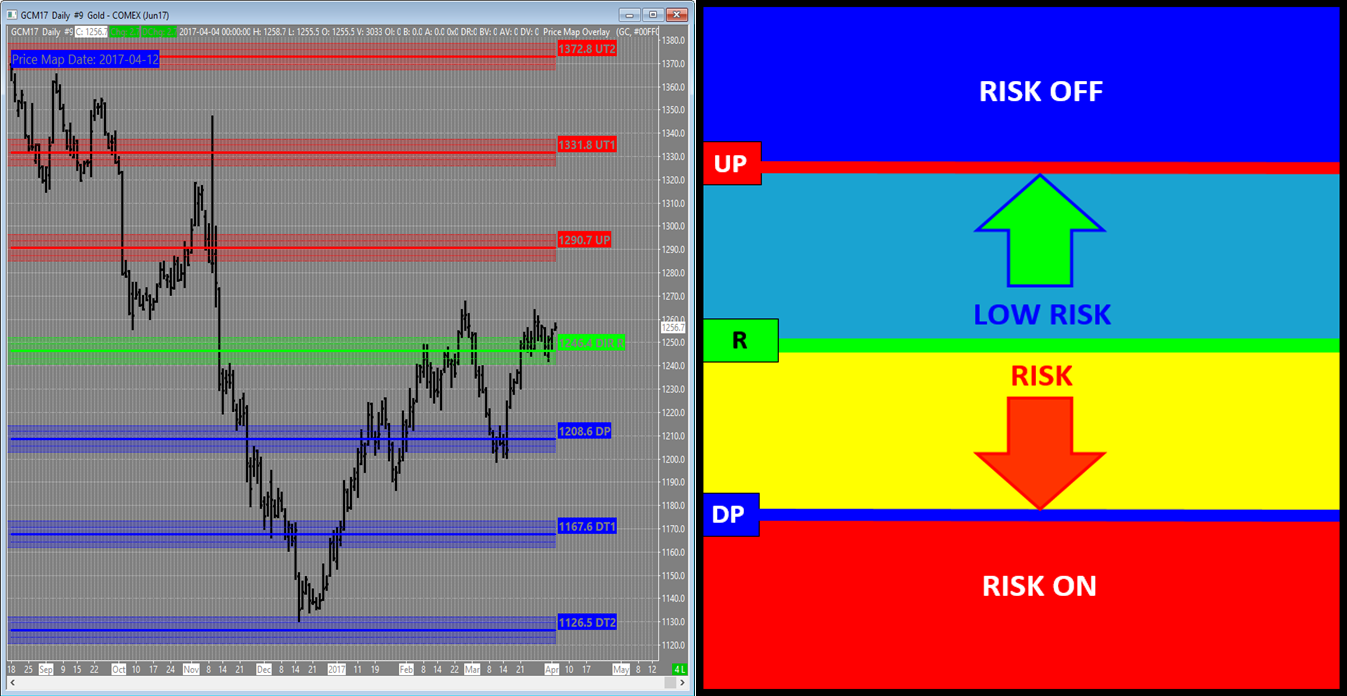
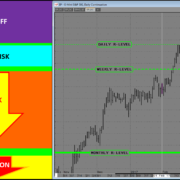
Daily GOLD May17 Chart with Monthly PriceMap
Hedge Strategy Example (Net Long Position)
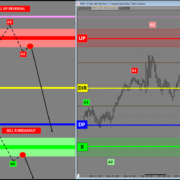
If GOLD is trading at the 1290.7 UP, a net long position has a profit give-back risk of around $35. This as this is the amount of profit that will be lost with a trade back down to the 1246.4 R-LEVEL which is a “normal” reaction that can be anticipated for this structure bias if the positive trend is not ready to commit. A Hedge Strategy can be implemented to reduce this risk, specifically a SELL UP FADE Hedge Strategy. IF the market price action is going to be contained within market structure THEN it will reject “in front” of the 1290.7 UP. A SELL UP FADE execution tactic can be used to protect unrealized profits with an objective of taking off the hedge at the 1246.4 R-LEVEL.
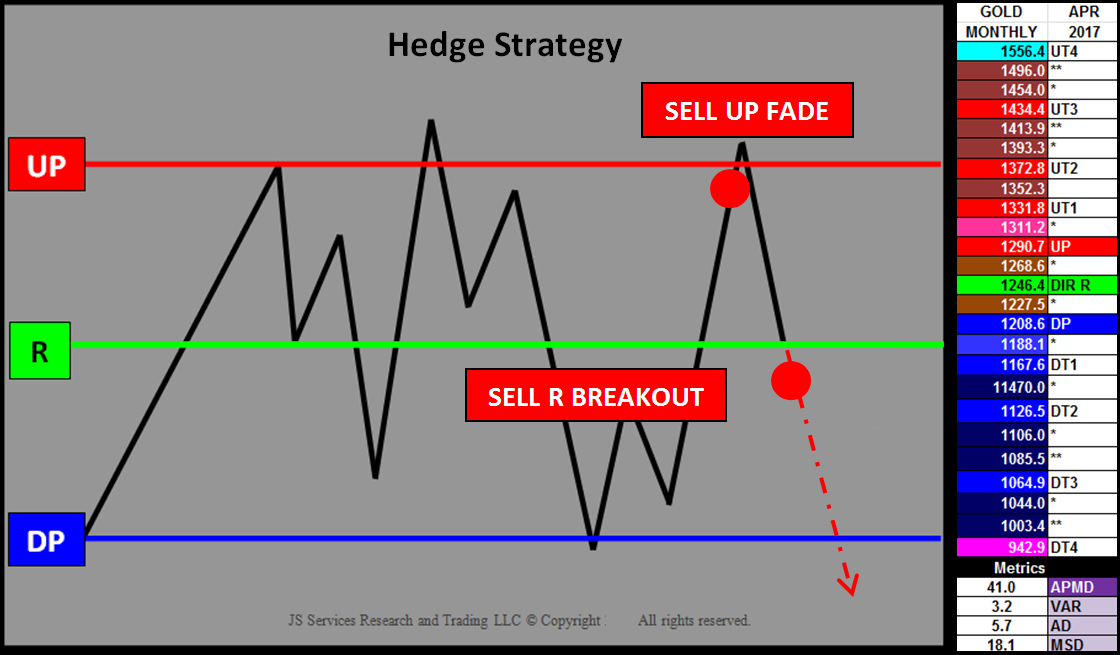 Hedge Strategy and GOLD Monthly April 2017 PriceMap
In addition to the protecting profits the Risk Structure also identifies where a hedge should be applied to protect losses. In the Hedge Strategy image above a SELL R BREAKOUT tactic can be implemented below the 1246.4. The 5.7 AD (Alert Distance) Metric can be used to confirm a “Breakout” signal (1246.4-5.7=1240.7) or a break under 1240.7, with the expectation that the market will shift into a RISK position down to the 1208.6 DP (Downside Pivot). Here again the market will be in a state of equilibrium, where it will either stabilize for a rally back up to the R-LEVEL sentiment bias or break structure and transition into a RISK ON Hedge position and potentially new Bear Trend targeting the 1126.5 DT2 (Downside Target#2).
Summary
Observing price action within Risk Structure provides clarity to the current condition and the value of an opportunity so proper risk management can be applied. Knowing where you are at risk is imperative to maintain a “fearless” focus by having the awareness of what RISK theme is currently dominating price action. The May17 Gold contract is currently trading near its 1246.7 R-LEVEL which is the sentiment bias for April 2017. Knowing this fact allows you to anticipate opportunity and implement hedge strategies.
Please send inquiries to info@jsservices.com.

