GOLD Risk Structure APR 2017

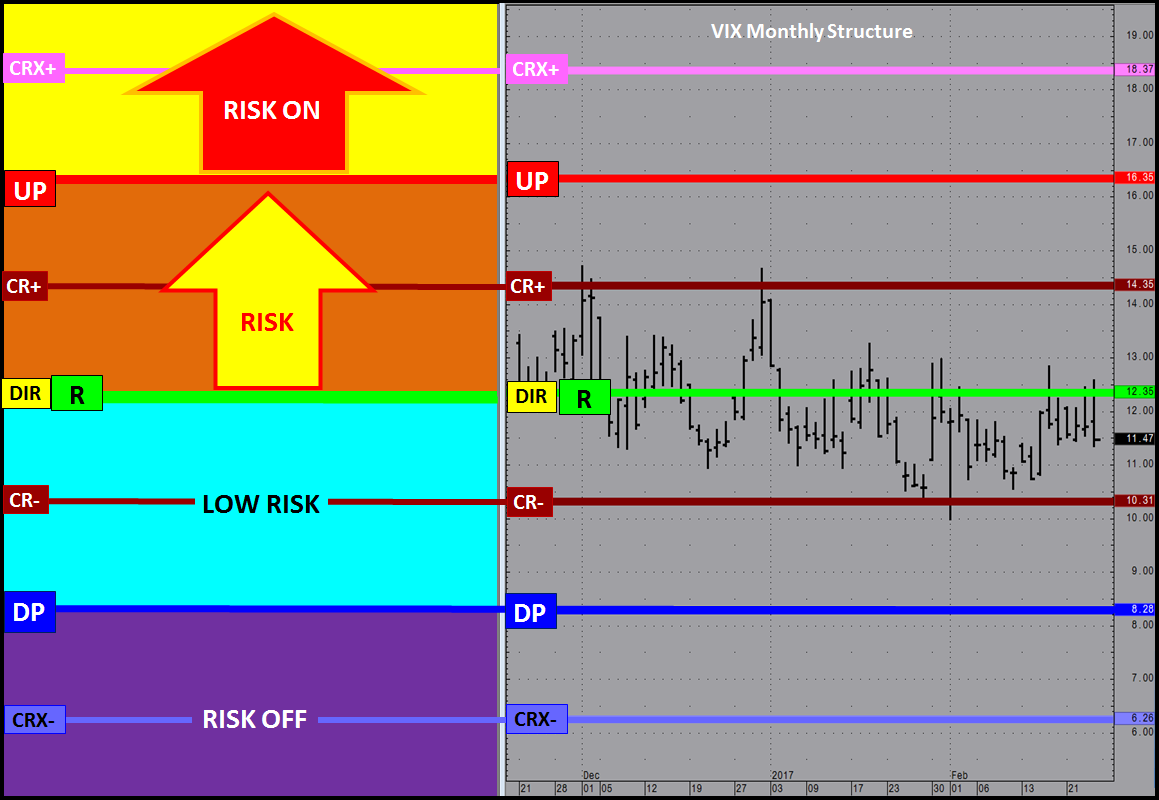
Risk Structure outlines the context of the current risk environment based on the markets position within the PriceMap MARKET STRUCTURE framework. Click here to learn more about using risk and market structure to create a systematic approach to managing risk and fear.

The example below assumes a net long position with a RISK ON posture signaling a negative price expectation and a RISK OFF posture a positive price expectation. The current Risk Structure for Gold has the sentiment bias (R-LEVEL) equal to the CriticalRange mid-point.

Example – GOLD APRIL 2017

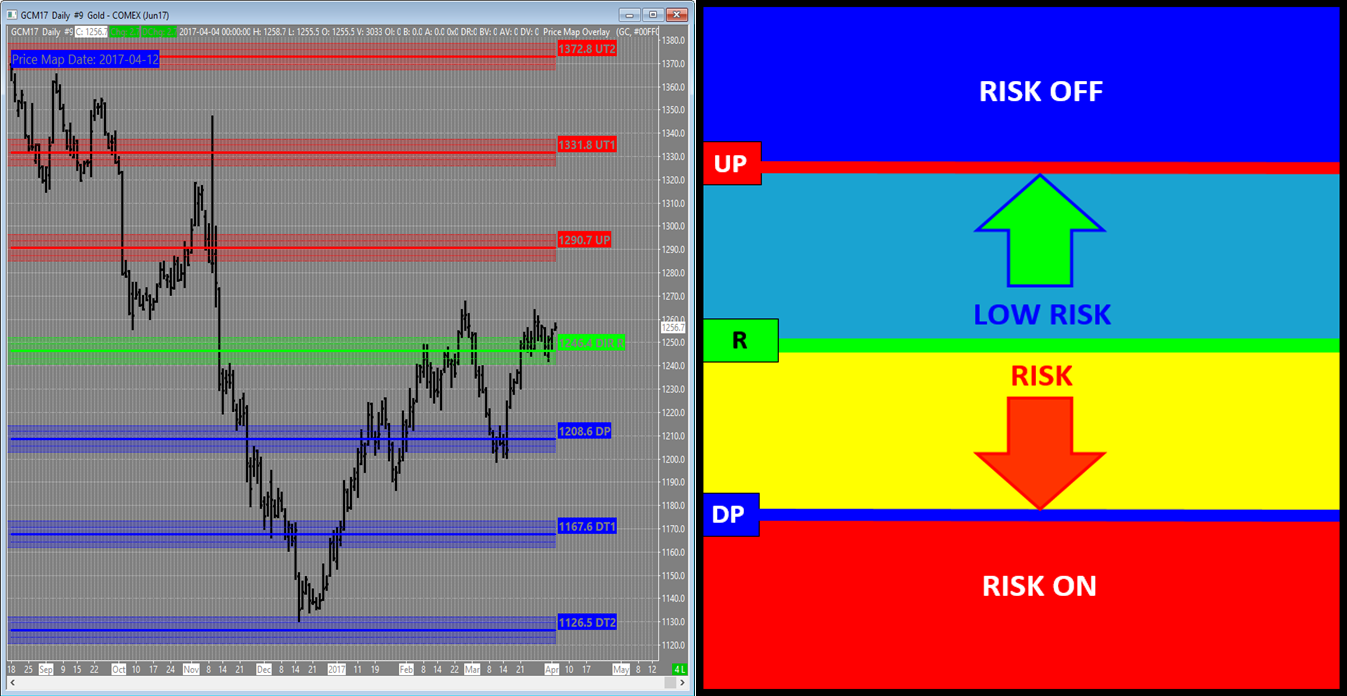
R-LEVEL = 1246.4 | UP (Upside Pivot) = 1290.7  |  DP (Downside Pivot) = 1208.6

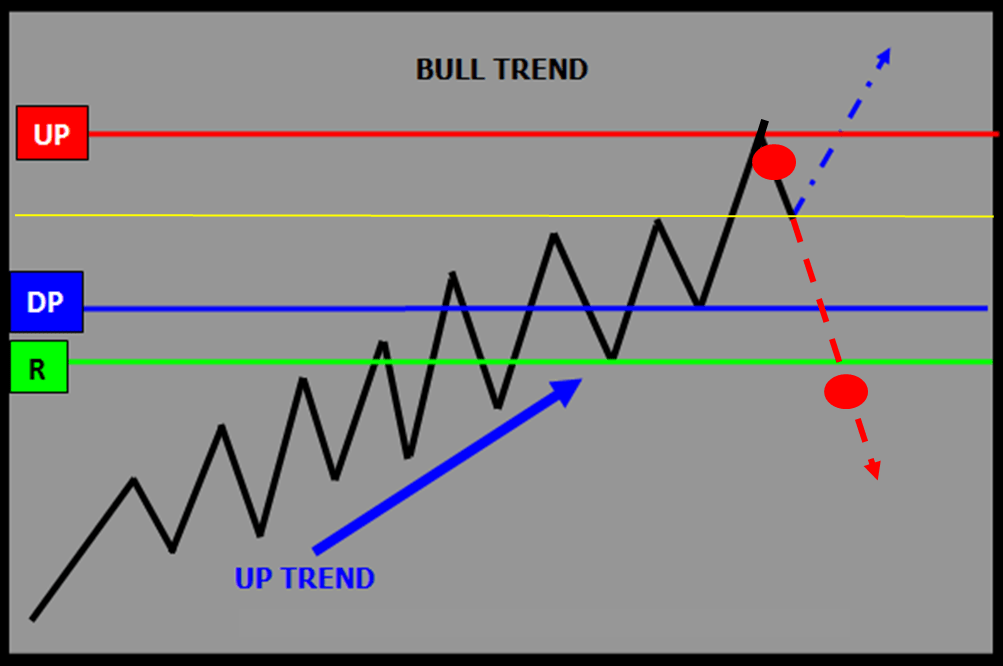
The image below identifies GOLD is basically “at Risk” which is defined by the 1246.4 R-LEVEL. If the market is going to transition higher it will maintain a trade above this price point and stay in a “LOW RISK” posture in terms of a long position, up to the 1290.7 UP (Upside Pivot). At this point the market will be at a point of equilibrium in terms of committing to a new “up trend” and a RISK OFF posture or maintaining a position of LOW RISK.

Daily GOLD May17 Chart with Monthly PriceMap

Hedge Strategy Example (Net Long Position)

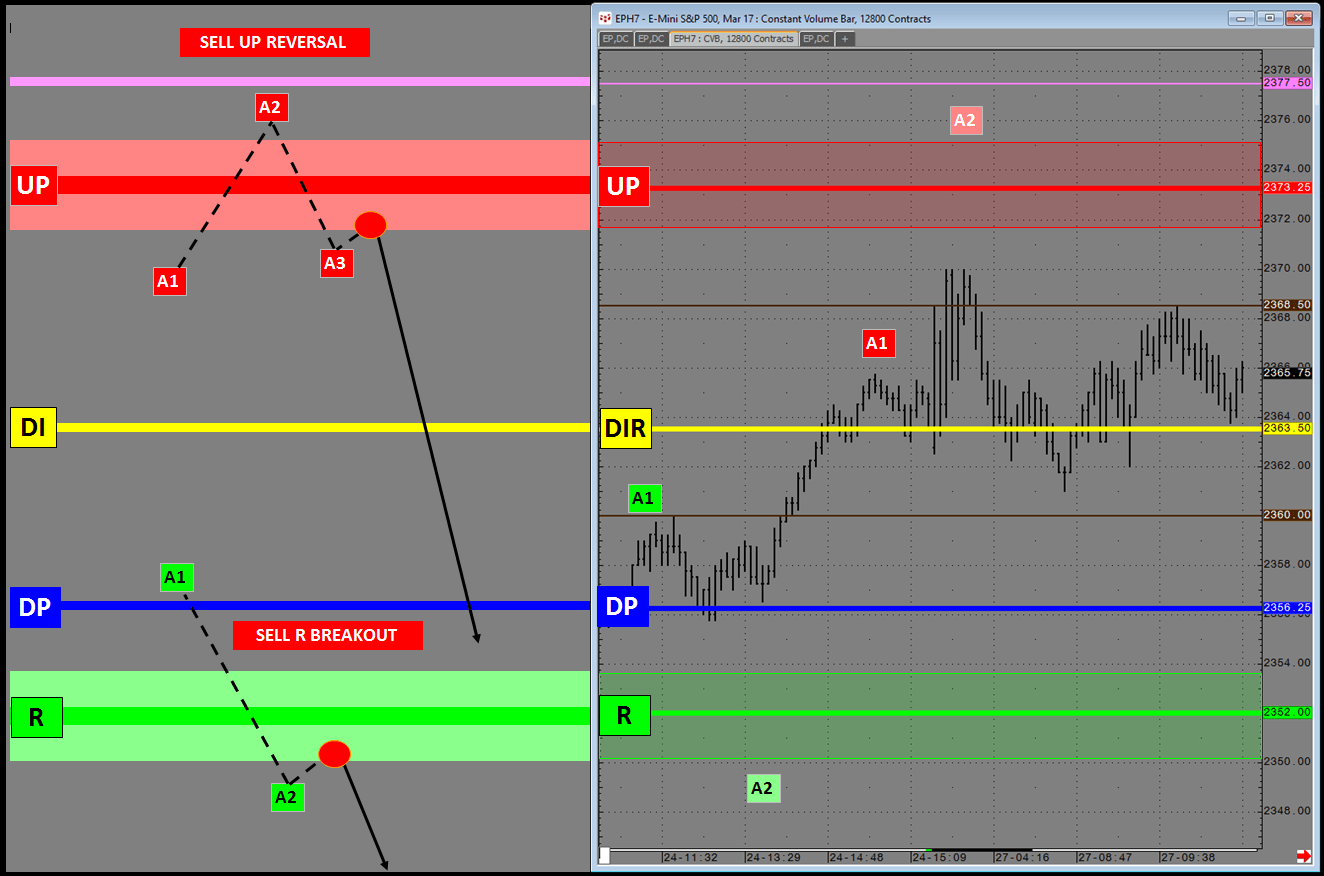
If GOLD is trading at the 1290.7 UP, a net long position has a profit give-back risk of around $35. This as this is the amount of profit that will be lost with a trade back down to the 1246.4 R-LEVEL which is a “normal” reaction that can be anticipated for this structure bias if the positive trend is not ready to commit. A Hedge Strategy can be implemented to reduce this risk, specifically a SELL UP FADE Hedge Strategy. IF the market price action is going to be contained within market structure THEN it will reject “in front” of the 1290.7 UP. A SELL UP FADE execution tactic can be used to protect unrealized profits with an objective of taking off the hedge at the 1246.4 R-LEVEL.

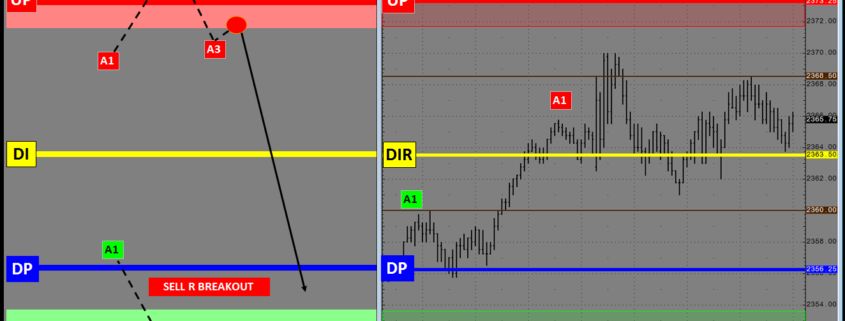
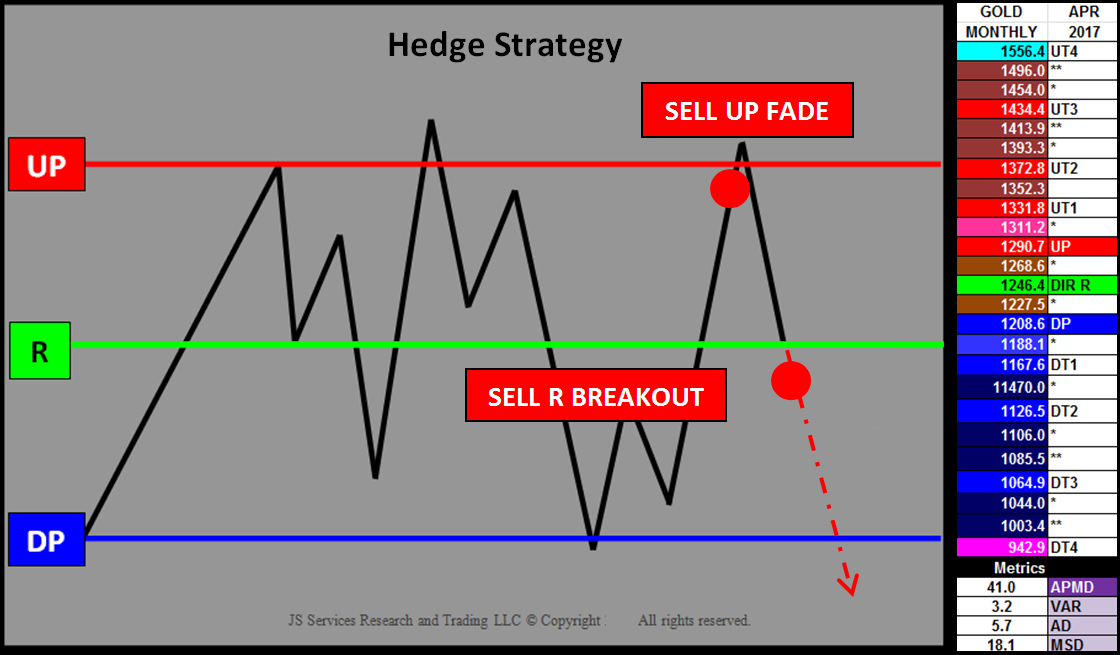
Hedge Strategy and GOLD Monthly April 2017 PriceMap

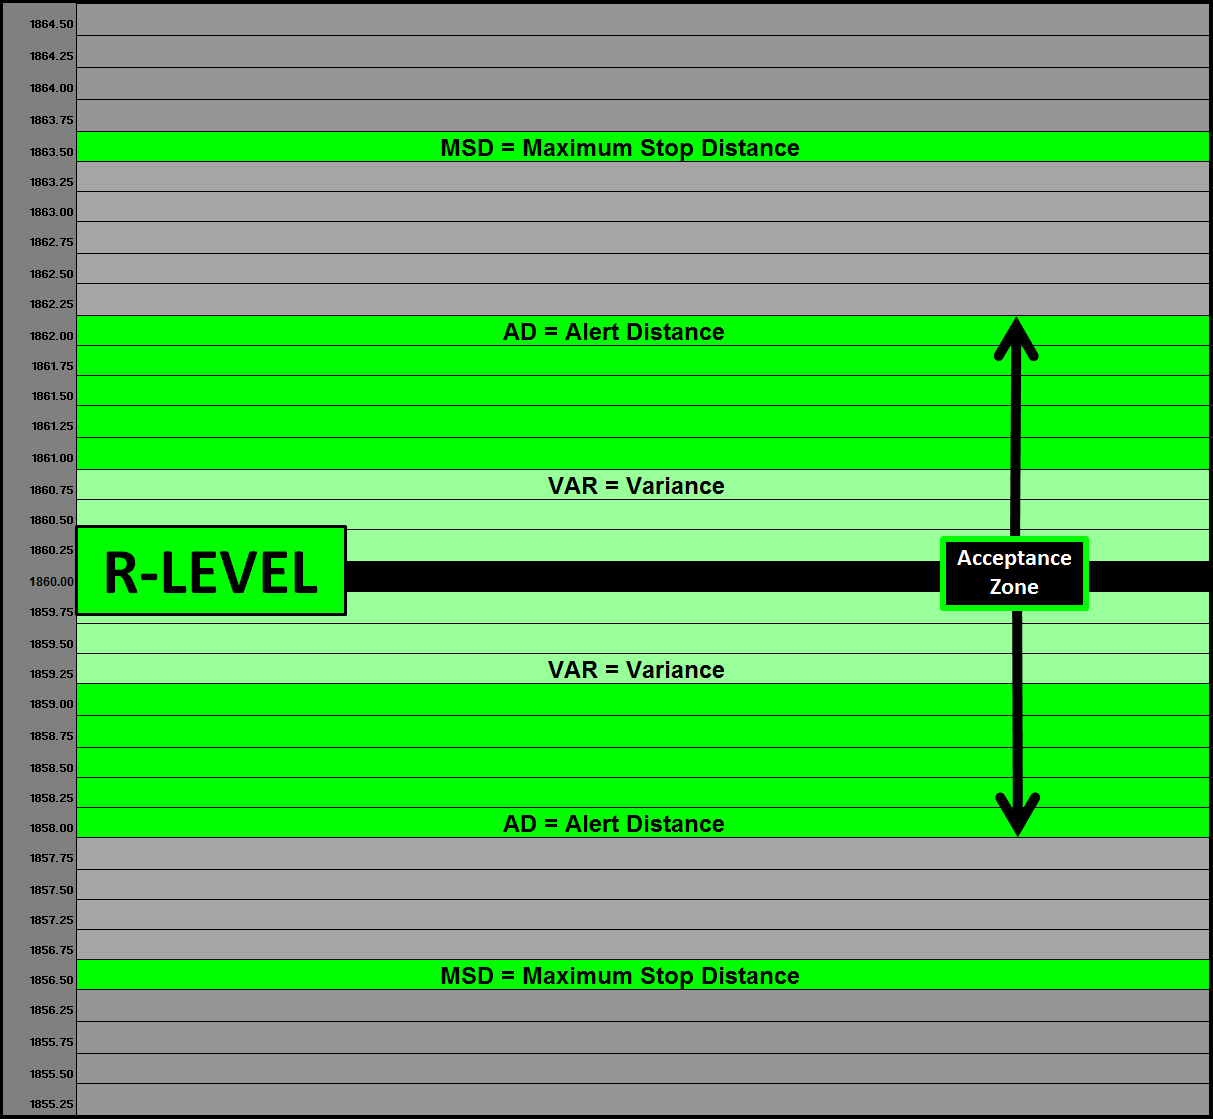
In addition to the protecting profits the Risk Structure also identifies where a hedge should be applied to protect losses. In the Hedge Strategy image above a SELL R BREAKOUT tactic can be implemented below the 1246.4. The 5.7 AD (Alert Distance) Metric can be used to confirm a “Breakout” signal (1246.4-5.7=1240.7) or a break under 1240.7, with the expectation that the market will shift into a RISK position down to the 1208.6 DP (Downside Pivot). Here again the market will be in a state of equilibrium, where it will either stabilize for a rally back up to the R-LEVEL sentiment bias or break structure and transition into a RISK ON Hedge position and potentially new Bear Trend targeting the 1126.5 DT2 (Downside Target#2).

Summary

Observing price action within Risk Structure provides clarity to the current condition and the value of an opportunity so proper risk management can be applied. Knowing where you are at risk is imperative to maintain a “fearless” focus by having the awareness of what RISK theme is currently dominating price action. The May17 Gold contract is currently trading near its 1246.7 R-LEVEL which is the sentiment bias for April 2017. Knowing this fact allows you to anticipate opportunity and implement hedge strategies.


Please send inquiries to info@jsservices.com.


Hedge Strategy Overlay Example

JSServices Playbook Analytics identify the inherent strategy themes and specific trade opportunities within the dynamics of the current condition as expressed by the state and structure dynamics. This context provides guidance of “what” to do and “where” to do it by highlighting the Hedge Strategy themes that are anticipated to dominate price action if a market breaks structure and transitions into a new risk state. The PlayBook analytics identify specific PriceMap action qualifiers, specifically the R LEVEL and CriticalRange boundaries (UP “Upside Pivot” and DP “Downside Pivot”) that should be used to standardized trade entry techniques to form the basis of an actionable trade strategy.

HEDGE STRATEGY

SELL UP REVERSAL SELL R BREAKOUT

The example above highlights 2 entry tactics for this structure bias, a SELL UP REVERSAL, which can be used to reduce profit-giveback and a SELL R BREAKOUT to mitigate downside risk from a shift in sentiment.

Risk Parameters

The PlayBook Tactics suggest the specific trading techniques that should be used to capture the most favorable risk/reward opportunities within each Strategy Theme. Each Tactic provides the best entry and exit technique and its optimal price level. The very specific nature of the PlayBook Tactics makes them ideal as the basis for a systematic approach to trading or an automated trading system.

The Risk Parameter Market Metrics are used to identify the optimal entry level and the surrounding acceptance zone in which an opportunity remains valid when executing a specific trade tactic. The Market Metric boundaries offer a unified approach to optimized entry and exit tactics across all markets and asset classes.

RISK PARAMETERS

R-LEVEL Market Metrics VAR, AD, MSD

Hedge Strategy Overlay Example

A net long stock position that has a high correlation to the SP500 has 2 basic risks associated with it. Downside Failure Risk and Profit Give-back Risk. The diagram below provides a real-world example of how the trade entry techniques and risk parameters are used to protect downside failure and profit give-back risk.

HEDGE STRATEGY

PlayBook Entry Tactics                                                            SP500 E-Mini with Market Metrics

PROFIT GIVEBACK RISK

TACTICSELL UP REVERSAL –The SELL UP REVERSAL is designed to reduce profit-giveback by selling the market after an “exhaustive” reversal signal. In the example, conditional A1 (Alert 1) has been met but not A2 (Alert 2) or A3. For the REVERSAL to be “true” each condition must be met 1st to then trigger the SELL UP REVERSAL at which time SELL orders can be placed in the acceptance zone.

DOWNSIDE FAILURE RISK

TACTICSELL R BREAKOUT – TACTIC – The SELL R BREAKOUT is used to reduce downside risk by selling the market after negative shift in sentiment. In this example it would be anticipating a broader “corrective” expectation following a Daily sentiment shift targeting the Weekly R LEVEL. In the example, conditional A1 (Alert 1) has been met but not A2 (Alert 2). For the BREAKOUT to be “true” each condition must be met 1st to then trigger the SELL R BREAKOUT at which time SELL orders can be placed in the acceptance zone.

Summary

JSAnalytics provide a systematic approach to create risk defined trades as the basis for a Hedge Strategy Overlay which can reduce risk and profit give-back with defined tactics.

Click here to request a consultation on how JSServices can provide your trading program with a new edge.


Risk Structure

RISK STRUCTURE

Volatility Indices are used to identify the underlying risk condition or STATE a market is currently in. The PriceMap sentiment bias or R LEVEL for the underlying security or futures contract defines the RISK STRUCTURE of the RISK STATE.  Observing price action of the underlying security or futures contract, within the RISK STRUCTURE, in the context of the VIX RISK STATE provides awareness to markets vulnerabilities.

Example

The image below shows the Monthly, Weekly and Daily R LEVEL sentiment bias for the SP500 E-Mini.   In general: Trading above the R LEVEL is positive and below negative. Observing the differential between the current price and the R LEVEL provides insight to its influence as either a repellent when near or attraction when far away. The influence is also determined by the time frame of the structure. The available time frames are Monthly, Weekly and Daily which outline the RISK STRUCTURE of the market.

UNDERLYING RISK STUCTURE

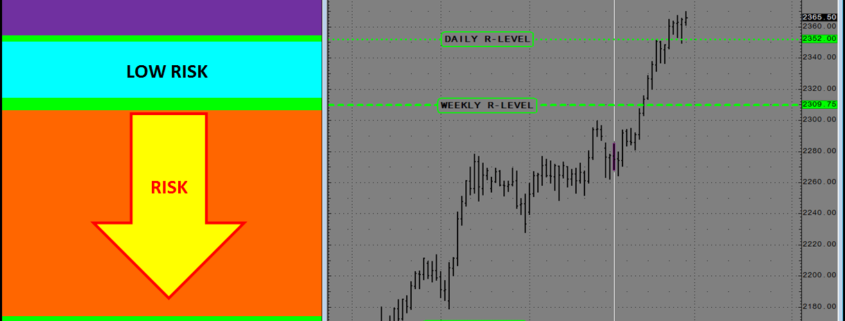
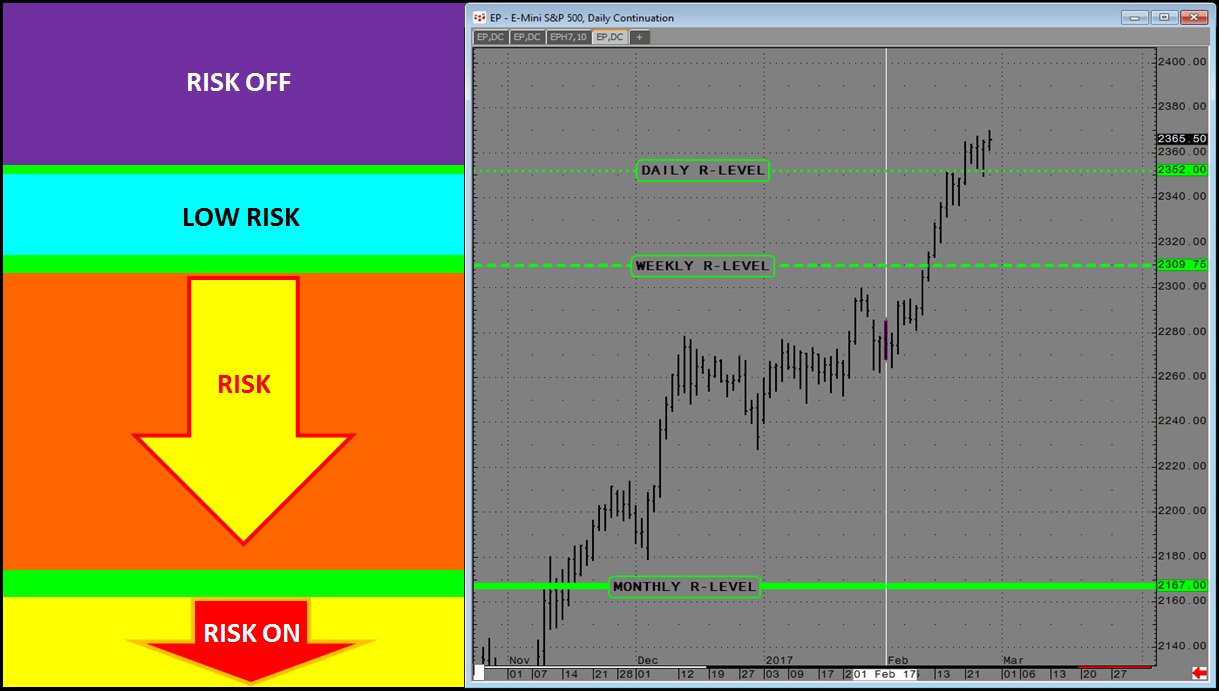
Daily, Weekly, Monthly R-LEVEL Risk Structure

In the example above the ES futures market price is above the Monthly, Weekly and Daily R-LEVEL, identifying RISK OFF structure. Confluence of this fact with the RISK STATE of the underlying VIX provide clarity to the real vulnerabilities of the market. The example below shows that the VIX is below its Monthly R LEVEL. The Monthly time frame being the highest value in terms of market influence. As long as the VIX is below the 12.35 DIR (DIRECTIONAL) R LEVEL, volatility is in a RISK OFF position. Combining this with the fact that the ES futures are trading above all 3 sentiment bias time frames puts the current rally in a strong position with supporting volatility expectations.

The CBOE (Chicago Board of Options Exchange) and the CFE (Chicago Futures Exchange) has expanded coverage of volatility indices or VIX into grains, currencies, crude oil and interest rates along with sector ETFs and individual stocks. Knowing the fact associated with a markets RISK STATE and STRUCTURE  improves awareness and offers an indicator of confluence to standardize trading tactics into a more structured approach.

For more information Click HERE.


Risk State

RISK STATE

Hedging is about managing risk which can be defined in term of volatility. Volatility Indices identify the RISK STATE or condition of the underlying security or futures market. The price points at which the RISK STATE will change are identified in the RISK STRUCTURE of a markets associated VIX. The RISK STRUCTURE alignment can be used as the foundation framework to create a hedge strategy in the underlying security or futures market position to be hedged. This is done by observing the current price position in relation to the PriceMap R LEVEL within the PriceMap framework of a markets VIX.

R LEVEL

The R LEVEL is the dynamic point of equilibrium that defines the Sentiment Bias for the trade period. It is the price level where the bias shifts from positive to negative and vice versa. Where the R LEVEL is on the PriceMap framework determines the RISK STATE. In terms of a Volatility Index like the SP500 VIX the bias shift can be looked at as RISK ON /RISK OFF flip switch for the RISK STATE.

Example

The following is a Hedge Strategy Overlay example applying JSAnalytics to the SP500 VIX. The example shows how to identify the current risk condition and the specific action qualifiers that will trigger shifts in that condition along with the recommended strategy themes and tactics to construct a hedge to protect against an increase in volatility.

RISK STATE

$VIX RISK STATE

The image above shows the Monthly structure for the cash VIX Index which is in a LOW RISK condition below the R LEVEL. A move above the R LEVEL will change the state to a RISK position.  Knowing the FACTS of the RISK condition or State provides clarity, which can be used as the basis to construct a systematic approach to managing risk and constructing a Hedge Strategy.

The CBOE (Chicago Board of Options Exchange) and the CFE (Chicago Futures Exchange) has expanded coverage of volatility indices or VIX into grains, currencies, crude oil and interest rates along with sector ETFs and individual stocks. Knowing the fact associated with a markets RISK STATE improves awareness and offers an indicator of confluence to standardize trading tactics into a more structured approach.

For more information Click HERE.