MarketColor as the basis for a Structured Trading Approach
![]()
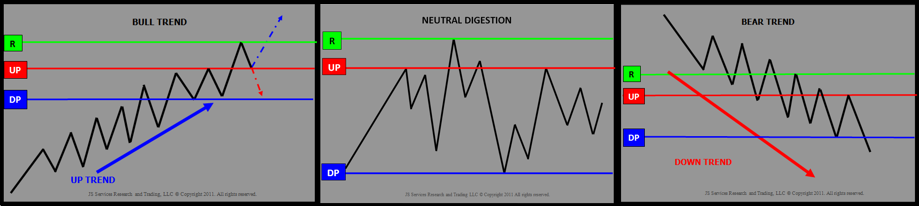
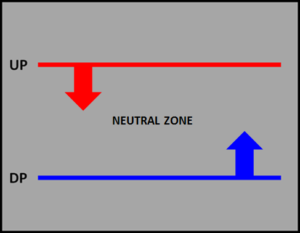
MarketColor defines the context of the current condition or market STATE. It is the underlying “technical” tone or environment for the trade period and should be used as the basis to standardize trading tactics and create a more structured trading approach.
Many traders get caught up in the moment and fail to account for the bigger picture or context in which the moments are occurring. Armed with a quiver of trading tactics, which they strive to execute consistently, they have little basis on how to value one opportunity from the next. As long as the signals are the same, they are the same signal and have the same value right? Wrong! The context in which the signal is occurring determines the value any a tactic signal has. By aligning trading tactics with complimentary market state condition traders are able to standardize their approach and create a value weighting system for their signals.
Trading is difficult and complex. Strategy and tactics must be unified and simplified if they are going to be part of a sustainable trade plan.
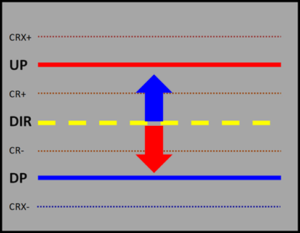
JSServices MarketColor analytics begins the simplification process by classifying conditions into unique market STATES. Each STATE has its own set of attributes which individually are the same as other STATEs but when combined with characteristics, produce a unique expectation for each STATE. Trading tactics can be standardized to these nuances to create a structured approach where the alignment to each market STATE determines the value of the opportuinity.
Practical Application
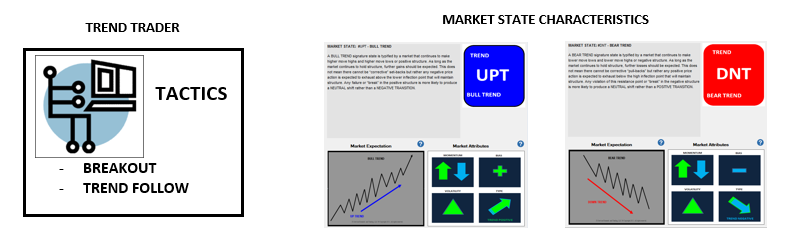
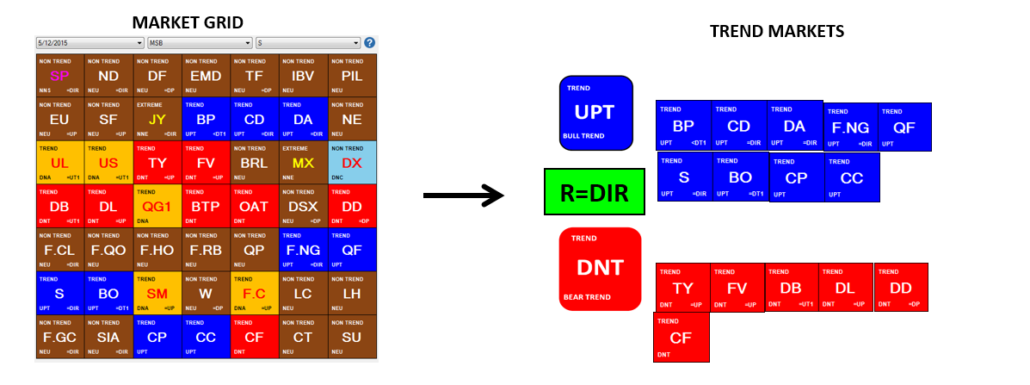
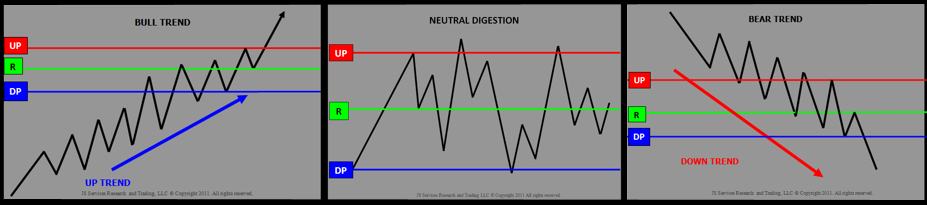
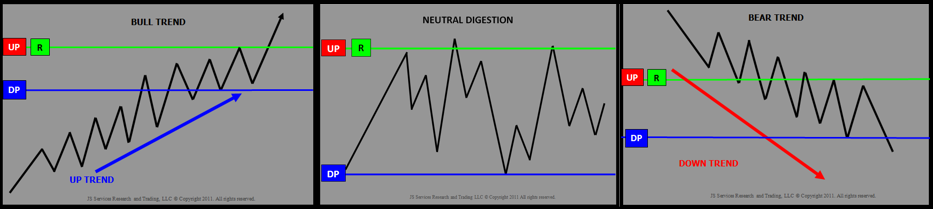
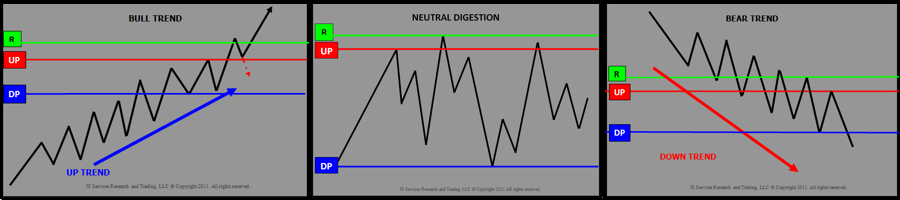
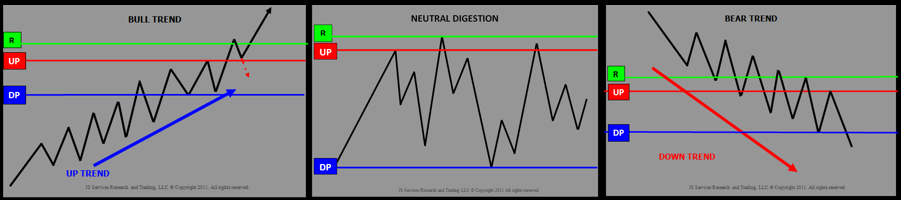
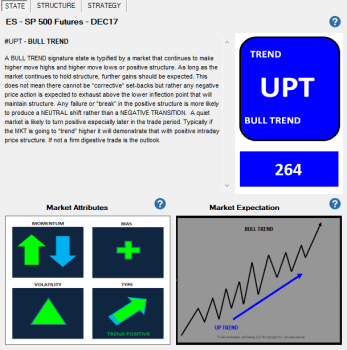
MarketColor State
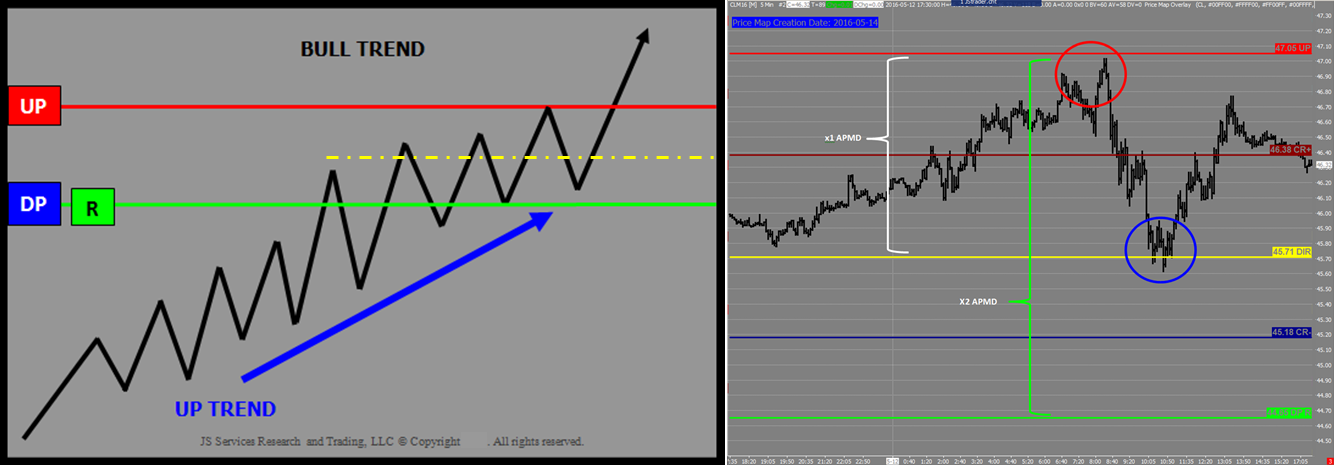
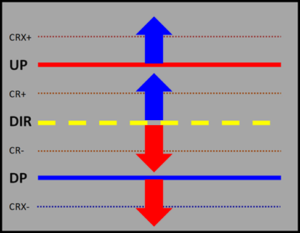
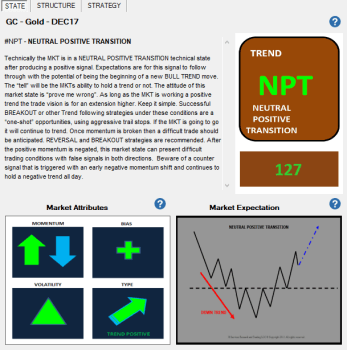
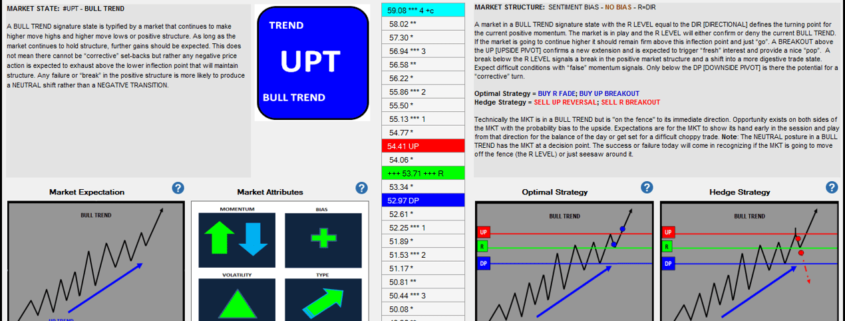
A general type BULL TREND (#UPT) has the same attributes as a signature NEUTRAL POSITIVE TRANSIITON (#NPT) MARKET STATE. The characteristics of a #UPT are defined as a steady positive trend verses a #NPT which is more indecisive and potentially volatile as the market has yet to confirm a transition into a new trend. Trading tactics can be standardized to these facts to create a structured rule based approach that is aligned with the characteristics of each MARKET STATE. A basic practical application would be to adjust risk parameters either on the amount of leverage used or stop placement. A #UPT has steady positive trend characteristics and should incorporate wider stop placement verses a #NPT which should use tighter risk parameters as its positive trend characteristic are not confirmed. Adding this structure a trade method aligns what is more likely to occur with the applied risk. Risk more in STATES that are likely to support a tactic signal as less in STATES that are not as clear.
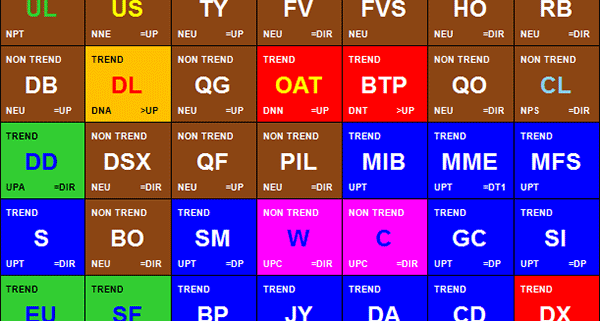
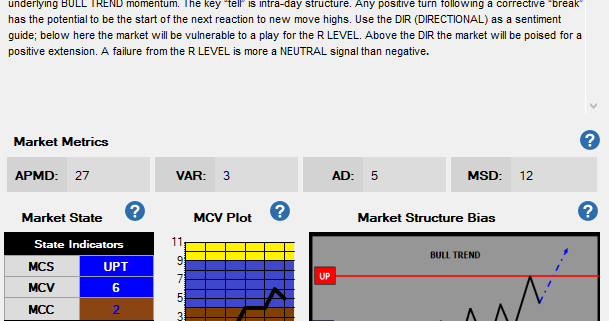
MarketColor State (MCS)
MarketColor Technical Profile
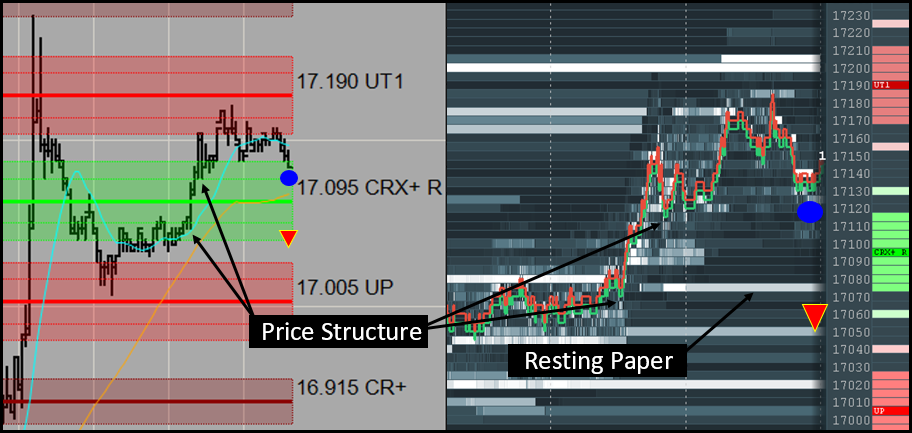
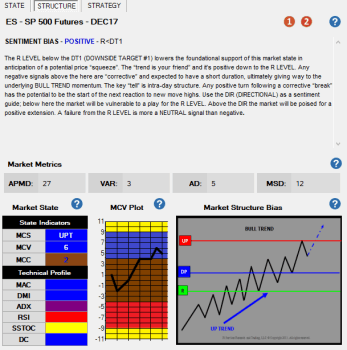
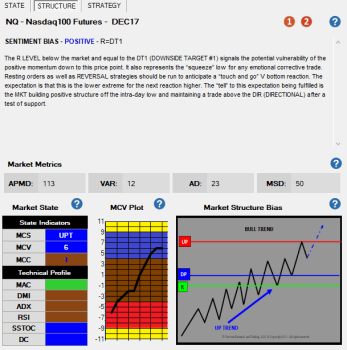
The MarketColor technical profile can also be incorporated to add additional structure to a trading method as a criteria filter for signal acceptance or market selection. In this example both the ES and NQ are in BULL TREND (#UPT) MARKET STATES however the ES technical profile is showing signs of being overbought with a negative RED indicator in the RSI (Relative Strength) and a YELLOW extreme signal in the SSTOC (Slow Stochastic). NQ is generating a new buy signal (GREEN) in the MAC (Moving Average) system but this is not supported by the DMI or ADX indicators. Of the 2 markets neither has a positive fact foundation but the NQ ‘s foundation is less risky, as overbought condition can produce abrupt negative corrections. A basic criteria filter would be to only accept buy signals in a BULL TREND when the RSI and SSTOC are either in neutral (BROWN) or supporting color (BLUE, GREEN or AQUA). If this condition is not true then no buy signals should be accepted. This filter may miss some good opportunities but is in alignment with what is more likely to occur and over time will produce a more consistent result.
MarketColor Technical Profile (Structure Tab)
Aligning trading tactics with complimentary technical conditions provides structure by standardizing

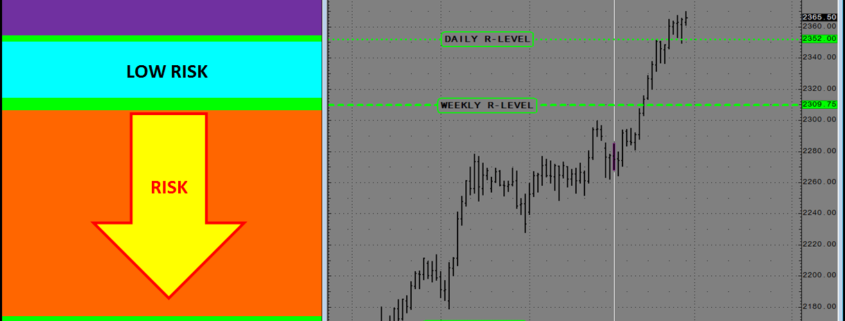
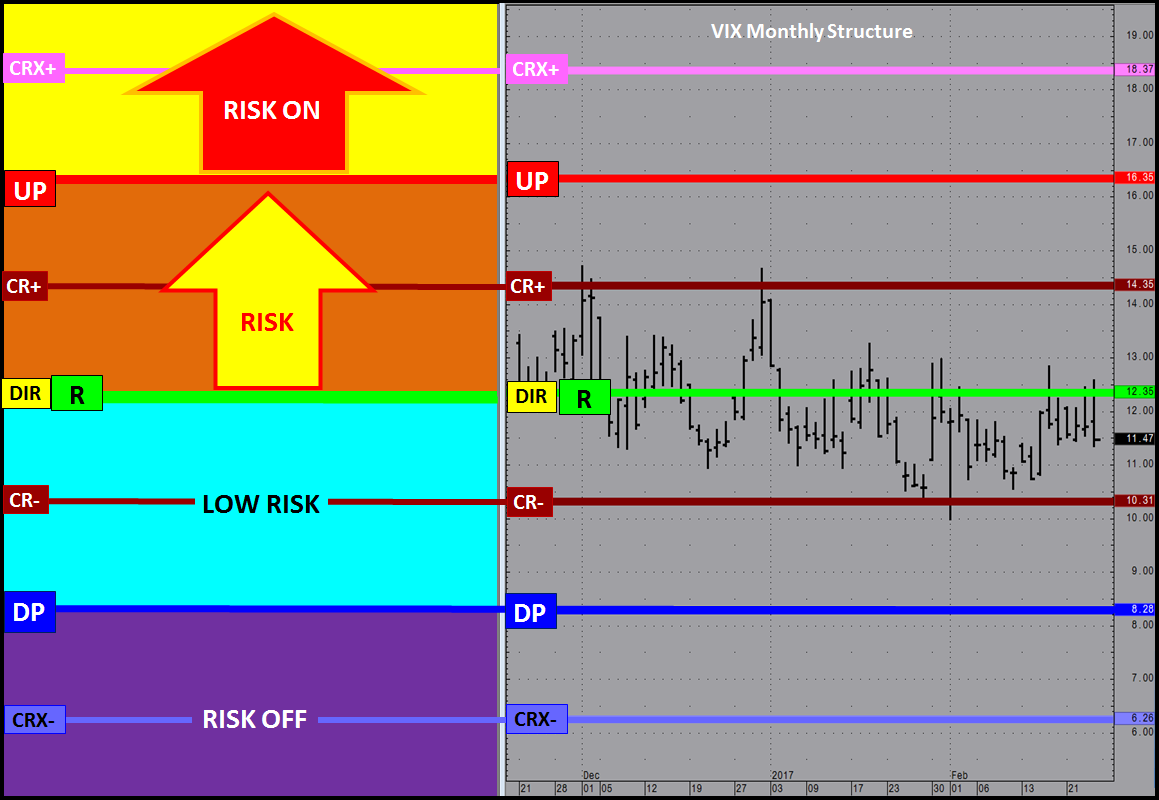
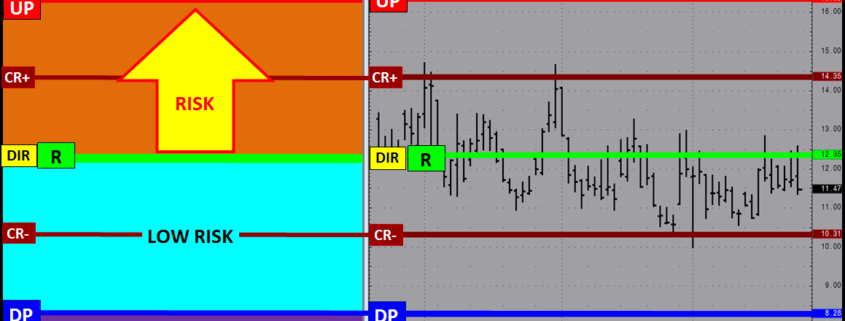
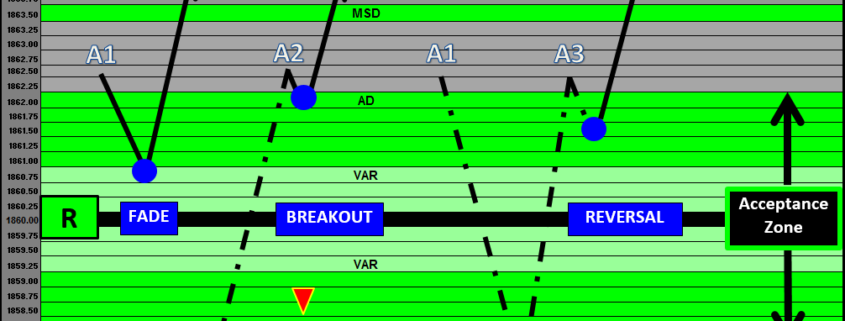
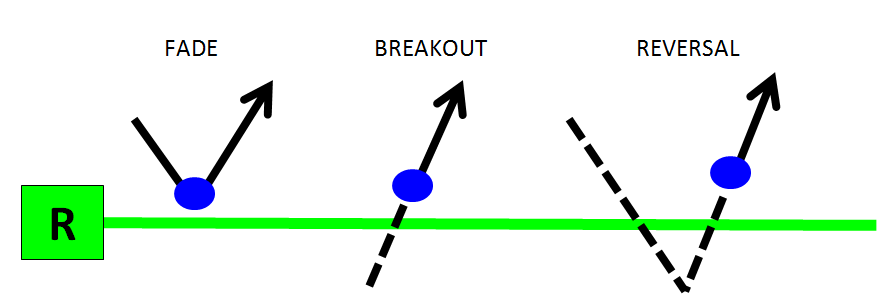
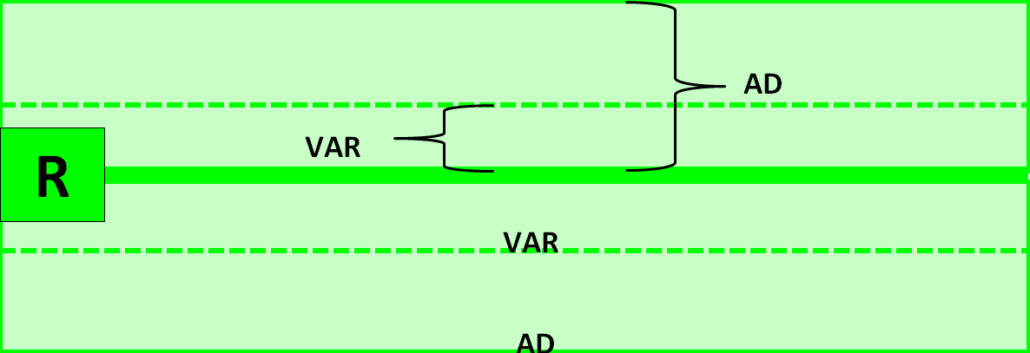
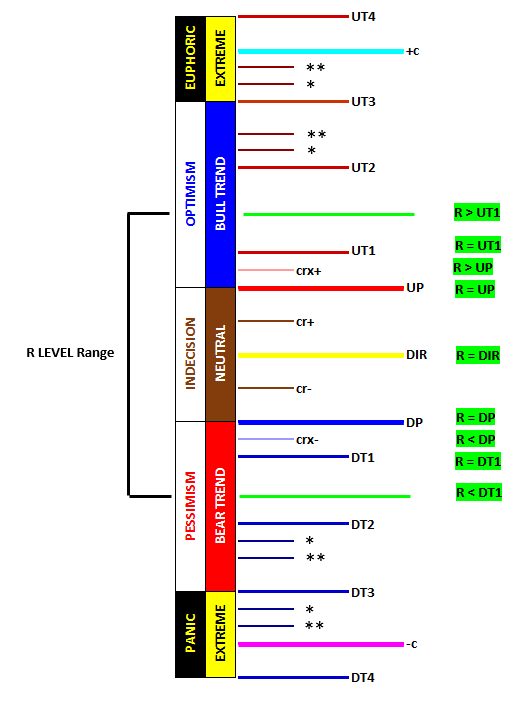
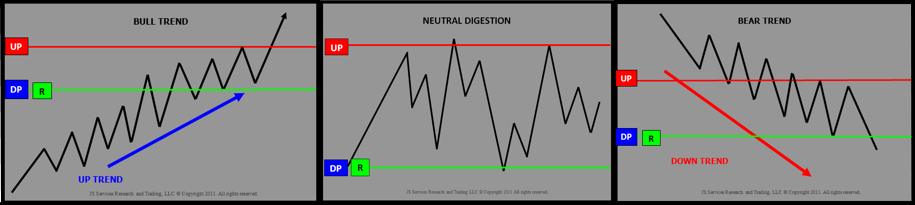
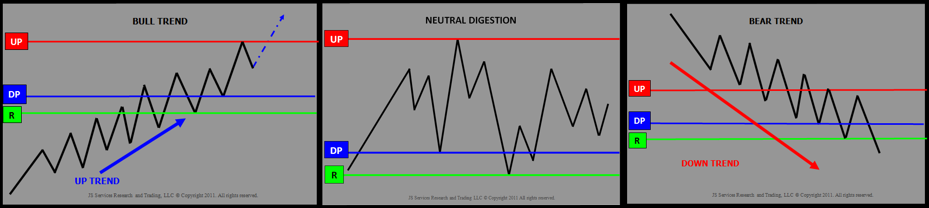
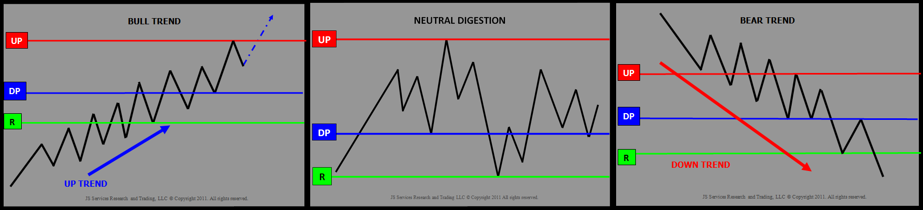
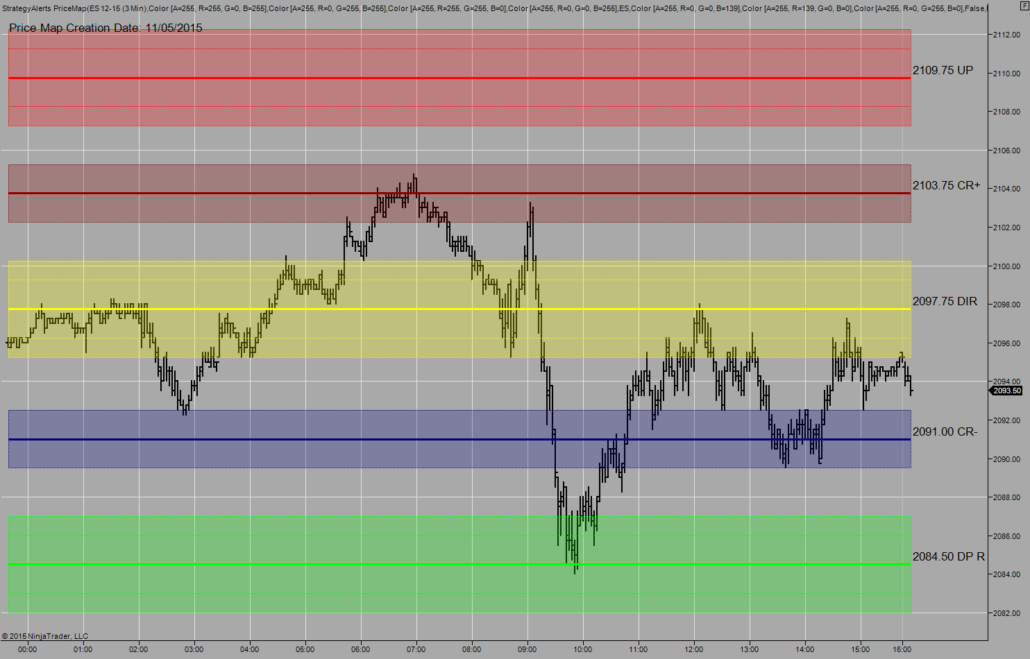
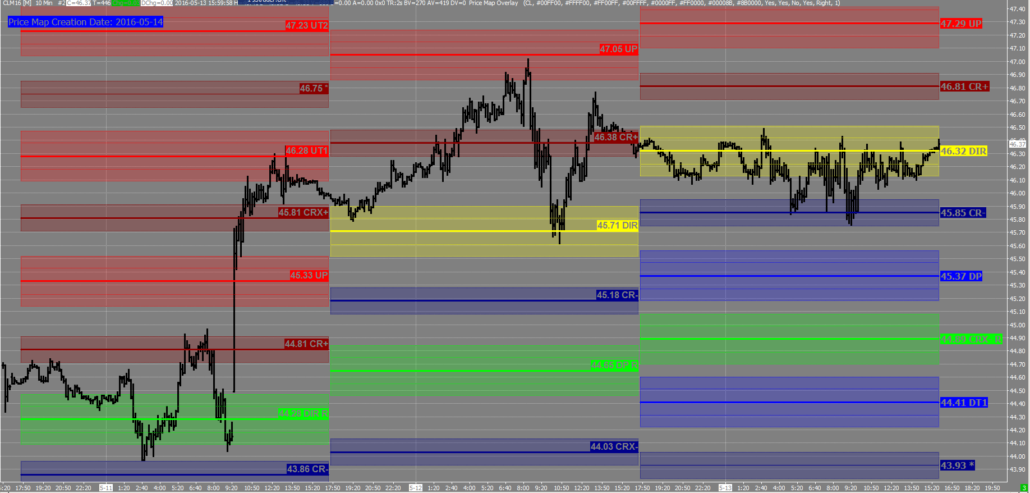
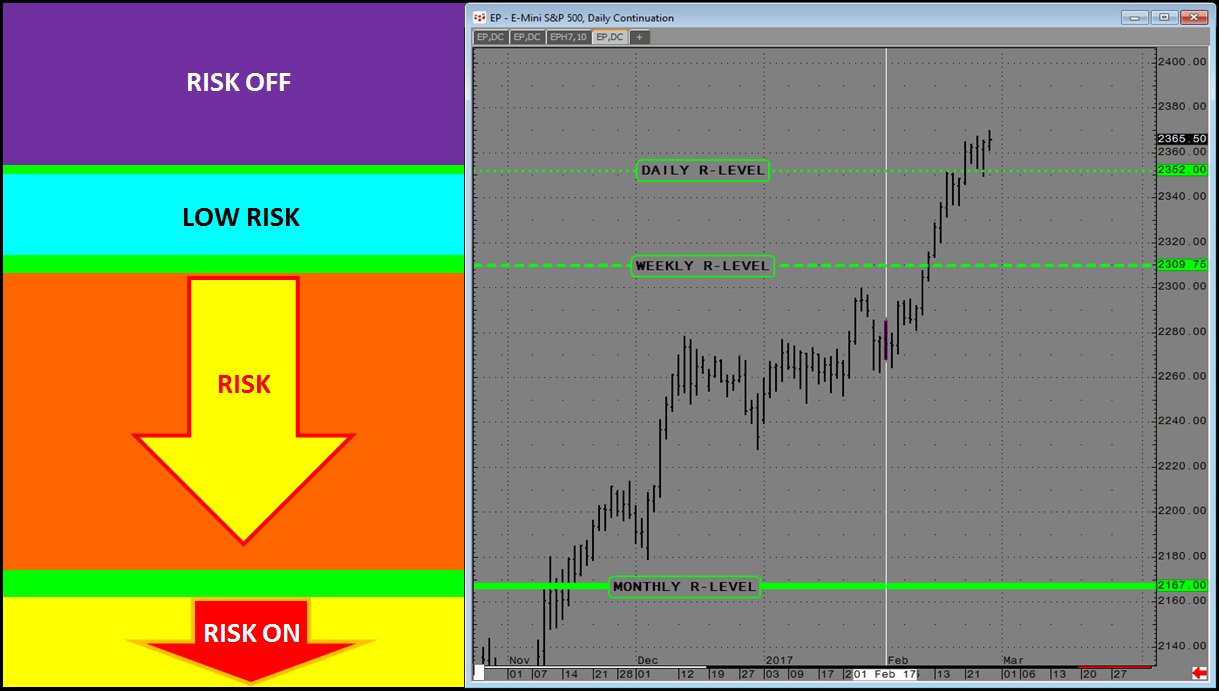 Daily, Weekly, Monthly R-LEVEL Risk Structure