PriceMap Qualifiers R LEVEL Positions

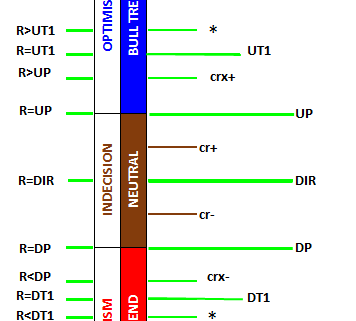
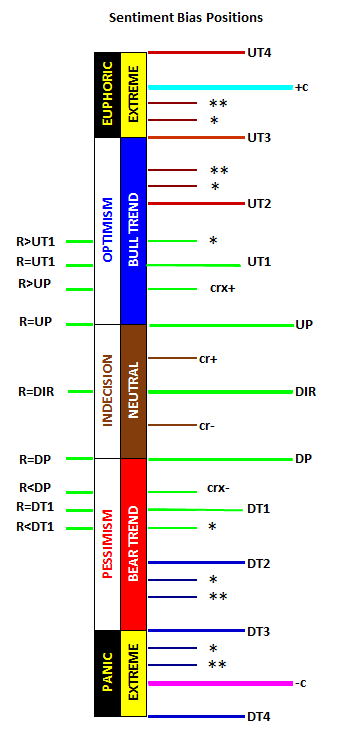
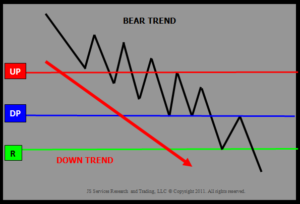
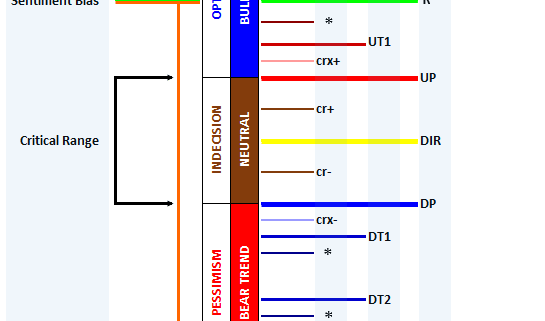
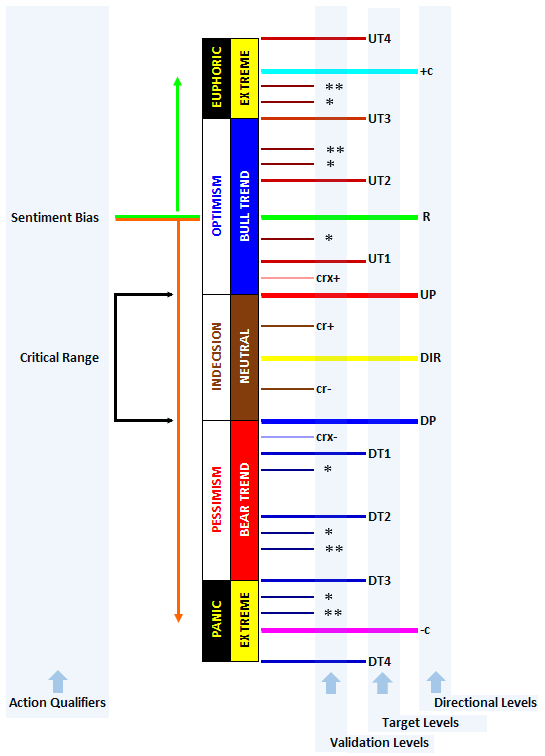
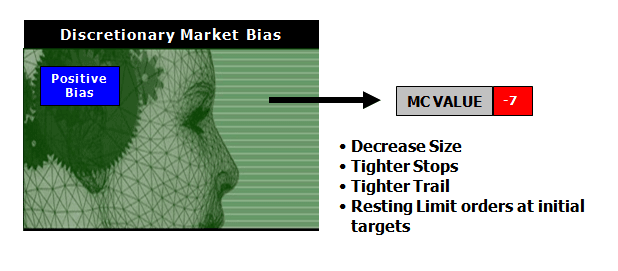
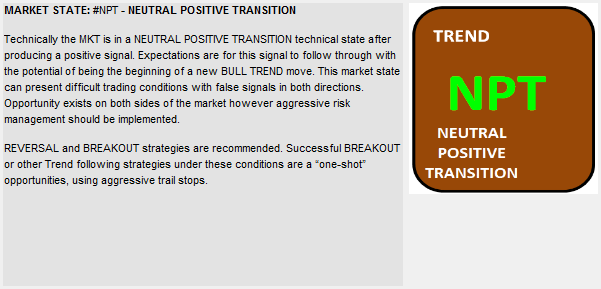
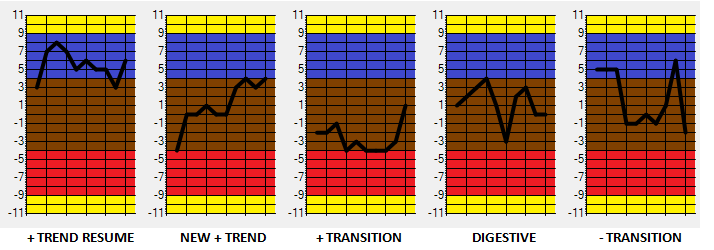
The PriceMap is the framework of the market STATE and the R LEVEL defines the behavioral sentiment bias for the trade period. Where the R level is on the PriceMap will skew the condition of the market state. The R LEVEL is a floater number which can be in one of 9 PriceMap positions each with its own identity that is outlined below.

9-9-2016-6-50-59-pm

R LEVEL Positions

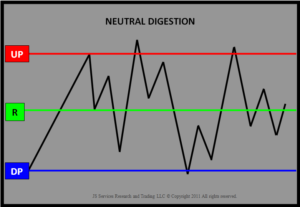
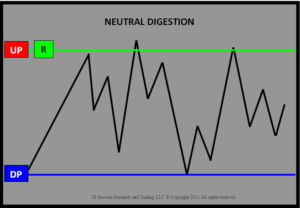
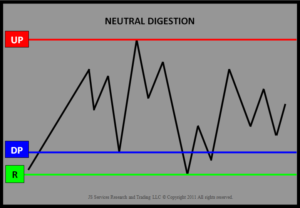
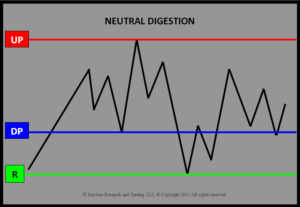
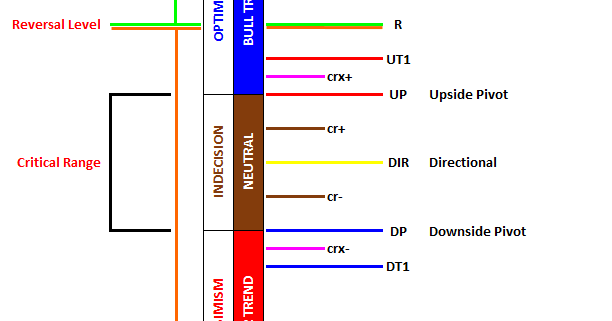
R =DIR – The R LEVEL equal to the DIR (Directional) is in a classic pivot point position, as sentiment is balance and “on the fence”. The market is indecisive or is preparing to make a move. Any Market State with the R=DIR should respect the pivotal nature of sentiment. Typically when the R LEVEL is in this position it will either just breakout and “go” producing a linear move or a difficult rotational trade will consume the market for the trade period.

msb_345 msb_105 msb_265

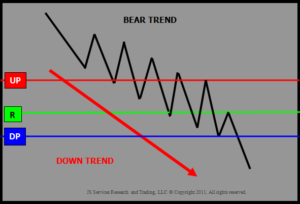
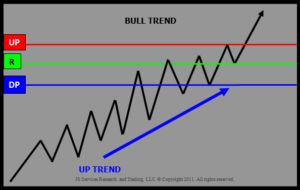
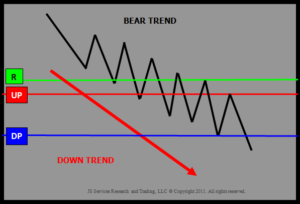
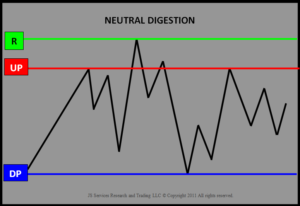
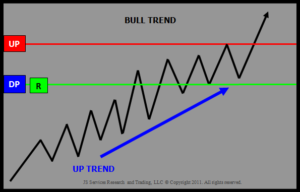
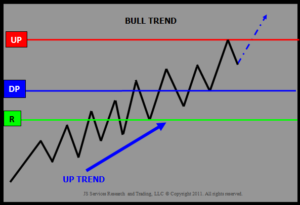
R =UP – The R LEVEL at the top of the CriticalRange defines a “hard” resistance point at the UP (UpsidePivot). Energy is centered at this price point and a violation should be expected to produce sharp interest. A downside failure below the DP (DownsidePivot) however should be expected to NOT have the same energy and any downside breakout to be more measured.

  msb_346 msb_106 msb_266

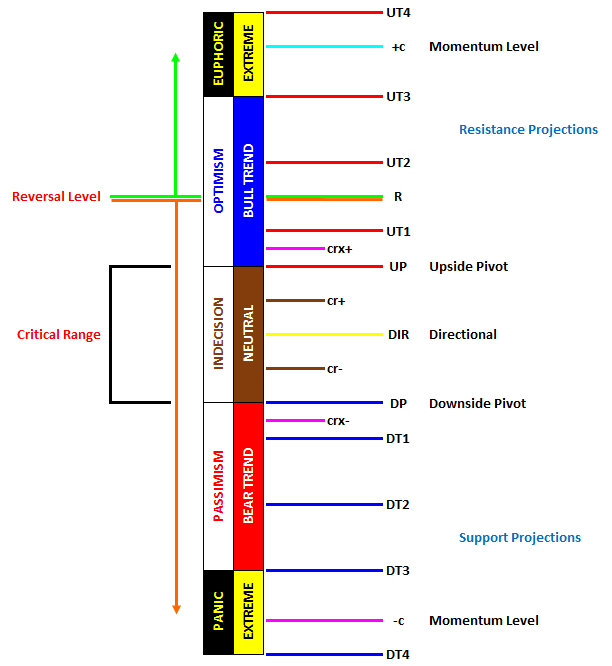
R >UP – The R LEVL above the UP but less than the UT1 creates a RESISTANCE BAND with the UP. Trading tactics should focus on the entire zone for signal acceptance. Typically this would be on the sell side as this is a resistance band but will transition into a support band if the market violates the R LEVEL and starts to transition higher.

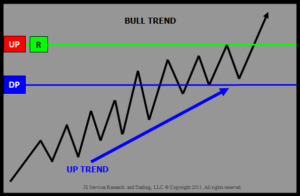
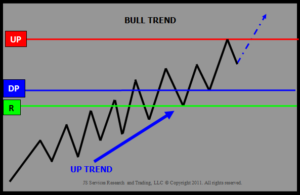
R =UT1 – The R LEVEL = to the UT1 (Upside Target #1) creates an even wider resistance band with the UP. Signal acceptance anywhere in the price band is acceptable however it is best to commit to opportunities closer to the UP or UT1. As the R LEVEL moves farther above the DIR the energy in the market place is skewed higher. Any lower price movement should be expected to be more measured and any positive turn from lower levels should be expected to target the R LEVEL

msb_348 msb_108 msb_268

Same Images for R>UP and R=UT1

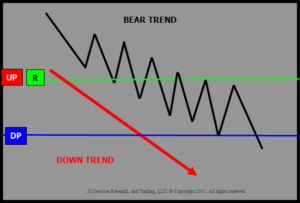
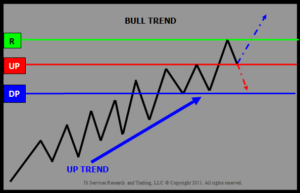
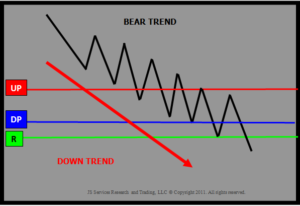
R >UT1 – The R LEVEL above the UT1 identifies the high point for any price squeeze against the underlying trend if it is going to resume in the session. A market in this position has a defined underlying negative tone and any sell signal, especially at higher levels, below this price points are actionable. Sells below the DP are a lower value opportunity and the threat of a corrective squeeze up to the R LEVEL is real. Typically the market will attempt some type of corrective move when the R LEVEL is in this position.

  msb_349 msb_109 msb_269

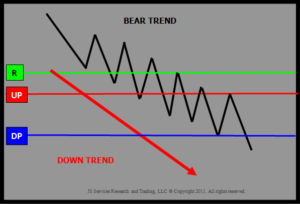
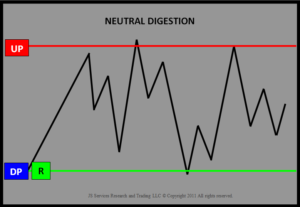
R =DP – The R LEVEL at the bottom of the CriticalRange defines a “hard” support level at the DP (DownsidePivot). Energy is centered at this price level and a failure should be expected to produce aggressive offers. An upside breakout above the UP (UpsidePivot) however should be expected to NOT have the same energy and any upside breakout to be more measured.

msb_344 msb_104 msb_264

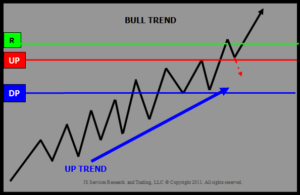
R < DP – The R LEVEL below the DP but greater than the DT1 creates a SUPPORT BAND with the DP. Trading tactics should focus on the entire zone for signal acceptance. Typically this would be on the buy side as this is a support band but will transition into a resistance band if the market violates the R LEVEL and starts to transition lower.

R =DT1 – The R LEVEL = to the DT1 (Downside Target #1) creates an even wider support band with the DP. Signal acceptance anywhere in the price band is acceptable however it is best to commit to opportunities closer to the DP or DT1. As the R LEVEL moves farther below the DIR the energy in the market place is skewed lower. Any higher price movement should be expected to be move measure and any negative turn from higher levels should be expected to target the R LEVEL.

  msb_342 msb_102 msb_262

Same Images for R<DP and R=DT1

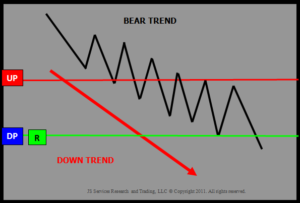
R < DT1 – The R LEVEL below the DT1 identifies the low point for any price squeeze against the underlying trend if it is going to resume in the session. A market in this position has a defined underlying positive tone and any buy signal, especially at lower levels, above this price points are actionable. Buys above the UP are a lower value opportunity and the threat of a corrective squeeze down to the R LEVEL is real. Typically the market will attempt some type of corrective move when the R LEVEL is in this position.

msb_341 msb_101 msb_261

PRACTICAL APPLICATION

* The R Level position itself can be a condition on its own to align trading tactics. For example any time, in any market state that the R=DIR it is a sign that the market is in a “pivotal” position, as sentiment is balanced. Trading tactics that perform well in pivotal market states can search out all markets that have an R=DIR.

* The R Level significantly above R>UT1 and R=UT1 or significantly below R is a “tell” that a corrective trade may develop targeting the R LEVEL. Identifying a break in PriceMap STRUCTURE is typically the 1st signal that a corrective move is in play.

* Always note the differential between the last traded price an the R Level as this is the price point that defines the rik for any trade.
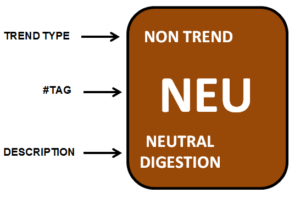
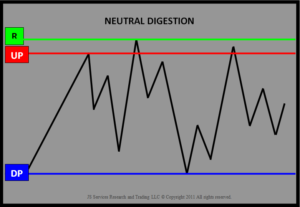
PriceMap QUICK START

PRACTICAL APPLICATION

The PriceMap provides traders with the ability to anticipate opportunity at key structure points and create risk defined strategies with improved trade vision of expected price movement. The method is scalable as a unified approach across all markets and asset classes.


pricemapleveldefinitionsfull_v13

SIGNAL ACCEPTANCE – Focus trading and signal acceptance at PriceMap level structure points. Avoid trading “in the middle”.

SIZE MANAGEMENT – Value trade opportunities and position sizing based on the PriceMap qualifier weighting. As a rule of thumb the R LEVEL should carry the greatest value or position size followed by the CRITICAL RANGE extremes (UP and DP). The DIR “Directional” (+++ +++) and *** 3 star PriceMap level target next followed by the ** 2 and * 1 star PriceMap levels. The +c and -c are major “target” levels but should be integrated as a directional pivot for insight to market momentum in the next session.

TRADE OPPORTUNITIES – Use the PriceMap as a “ladder” for trade management. Think in terms of price segment trade vision with opportunities defined as 1/2, full and X2 APMD (Average Price Map Distance) profit targets.

POSITION MANAGEMENT – Use the PriceMap as a “ladder” for position management. Markets make trend moves by holding positive or negative structure. Use price action within the PriceMap as a position management tool, adjusting stops as the market breaches a PriceMap level anticipating that it will go to the next level by holding above/below the breached level. If the breached level cannot sustained the violation it is a “tell” that the market may be set to REVERSE for a test of the opposing level on the PriceMap.

PriceMap Definitions

JSServices PriceMap Analytics use quantitative methods to objectively define the price STRUCTURE of the market STATE. The knowledge of the market STATE STRUCTURE and the awareness of current price action within it, provides clarity to the value of an opportunity and the risk and reward associated with it.


PriceMapLevelDefinitions_V13

OVERVIEW

Price levels in the PriceMap series followed by stars *** are minor structure and major target “support and resistance” levels. The star *** value weights are determined by their structural significance to the market state alignment. Alignment defined as the price point that will have an influence on the market maintaining structure or not. The more stars ***, the more value a level has and the greater significance to the structural integrity of the price framework of the market STATE. Prices followed by symbols (+++ +++ (DIR), UP, DP, R, +c and – c) are directional pivots or trend indicators. These levels are the actionable points of the PriceMap, as they define where potential transitional shifts in STATE will occur and are the preferred entry levels.

In a general sense trading within the CRITICAL RANGE (UPDP) represents a neutral posture for the market and trading outside a trend posture with the DIRECTIONAL (+++ +++ the classic pivot point within this range. The ***# levels are Upside/ Downside Target (UT/DT) projections the for a CRITICAL RANGE breakout.

The R Level qualifier represents the sentiment bias for the trade period. Trading above the R signals a positive buy break bias, while trading below signifies a negative sell rally bias. A price violation or failure at the R Level would reverse this bias.

+c and – c symbols represent Continuation Momentum numbers that define the technical event extremes.

JS PRICEMAP QUALIFIER KEY

R = REVERSAL LEVEL is the SENTIMENT BIAS level for the trade period, positive bias above, negative below.

UP = UPSIDE PIVOT is a key resistance point for the trade period and the top of the CRITICAL RANGE

DP = DOWNSIDE PIVOT is a key support point for the trade period and the bottom of the CRITICAL RANGE


MAJOR LEVELS

 DIR (+++ +++) DIRECTIONAL is a classic pivot point that sets the bias for trading within the CRITICAL RANGE [CR]

UT1 (***1) UPSIDE TARGET #1 is the minimum target for a CR BREAKOUT

UT2 (***2) UPSIDE TARGET #2 is the expected target for a CR BREAKOUT

UT3 (***3) UPSIDE TARGET #3 is the best case objective for a CR BREAKOUT

UT4 (***4) UPSIDE TARGET #4 is an event extreme target

+c     +CONTINUATION MOMENTUM defines the technical extreme

DT1 (***1) DOWNSIDE TARGET #1 is the minimum target for a CR BREAKOUT

DT2 (***2) DOWNSIDE TARGET #2 is the expected target for a CR BREAKOUT

DT3 (***3) DOWNSIDE TARGET #3 is the best case objective for a CR BREAKOUT

DT4 (***4) DOWNSIDE TARGET #4 is an event extreme target

-c      -CONTINUATION MOMENTUM defines the technical extreme

MINOR LEVELS

 *       MINOR 1 STAR LEVEL represent a minor support or resistance level

**     MINOR 2 STAR LEVEL represent a good minor support or resistance level

CRX+ CRITICAL RANGE EXTREME + defines the CRITICAL RANGE positive extreme

CR+  CRITICAL RANGE + defines the interior +quadrant of the CRITICAL RANGE

CR-   CRITICAL RANGE – defines the interior -quadrant of the CRITICAL RANGE

CRX- CRITICAL RANGE EXTREME – defines the CRITICAL RANGE negative extreme


MARKET METRICS

 VAR = VARIANCE – defines the optimal area influence of a Major or Minor Level

AD = ALERT DISTANCE – defines the area of signal acceptance and structure thresholds for a Major Level

MSD = MAXIMUM STOP DISTANCE – Defines the maximum area of influence of a Major Level


MCV Relative Strength

RELATIVE STRENGTH

The MC VALUE is a single number in a bounded scale. This feature provides a quick “relative strength” comparison to other like markets for spread or paired opportunities.

9-2-2016 9-58-46 PM

9-2-2016 10-00-49 PM

Every market has an MCV and that value is bounded in the MCV Table scale. The MCV technical rank allows a trader to quickly identify the markets that are technically bid or offered in a sector and select strategies that will work best for each market individually, by default creating a technically paired opportunity.

  • Note: the MCV is not a “signal” and does not indicate a spread should be initiated that establishes a long position in a positive MCV market and short in a negative MCV market. It can however be used to accept sell signals in the markets of a sector that have weaker MCV and buy signals in markets with a stronger MCV.


MCV Size Management

SIZE MANAGEMENT

The MCV can be used for size management to gauge the amount of leverage used for a signal.

For example assuming all System or Fundamental strategy signals are accepted, size can be increased or decreased depending on the system signals confluence with the MCV.

MCV SZS

MCV SZB

The one thing we know for sure about the markets is that we don’t know what they are going to do. By accepting all signals but using the MCV as a size management tool, your strategies can naturally leverage up when they are aligned with the MCV.

For discretionary traders when your market bias is in line with the MCV you can step out a little more and when it is not in alignment, step back and trade more conservatively with smaller size.

MCV DIS

The edge discretionary trading has over machine signals is the “gut” feel to anticipate an opportunity. The MCV can be used as a “reality check” to keep your leverage and risk in line with the probabilities and not what you “think” “should” happen.


MCV Strategy Selection

STRATEGY SELECTION

The MCV is an objective Technical Indicator, which can be used as a criteria filter for confluence with a fundamental position, a technical system signal or discretionary market bias.

For example, in its most basic form a SELL SIGNAL would only be accepted when the MCV is negative and a BUY SIGNAL only when the MCV is positive.

marketcolorsignalacceptance_v03


This does not mean that negative system or fundamental signal will not “work” when the markets technical state or MCV is in a positive position, it just means that the chances are lower that it will and the follow through potential of the signal is decreased.

For a discretionary trader, if you have a positive outlook on the market but the MCV is negative you should be more conservative and selective in your trades and avoid “pressing” the long side with the understanding that today the MCV bias is against you and if you have profits from any longs you should take them.

marketcolorsignal_v03

Note: Markets are dynamic and are shifting from one technical state to the next. By keeping signal acceptance in line with the MCV the chance of success is improved. This does not mean that signals counter to this bias cannot be profitable and no doubt most major “reversal” signals are “counter” to the current technical state, however they do occur less frequently.

MCS Explanation

MARKETCOLOR STATE (MCS)

The MC VALUE (MCV) is a bounded scale study which has a finite set of MC VALUE CHANGE (MCC) permutations, each result representing a defined technical “signature” state whose characteristics, expectations and attributes can be qualified. There are 26 unique signature trade states that define the MarketColor State [MCS].

MCB TABLE

OVERVIEW

The MCS provides an objective definition of a markets technical state. By understanding MARKET STATE traders are able to align trading tactics to the expectation of the state conditions.  It is important to understand that markets are constantly in transition from one state to the next. The MCS identifies what the current state is and the “tells” to look for that signal the market state is going to persist or not.

  • When the market performs to the expectation of the state, trading seems easier as opportunities align with the characteristics of the state and can be anticipated. When the market is not performing to the characteristics of the state, it is in transition and trading opportunity is more difficult to predict. The key is to recognize as early as possible the markets intentions of what it wants to do. The reason its easy to look back at the end of the day and explain “why” the market did what it did in the session, is that the market leaves “tells” to its intentions in its price action. By understanding the market state and knowing what the market “should” do you are able to recognize these tells in real time and not in hindsight, dramatically improving your intuitive decision making. The MCS is the foundation of this knowledge base and is divided into 3 section: Characteristics, Expectations and Attributes

MCS – CHARACTERISTICS

MCS Characteristics highlight the specific FACTS of the market state. It is the textbook definition of what the market “should” do if it performs to expectation of the  state including the “tells” to look for to confirm or deny this expectation and contingencies to apply when the markets transition. Traders should align their tactics with these facts.  


The MCS icon provides key information about the state at a glance, its TREND TYPE, #TAG and tag DESCRIPTION

9-3-2016 6-08-54 PM

  • TREND TYPEThis item represents the general market state type or primary state. These are the generally defined states:  NON TREND | TREND |EXTREME
  • MCB #TAG and DESCRIPTIONdefine the signature market state which is a subset of the general TREND TYPE.

NEU is a general NON TREND market state type with no signature. The state is defined by and MCV in the 3 to +3 range and an MCC that is less than an absolute 3 shift.

NPT is a general TREND type market state that has an MCV in the -3 to +3 NEUTRAL range but does have an MCC that is = or greater +3 identifying a positive transition signature in the MCV NEUTRAL ZONE.   

Example

  MCB NPT

The TREND TYPE and SIGNATURE state characteristics allow traders to align tactics across general type or dial into the specific nuances of a signature state.  

MCS – EXPECTATIONS

The MCS EXPECTATION provides a textbook graphic of the expected price action of the defined Market State. It is important to understand the complete picture so expectations can be aligned. An expectation of a NPT-Neutral Positive Transition MCS is that it will trend higher as this is the characteristic of the state. IF the market is not trending THEN it is a “tell” the market is transitioning back into a NON TREND condition. Knowing these facts improves awareness to align tactics and anticipate opportunity.

  MSB_120 NEW

MCS – ATTRIBUTES

The MARKET STATE ATTRIBUTE icons define specific nuances of the current Market State in regards to MOMENTUM, DIRECTIONAL BIAS, VOLATILITY expectation and TREND TYPE. Traders can use these as an easy classification tool to align tactics with the attributes of the state.

MOMENTUM

9-3-2016 11-00-14 PM

This is a MOMENTUM icon denotes the markets ability to trend and is the preferred attribute for all trading tactics that like to trade with momentum.

9-3-2016 11-00-37 PM

This icon identifies a market with NO MOMENTUM and is the preferred attribute for non trend tactics which like to fade momentum.

DIRECTIONAL BIAS

9-3-2016 11-00-55 PM

This icon identifies a market with a POSITIVE BIAS and is the preferred attribute for BUY SIGNALS

9-3-2016 11-01-14 PM

This icon identifies a market with a NEGATIVE BIAS and is the preferred attribute for SELL SIGNALS

9-3-2016 11-01-36 PM

This icon identifies a market with a NO BIAS and is the preferred attribute for both BUY and SELL SIGNALS and transitional or rotational trading strategies

VOLATILITY

9-3-2016 11-01-56 PM

This icon identifies a market with a VOLATILITY INCREASE expectation and is the preferred attribute for TREND FOLLOWING momentum strategies.

9-3-2016 11-02-13 PM

This icon identifies a market with a VOLATILITY DECREASE expectation and is the preferred attribute for NON TREND FADE momentum strategies.

9-3-2016 11-02-30 PM

This icon identifies a market with a MIXED VOLATILITY expectations and is the preferred attribute for ROTATIONAL and TRANSITIONAL BREAKOUT momentum strategies.

TREND TYPE

9-3-2016 11-10-28 PM

This icon identifies a market in a POSITIVE TREND and is the preferred attribute for BUY BREAKOUT TREND FOLLOWING strategies

9-3-2016 11-10-47 PM

This icon identifies a market in a NEGATIVE TREND and is the preferred attribute for SELL BREAKOUT TREND FOLLOWING strategies

9-3-2016 11-11-06 PM

This icon identifies a market in a NON TREND position and is the preferred attribute for DEVIATION and FADE strategies

9-3-2016 11-11-44 PM

This icon identifies a market in a EXTREME POSITIVE position and is the preferred attribute for SELL REVERSAL strategies

9-3-2016 11-12-15 PM

This icon identifies a market in a EXTREME NEGATIVE position and is the preferred attribute for BUY REVERSAL strategies

MCC Explanation

MCV Explanation

MC VALUE (MCV)

The MCV is a summation of the different MarketColor technical indicator systems and represents a market’s technical bottom line position.

marketcolormcv_v03

MCV defines a market’s general market state type as a single value technical “rank”. Markets with more systems in a positive position will have a greater positive MCV, and markets with more systems in a negative position with have a greater negative value. Markets counter balanced or neutral will have a value close to zero (0).

MCV TABLE

MarketColorValueTable_V01

In the table above, each segment defines a general state where the –3 to +3 segment is the NEUTRAL ZONE, -9 to –4 and +4 to +9 are the TREND ZONES and 10 to 11 on either side are the EXTREMES.

It is important to remember that this is not a “signal” of what might occur but rather a definition of what “is” the market’s current technical state. Just because a market has a positive MCV does not mean one should just buy the market. It just means that buy signals will have a better chance of succeeding over sell signals because the market’s underlying technical state is positive.

The MCV defines the session “playing field” so strategy criteria can be optimized and aligned with the Market STATE.

Example:

9-2-2016 5-04-22 PM

DIRECTIONAL BIAS = SELL          STRATEGY SELECTION = NON TREND

  • A market with an MCV = -3 is in the soft side of the NEUTRAL zone. The expectation is that the market is vulnerable to a negative shift into a BEAR TREND state or has the potential to bounce back to the middle of the NEUTRAL zone. SELL strategies in this technical state are expected to have more potential over BUY strategies. However, the market’s NEUTRAL posture may limit any opportunity, valuing deviation NON-TREND type tactics over TREND type.


The MCV summarizes the MarketColor profile results into a single value within a bounded scale, providing an “at a glance” indication of a market’s technical position. The effect is an objective numerical definition of a market’s general state type that can be used for Strategy Selection, Size Management, and as a technical Relative Strength comparative.


MCV – NEUTRAL

MCV NEU1 NEUTRAL ZONE

The -3 to +3 area defines the NEUTRAL ZONE. Markets in this position are in 3 typical states; Digestion, Correction or Transition.

DIGESTION – A sideways environment with choppy trading conditions. In this condition directional moves are not expected to be sustained. Opportunity exists on both sides of the market, albeit profit potential is limited and should be realized “sooner than later”. Fade and Reversal strategies are recommended. Markets that do end a session with a strong directional bias will have trouble sustaining that bias in the coming session, without the support of a like change in the next session’s MC Value.

CORRECTION – The market has been displaying a directional bias and has had >2 sessions with an MC Value in the Trend zone. A Neutral MC Value following these conditions signals a potential “corrective” trade. The longer the “established” trend and the “sharper” the MC Value “shift”, the more likely the market is in a corrective mode. Best opportunity exists in entering the market in the direction of the previous trend. Fade, Reversal and Breakout strategies in the direction of the previous trend are recommended.

TRANSITIONAL – The market has seen a steady deterioration in directional bias, slowly moving from the Trend Zone to the Neutral zone. These are difficult trading conditions. False signals in both directions are common. Opportunity exists on both sides of the market however aggressive risk management should be implemented. Reversal and Breakout strategies are recommended. Successful Breakout or Trend strategies under these conditions are a “one-shot” opportunities, using aggressive trail stops and having expectations of a one-way “railroad” trading environment.

MCV – TREND

MCV NT  MCV PT

BEAR TREND ZONE                                BULL TREND ZONE

The BULL TREND and BEAR TREND define the Positive and Negative Trend Zones respectively. Markets in this position are in 3 typical Trend states; Beginning, Established and Late (End).

BEGINNING TREND – The market has had >= 2 sessions with the MCV in the trend zone. The environment is expected to be “stop and go”, with opportunity on both sides of the market with the best opportunity @ the R Level in the direction of the Trend bias. Fade and Reversal strategies are expected to be more successful over Breakout strategies as the Trend has yet to establish itself and may be “choppy”.

ESTABLISHED TREND – The market has had >3 sessions of MCV in the trend zone, at least one value => 6. Values of 7 or 8 show a strong trend bias. Breakout and Fade strategies in the directional of the MC Value and R Level bias are recommended as well as Reversal strategies in both directions. Expectations are for a “smoother” trading environment.

LATE TREND STAGE – The market has had >= 9 sessions in the Trend Zone with at least 3 sessions >= to 8 and one of those sessions a >=9.  Trend strategies remain in effect, however large price movement in the direction of the trend bias should not be expected to be maintained. Any Breakout strategy should look to take profit on “exhaustive” surges as the market is expected to “give back” the bulk of the intra-day move in this stage. Reversal strategies should focus on counter trend opportunities as these signals are expected to be a foreshadowing of an impending “correction” or “digestive” trade.

MCV – EXTREME

MCV XTRM

NEGATIVE EXTREME ZONE   POSITIVE EXTREME ZONE          

These zones define the Positive and Negative Extremes. Markets in this position are extended and are expected to Reverse or trade in a sideways digest. Counter trend Reversal, Oscillator OB/OS type Fade, divergence and Breakout strategies are recommended. Breakout strategies in the direction of the trend are not advised however if implemented should use tight risk management. The market is at an extreme and an exhaustive or reversal signal is expected.


MarketColor Profile Analysis

MARKETCOLOR PROFILE

Technical indicator analysis by design is lagging. It is always looking backward and “waiting” for the last price to determine a signal. This is an important point, as all technical indicator analysis should be looked at as a foundation for an opportunity rather than a signal for one. Opportunities must be anticipated.

Sample Profile

The Market Color Profile is made up of six classic technical indicators. The numerical and logical results of these indicators are color coded to simplify their interpretation. The technical indicators included in the profile include the following:

  • TREND – Moving Average “MA“, Directional Momentum Index “DMI
  • TREND ABILITY – Average Directional Momentum Index “ADX
  • OSCILLATION EXTREME – Relative Strength Index “RSI
  • TURNING POINT – Slow Stochastic “SSTOC
  • EXTREME DEVIATION – Bollinger Band / Keltner Channel / Dynamic Channel  “DC


MarketColorProfileSample_V03

MarketColor Sample Profile

Color Codes

The numerical and logical results of the technical indicators (shown above) are represented by color codes. The table below displays how to interpret the results using the colors shown.

MarketColorCodes_V03

MarketColor Profile Result Color Codes

Analysis Steps

Step 1. Does the market have a trend bias?   What is the color position of the DMI and Moving Average?

  • A GREEN, BLUE, ORANGE or RED color signifies a trend bias.  If the color of either the MA or DMI indicator is BROWN, the other indicator’s trend color should be discounted. If both are BROWN, the market is in a NEUTRAL posture.
  • In a NEUTRAL trend bias, the analysis should focus more on the Oscillator indicators. The Moving Average indicator can be in a YELLOW or extreme position which would signal caution to any DMI signal.

Step 2. If the market has a trend, how strong is it?   Do both trending indicators confer?

  • If both trending indicators have any combination of GREEN | BLUE or ORANGE | RED, the market will have a strong trend bias.  AQUA or PINK are transitional colors and should NOT be considered trending.
  • After a trend has been determined, the next indicator to look at is the market trending ability or ADX.

Step 3. Does the market have follow through potential?

  • An ADX with a BROWN color signals that the market is not showing any trending tendencies and would discount the trend color bias.  In this instance, greater weight should be placed on the Oscillator indicators.
  • A PURPLE color signals a trending market that will add weight to any trend signal and discount the Oscillator indicators.  A trending market with trending tendencies should then view the Turning Point and Dynamic Channel extremes.

Step 4. Is the trend at a turning point?

  • The SSTOCH (Slow Stochastic) Turning Point counter trend signals warn that the current trend is ready to take a pause and possibly reverse.  A trend reversal signal would have a counter trend action color (GREEN or ORANGE) associated with it and should always be respected. A YELLOW color is a signal that the market is at an extreme, and the trend is exhausting with the possibility of a pause or reversal of the current trend bias.
  • Turning point indicators with like trend bias colors will add weight and reinforce the current trend.

Step 5. Is the market at an extreme?

  • The Dynamic Channel color profile shows if a market is moving to or is at an extreme.  All other colors should be noted for their support for or against the current trend.

Step 6. Is the market in a Neutral posture? 

  • If the market does not have a trend bias or does not have any trending tendencies, then the Oscillator indicator (RSI) will determine the market’s tone.

Step 7. Is the market overbought or oversold?

  • If the Oscillators is at an extreme, it will produce a color signal. The RSI Oscillator indicator can produce a momentum signal with a GREEN (BUY) or ORANGE (SELL) signal associated with it.  This signal is usually early in a market’s transitional posture.

Step 8. What is the general tone or MC Value? 

  • The market’s technical “color” profile is summarized into a single numeric value – the MC Value. The value is based off the color position of the different MarketColor indicator technical systems.  Markets with more systems in a positive position will have a greater positive MC Value, and markets with more systems in a negative position will have a more negative value.  Markets counter-balanced or NEUTRAL in color will have a value of zero (0).

Analysis Summary

After going over the MarketColor profile a market’s underlying technical tone will be revealed.  This result should be used as a component when making trading decisions with or without other supporting technical or fundamental work.

Practical Examples

EXTREME DEVIATION – Dynamic Channel (Bollinger Band)

MKTCOLOR 5

MarketColor uses the Dynamic Channel and Bollinger Band to show the stage of the trend a market is in. When the cells are YELLOW the market is at an extreme, and a pause should be expected. Typically, the market has made a sharp price move, either with or against the current trend.

A price move with the trend signals a sign of exhaustion. The market is a little ahead of it-self and will have difficulty sustaining price moves in the direction of the trend.  Early morning follow through in the trend direction are particularly vulnerable and provide good opportunity.

Low Risk Trade Opportunity

  • The market has rallied hard for the past 7 days. On the 8th day, the DC (Dynamic Channel) cells light up YELLOW, signaling that the market is at an extreme.  The market opens higher. For a scalp, look for opportunities to FADE this strength either at major PriceMap resistance targets or even a better use a REVERSAL entry technique on a failure back through a violated PriceMap resistance level. This type of opportunity is even greater when the extreme signal (YELLOW) is against the underlying trend analysis. This type of signal is corrective and the market is “squeezing” the trend positions.
  • The market has been in a 2-week BEAR TREND move and then has a sharp 1-3 day corrective rally, which turns the DC to YELLOW (Extreme).  A higher opening, followed by fresh buying, would provide a FADE buy opportunity off major PriceMap resistance levels or even better a SELL REVERSAL opportunity on a violation back down through a violated PriceMap support level. This opportunity is farther reaching, as the signal is in the direction of the underlying trend and provides a low risk entry for potentially the start of the market’s next decline.

TURNING POINT – SSTOCH – Slow Stochastic BUY (GREEN) / SELL (ORANGE) signals

MKTCOLOR 9   MKTCOLOR 8

MarketColor uses this indicator to show trend turning points.  When the cells are GREEN (Buy) or ORANGE (Sell), a turning point signal has been generated and Price Map moves in the direction of this signal should be respected.

These signals have the highest probability of success and should be expected to last for at least 1 to 3 days.

Low Risk Trade Opportunity

  • The market has been strong for the past 10 days. On the 11th day, an ORANGE sell signal is generated on the SSTOC. Traders should look for FADE and REVERSAL opportunities to sell the market against the UP (Upside Pivot) or R (Reversal Number) or on a failure BREAKDOWN from the DP (Downside Pivot), as the chance of a corrective set-back is higher.
  • A held trade above the UP will negate this signal for the session.

MOMENTUM – RSI – Relative Strength BUY (AQUA or GREEN) / SELL (PINK or ORANGE) signals

MKTCOLOR 5 9-1-2016 10-16-13 AM 9-1-2016 10-18-34 AM 9-1-2016 9-52-10 AM

MarketColor uses the RSI indicator to show short-term shifts in momentum.

These signals are most successful in the initial signal session, but GREEN and ORANGE signals can influence the market for up to 3 days. The probability of success will increase when the ADX is in a BROWN (Neutral) position.

Low Risk Trade Opportunity

  • The market has been trading directionless for the past 5 days. On the 6th day, a GREEN buy signal is generated on the RSI. Traders should look for buy FADE opportunities off the DP (Downside Pivot), the DIR or on a BREAKOUT above the UP (Upside Pivot), as the probability of a rally is higher. FADE and BREAKOUT entry strategies can be used off the R LEVEL as well.
  • A held trade below the DP will negate this signal for the session.

TREND SIGNALS – MA (Moving Average) and DMI (Directional Momentum) BUY/SELL signals

MKTCOLOR 10

MarketColor uses these indicators to show a market’s trend. Action colors [GREEN = BUY, ORANGE = SELL]in either the MAC (Moving Average Close) or DMI (Directional Momentum Indicator) systems indicate that a new trend signal is being generated.

New signals in one indicator that have a like-color bias in the other indicator should be viewed as a stronger signal. In addition, a PURPLE trending ADX (Average Directional Index) will add value to any buy or sell signal.

Low Risk Trade Opportunity

  • The market has been working higher for the past 5 days. On the 6th day, a GREEN buy signal is generated on the DMI. Traders should look for opportunities to buy the market off the DP (Downside Pivot) or R LEVEL as well as  a BREAKOUT entry strategies above the UP (Upside Pivot), as the chances of a rally are improved.
  • In the above example, the MAC system is already in a Bull Trend (BLUE) and the ADX is PURPLE. This new buy signal in the DMI is both in the direction of the current trend (BLUE MA) and has follow-through potential (PURPLE ADX).  Signals like these, if sustained, have the potential to carry the market for 2-5 weeks.
  • A BROWN neutral ADX or MAC would take away from the strength of the DMI signal and any lasting effects. Buying opportunities under these circumstances should be considered short-lived, as a choppy trading environment is expected.