PriceMap R LEVEL
![]()
R LEVEL
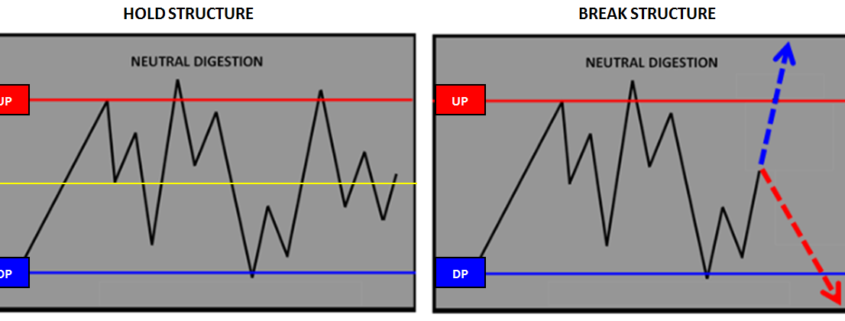
The PriceMap defines the price structure of the market state by identifying the sentiment bias for the trade period. It is the specific price point where shifts in state occur and where increased levels of liquidity can be anticipated to offer the most consistency.
The R LEVEL represents the equilibrium level within the PriceMap structure. It is the “Over-Under” number for the day and identifies the session’s trend bias.
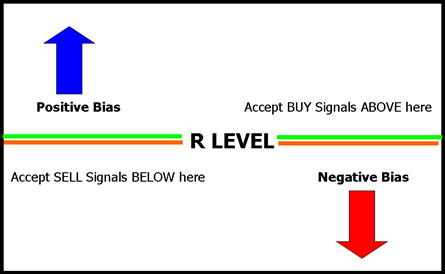
Trading above the R LEVEL signals a positive buy break bias and trading below the R LEVEL signals a negative sell rally bias. It is this inflection point where sentiment shifts from positive to negative and vice versa.
The R LEVEL is the most significant price level on the PriceMap as it defines the session bias and is the best starting point when using the service. Traders should be aware of price activity in relation to the R LEVEL and note if the current action is with or against the R LEVEL bias.
Signals with the trend should be expected to be smoother, with follow through potential, and signals against the R LEVEL bias to be more laborious.
Because the R LEVEL is so significant price action around this level can be rotational as equilibrium balances its self out.
R LEVEL Overview
The R LEVEL can be used as a criteria filter for signal acceptance as well as a size and position management tool. If a signal is accepted that is counter to the R LEVEL bias, lower size is recommended along with a more aggressive position management with the target objective for the trade being the R LEVEL itself.
Note: the R LEVEL represents the optimal risk / reward entry level for any directional opportunity.
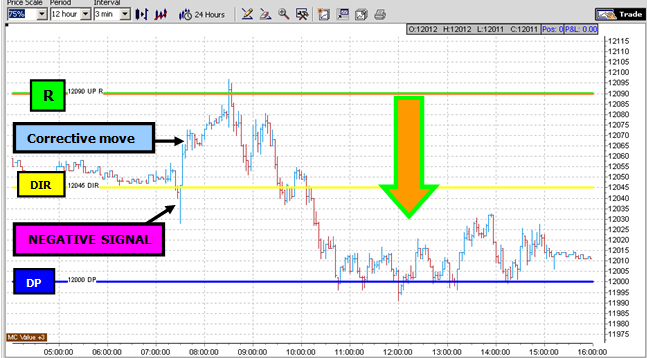
In situations where the current Price is significantly above or below the R LEVEL, any trades initiated in the direction of the R bias are ultimately at risk to and through the R LEVEL. A position is not “wrong” until the R-LEVEL is taken out. Trading action early in the session in the direction of the R LEVEL bias but significantly away from the R LEVEL is vulnerable to a “corrective” move later in the session. The market has a lot of room to “play” as counter session trend moves will not mean much as long as the R LEVEL is not violated.
Practical Application
The FTSE MIB over the past few sessions has provided corrective, directional and rotational examples of the R LEVEL behavior.
CORRECTIVE
JULY 28 2015 – FTSE MIB
On the OPEN the MIB broke structure producing a positive “corrective” rally targeting the R LEVEL. This type of corrective action is typically and a difficult trade. The market produces a trade against the R LEVEL bias which takes all session to play out. These types of opportunities typically happen after a negative signal the session prior with the R LEVEL significantly above the market . The “tell” being a break in structure at the DIR (Directional).
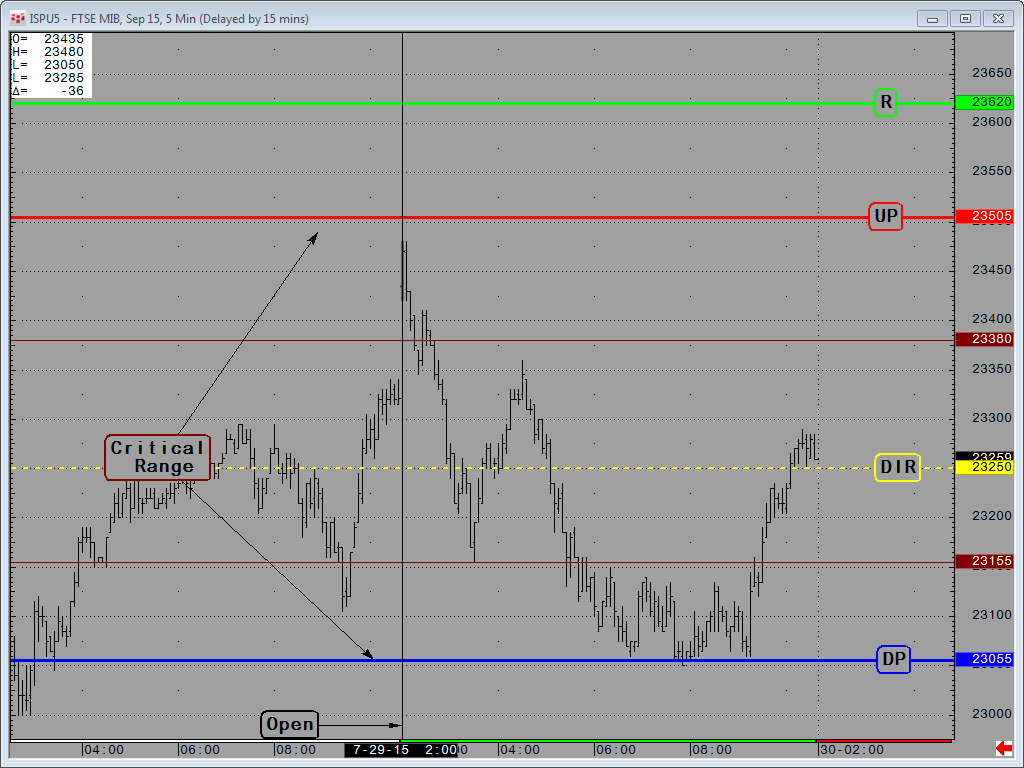
DIRECTIONAL
JULY 29 2015 – FTSE MIB
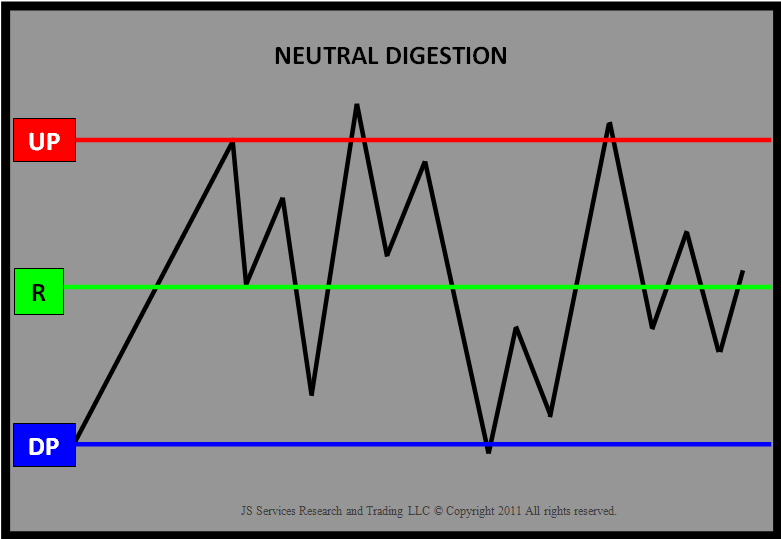
On the 29th the MIB was in a NEUTRAL DIGESTION market state identifying NON TREND condition. In NON TREND market state conditions we have a sideways expectation for price action. On the OPEN the MIB gaps higher against the R LEVEL bias and immediately turns in the direction of the R LEVEL bias. This example is interesting as the price action could not reach the R LEVEL and exhausted in front of the top of the CRITICAL RANGE at the UP (UPSIDE PIVOT). The market does not always give us what we want but it does tell us what it wants to do.
The price action around the 23380 * (CR+ = Critical Range + Minor Level) signaled a break in the OPEN positive momentum and the alignment with the R LEVEL bias. This signal, although a lower size opportunity, forecasts a “play” for the bottom of the CRITICAL RANGE at the 23055 DP (DOWNSIDE PIVOT). NON TREND market states have a sideways expectation to “digest” and the CRITICAL RANGE identifies the digestive extremes. After a “test” of resistance at 23505 UP and a break in structure at 23380 * in agreement with the R LEVEL bias, a lower forecast should be anticipated. The opposite would be true had the R LEVEL been below the market with a positive break in structure.
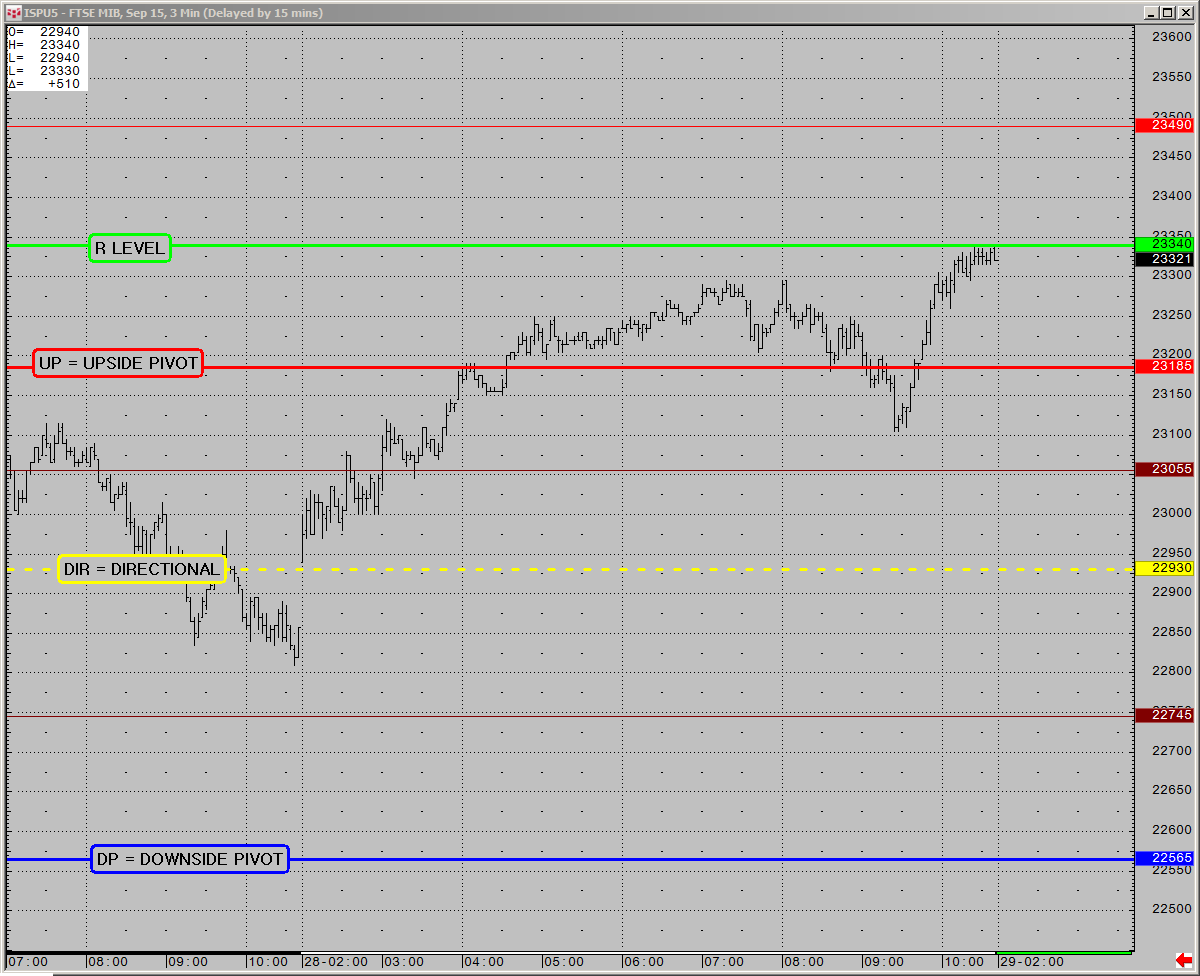
ROTATIONAL
JULY 30 2015 – FTSE MIB
On the 30th the index remained in a NEUTRAL DIGESTION market state but the equilibrium R LEVEL was balanced in the middle of the CRITICAL RANGE.
The R LEVEL equal to the DIR (Directional) is in a classic pivot point position, as the sentiment bias is basically “on the fence”. The market is indecisive or is preparing to make a move. Any Market State with the R=DIR should respect the pivotal nature of sentiment. Typically when the R LEVEL is in this position it will either just breakout and “go” producing a linear move or a difficult rotational trade will consume the market for the trade period. The price action in this session is an example of the later.
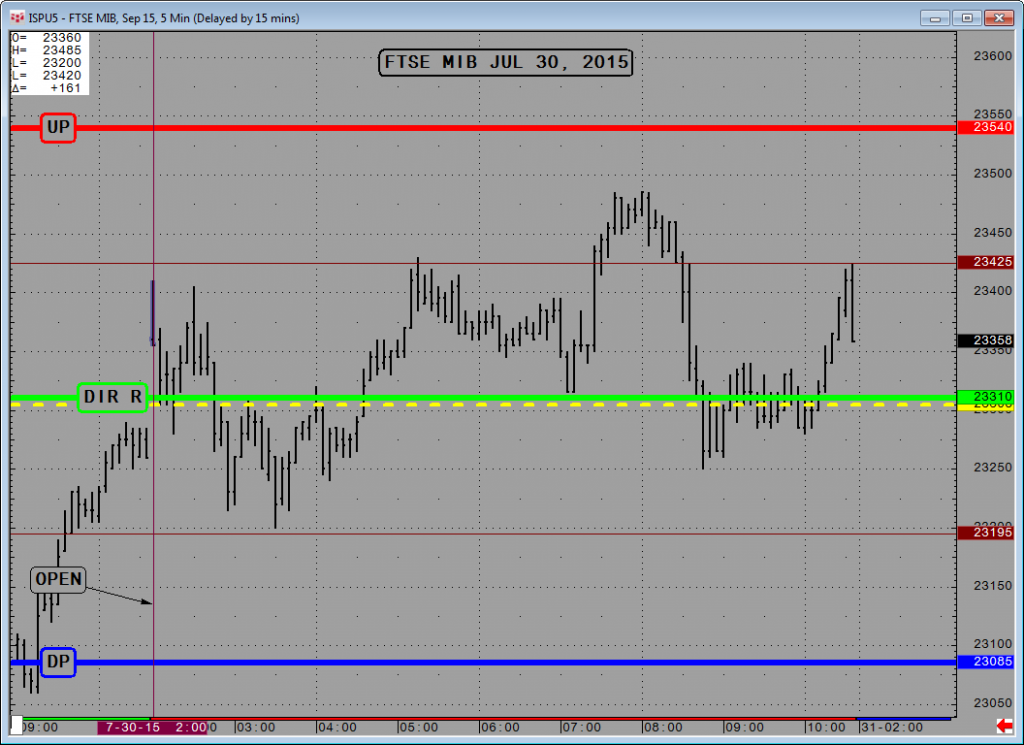
Note: When the R LEVEL = the DIRECTIONAL there is a higher probability that a rotational trade will occur, especially if there is a break in structure early in the session. This happened in the above example, after the OPEN above the DIR R LEVEL and then followed by a failure below. This “fact” and the bottoming out at the 23195 (CR- minor level) is a tell for a rise up to the 23425 (CR+ minor level). In a typical “coil” the rotational price action will be contained within the 2 minor levels (CR +/-) on either side of the DIR. In the above example the summer sideways trading condition provided a head fake to the upside but stayed true to form of the no follow through expectation of the NON TREND market state.