PlayBook Entry Strategy Tactics

Trade Entry Tactics

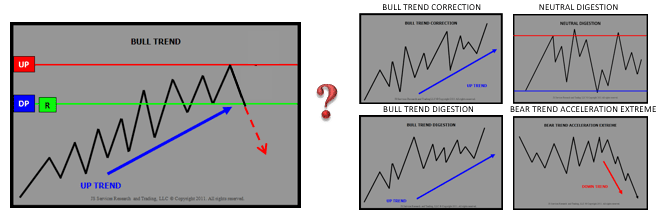
The PlayBook Strategy Themes represent the best risk defined opportunities for the trade session and are defined using 3 basic ENTRY tactics;

  • FADE momentum
  • BREAKOUT, trade with momentum
  • REVERSAL, false breakout exhaustive signal

entry-strat-1

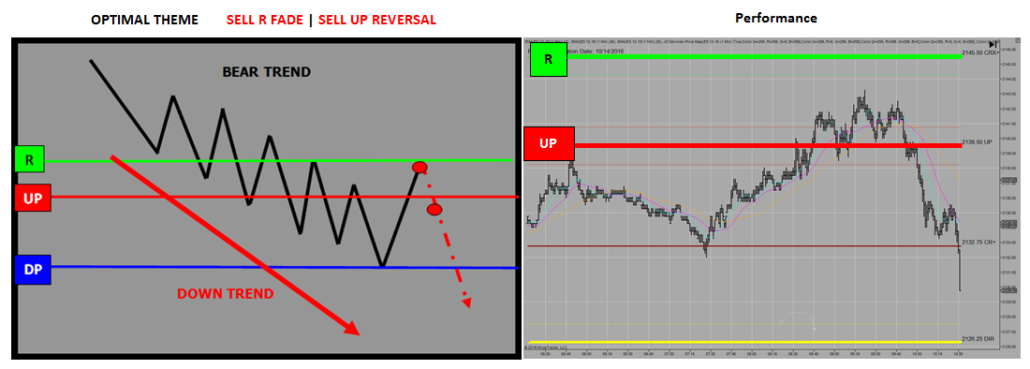
The naming schema for a PlayBook Trade Tactic BUY R FADE strategy reads as follows; looks to BUY the market at the R LEVEL using a FADE entry technique. This is a “theme” so the essence of the strategy is to FADE momentum into the R LEVEL area. Trading tactics and methods should be aligned with the basic properties of a FADE.

Risk Parameters

The Risk Parameters identify the area of influence or acceptance zone surrounding a trade entry level in which an opportunity remains valid when executing a specific trade tactic. The reason is that many profitable opportunities cannot be filled at the optimal entry level, in which case the surrounding acceptance zone is used to gauge if the fill price still presents an acceptable trade opportunity. The surrounding acceptance zone boundaries are defined by the AD (Alert Distance) and VAR (Variance) PriceMap Market Metrics offer a guideline for a systematic approach to the Trade Entry process by defining where to enter the market with the best chance to succeed with acceptable risk.

marketmetric-apmd-7

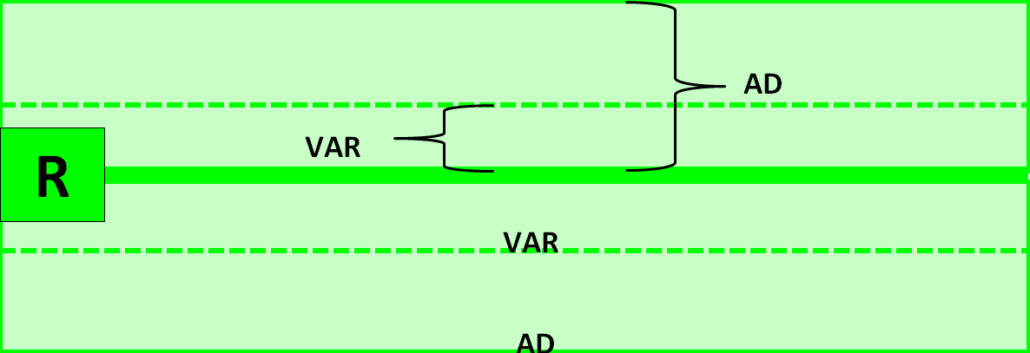
  • VAR (Variance) metric defines the variance surrounding a PriceMap level that should be considered “at the level”. This metric can be used for risk management but its primary function is to identify the optimal ENTRY area. The VAR is also the signal acceptance zone for a minor or validation level.
  • AD (Alert Distance) metric defines the signal acceptance area surrounding a Directional or Major PriceMap level. This metric also qualifies the structure thresholds for conditional alerts and stop placement for JSServices PlayBook strategy themes.

The Risk Parameters should be used to systematize the 3 main components of Trade Entry, the Conditional Alert, Entry Price and Exit Stop price.

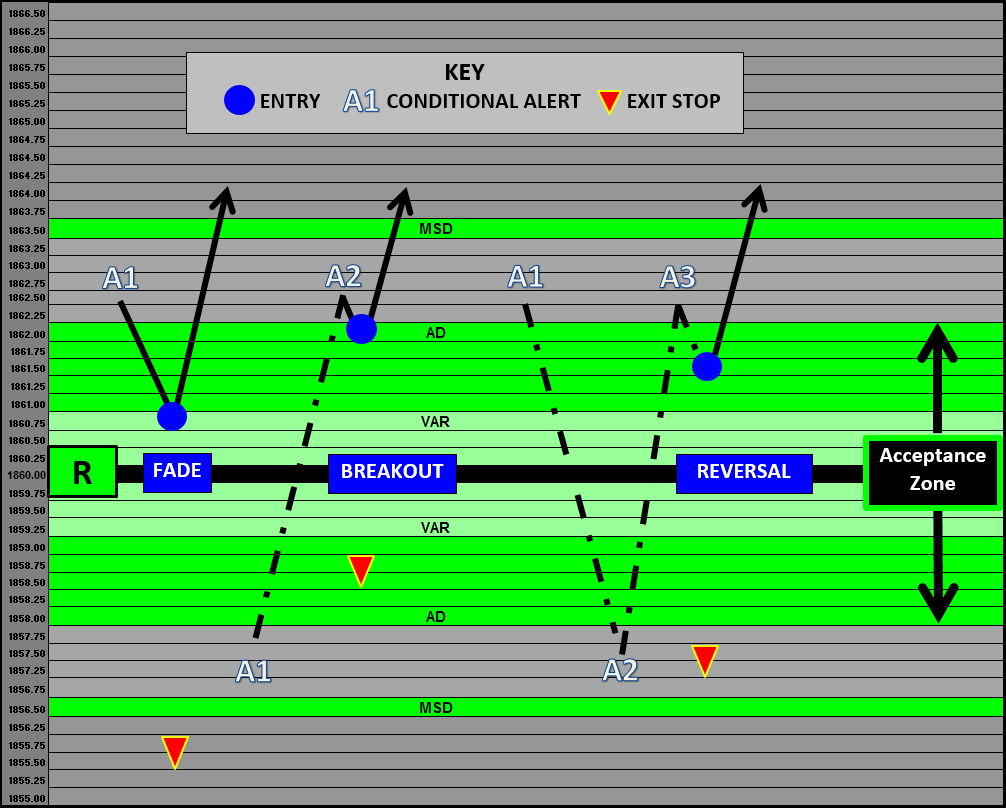
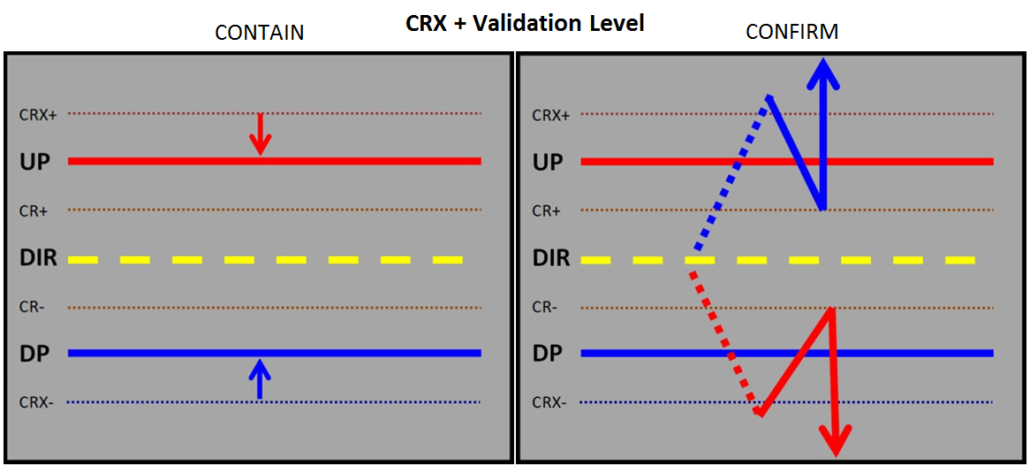
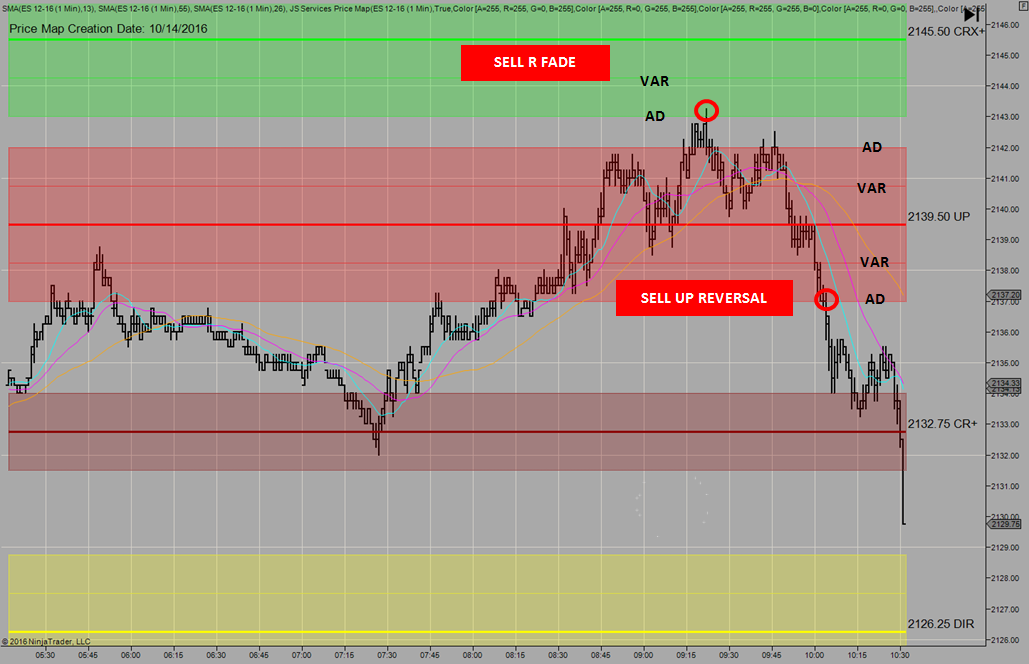
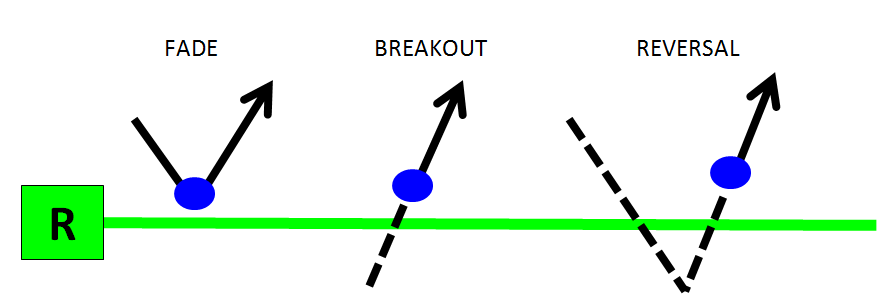
Example: The image above shows a basic textbook example of a FADE, BREAKOUT and REVERSAL Entry Tactic incorporating the Risk parameter Acceptance Zone.

Conditional Alert

The Risk Parameters are used to confirm a Trade Entry Tactic is “true” or valid.

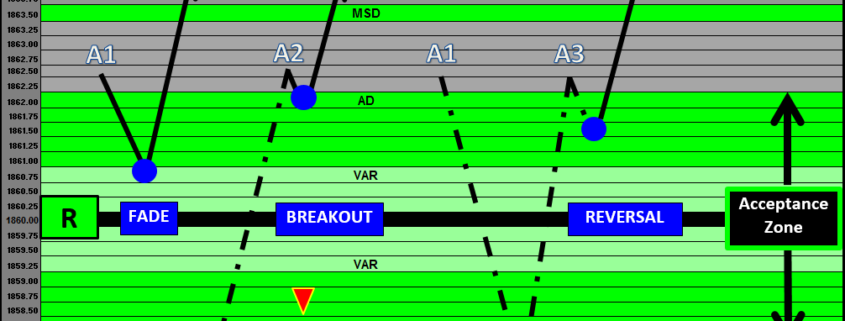
  • FADE technique is the most basic as it has only 1 conditional alert (A1). This is to confirm that the LTP (Last Traded Price) is “in front” of the PriceMap level so momentum can then be “faded” in the acceptance zone. The example above shows the AD (Alert Distance) being used as the A1 Conditional Alert.
  • BREAKOUT technique has 2 conditional alerts. A1 to confirm that price was qualified “in front” of the PriceMap level on the opposing side of the acceptance zone and then A2 to confirm a BREAKOUT through the PriceMap level creating a new bias. Once the BREAKOUT statement is “true” entry orders can be executed anywhere within the acceptance zone.
  • REVERSAL technique has 3 conditional alerts that must be met in sequence. Price must confirm that A1 is true first, then A2 and finally A3 to make the REVERSAL statement true. Once this occurs then entry orders may be placed anywhere within the acceptance zone.
Entry Price

After the Conditional Alert confirms the Entry Tactic the Risk Parameters can be used to systematize Entry orders within the acceptance zone.

  • FADE, in the example the BUY FADE entry is placed at the VAR (Variance) with the expectation that the momentum is going to press into the acceptance zone and afford an entry close to the PriceMap level.
  • BREAKOUT places an order at the AD as the expectation is that the new buy signal is going to just “ go” with a minimal pull-back.
  • REVERSAL order is placed in the middle between the AD and VAR as a balance between a “choppy” transition or a steady shift in momentum.

The example presented are basic guidelines which can be optimized by taking into consideration the characteristics of the market state, the position on the PriceMap framework, the Strategy Theme the trade is aligned with and the dynamic micro structure of the order book.

Exit Stop Price

The Risk Parameters Market Metrics VAR, AD, and MSD can be used as parameters to set Exit Stops. Reward expectations should be considered when selecting which metric to use for an Exit Stop. The stop should never be placed “at the metric” as this represents the boundary limit which is anticipated to be tested but not broken. As a rule of thumb a minimum 1-3 tic variance through the metric should be used to avoid getting “dinked” at the risk parameter extreme. Price Structure and the order book dynamics can be used to optimize stop placement as well as entry

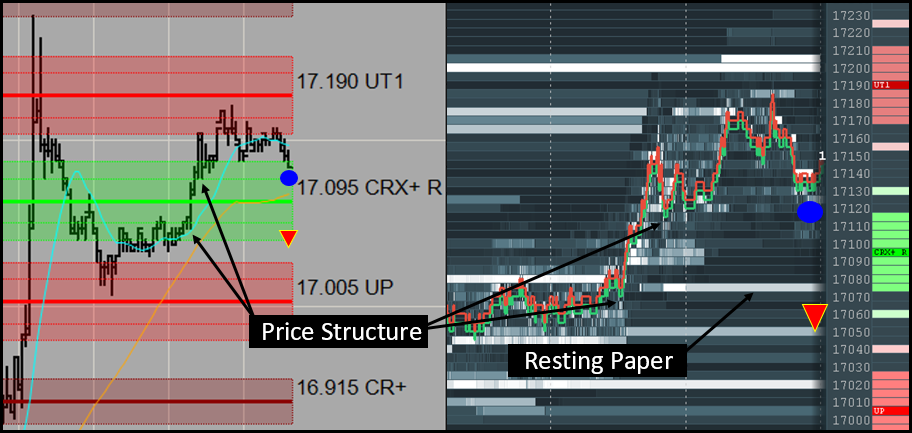
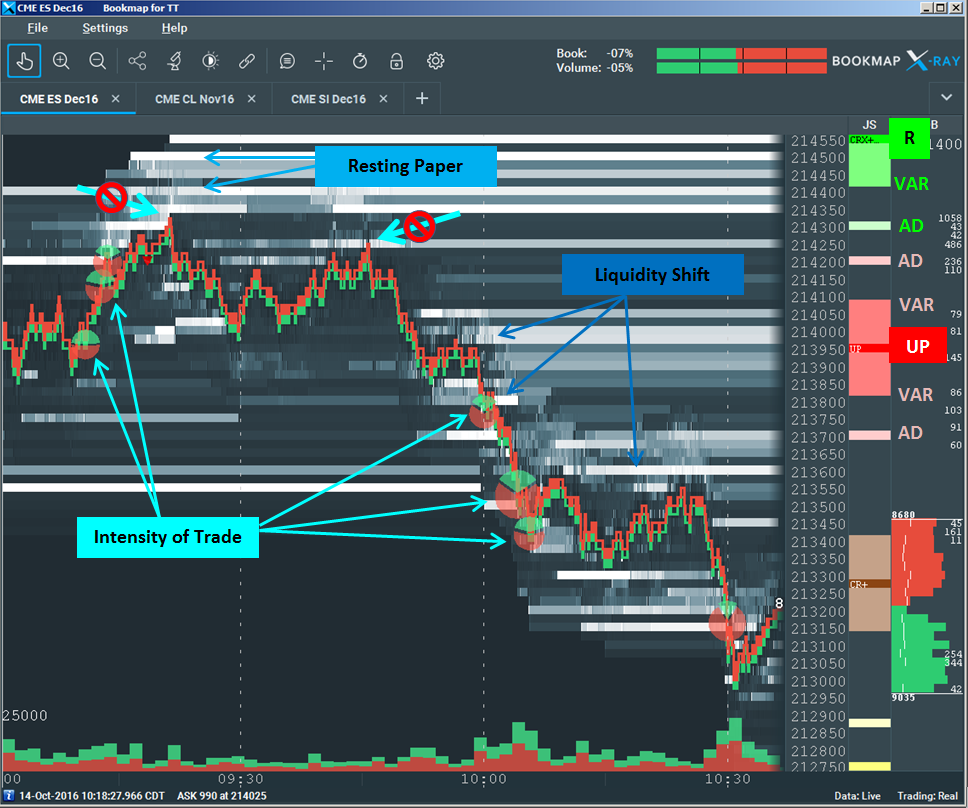
The image above shows how Entry and Exit Stop orders can be optimized when price structure and resting paper in the order book are in alignment with Risk Parameters.

General Thoughts on Trade Entry Tactics

  • Awareness of the Risk Parameters provides additional insight and clarity to the current condition.
  • Signal acceptance should be limited to within the AD (Alert Distance) acceptance zone.
  • Entry within the VAR acceptance zone should be considered optimal.
  • Trading outside the acceptance zone assumes much higher risk and slippage and should be avoided.
  • The opposing VAR and AD can be used for STOP placement. The placement of such orders can be optimized with price structure confluence. In fact when price structure and market structure metrics are aligned it signals a good risk based opportunity.
  • Historical resting paper in the order book that is in alignment with Risk Parameter Market Metrics  can be used to optimize Stop Exit placement by adjusting stops through the liquidity.
  • If an ENTRY LIMIT order is placed too close to the PriceMap Level, the strategy will “miss” opportunities (winners), that “just didn’t make it” to the point of entry but will participated in all of the losers because market went through the PriceMap level.
  • If you want to have a position it is best to enter the MKT at the AD and then average in with a lower entry at the VAR. Ideally the micro structure of the order book should be used to optimize ENTRY orders with supporting liquidity events.


Optimizing TradeTactics

TradeTactics can be optimized when executed within market metric thresholds and their effectiveness improved by using real time order book events that identifying areas of intensity of trade, resting paper and liquidity shifts.

Overview

  • Market Metrics are the price thresholds for signal acceptance around a PriceMap level.
  • Intensity of trade is defined as an increased flurry of activity that is supported with good volume. This is displayed as a volume dot or circle on our integration partner platforms.
  • Resting Paper identifies price levels that have a significant amount of volume that has been “resting” for some time that identifies potential support or resistance.
  • Liquidity Shifts identify significant increase or decrease in volume at a specific price point which signal an increase or decrease to interest that that level.

Practical Application

Order book events provide insight for two types of events:

  1. Momentum REVERSAL
  2. Momentum BREAKOUT

When order book events occur within market metrics thresholds they provide additional clarity for TradeStrategies that have been normalized to specific PlayBook Themes. Performance is enhanced and the effectiveness of TradeTactics is optimized by incorporating order book events within market metric thresholds.

The following is a practical application of combining order book dynamics and market metrics to optimize execution tactics of a PlayBook strategy theme.

PlayBook ExampleES PlayBook Oct 14 2016

es-full-pb-oct-14-2016

R=CRX+

In the PlayBook example above the ES is in a BEAR TREND with the R LEVEL above the market at the CRX+. In this market structure bias (MSB) the negative sentiment of the BEAR TREND will remain intact below the CRX+ R LEVEL. The CRX+ is a validation level that will confirm or deny an upside CriticalRange BREAKOUT.

10-18-2016-2-51-10-pm

The FACT that the R LEVEL is equal to the CRX+ and is in the context of a BEAR TREND market state, makes it more likely that the CRX+ will contain an UP BREAKOUT. The R LEVEL in this position creates a “resistance band” to FADE momentum and accept exhaustive signals within the CRX+ – UP price band, anticipating a resumption of the BEAR TREND condition.

Optimal Strategy Theme

The OPTIMAL PlayBook Strategy Theme for the market structure bias is a SELL R FADE and a SELL UP REVERSAL. These strategies are in alignment with the general underlying BEAR TREND outlook that looks for sell signals below the R LEVEL.

The image below shows a successful performance for the Optimal Strategy theme for the ES on OCT 14 2016.

orderbook-int-trade-post-1

Market Metrics

By incorporating market metrics and the dynamics of the order book TradingTactics are optimized and performance enhanced. The image below shows the PriceMap overlay with market metric identifying the area of signal acceptance for the SELL R FADE and SELL UP REVERSAL.

orderbook-int-trade-post-2

Using the above image:

  • SELL R FADE – The market metric AD (Alert Distance) should be use as the initial entry for any FADE STRATEGY (R-AD in this example). By definition a FADE anticipates momentum to turn “in front” of the figure. Entry TradingTactics are enhanced by aligning them with the metrics that define the optimal threshold for signal acceptance. Without this intelligence good trades are missed which did not “make it” to the figure. By definition the “best” FADE is one that “exhausts” in front of the figure within the Alert Distance and Variance (VAR) Market Metrics.
  • SELL UP REVERSAL – A REVERSAL by definition is a “false breakout” that 1st violates a PricMap level and then trades back through it. The market metrics can be used to confirm a REVERSAL using the AD (Alert Distance) on both sides of the figure. First to signal a breakout by having price action exceed the UP+AD and next to confirm the exhaustive failure or REVERSAL by trading back through the UP-AD.
Order Book Dynamics

Order book dynamics optimize TradeTactics by providing key intelligence to the facts of the moment. The PlayBook identifies specific macro themes that TradeStrategies can be aligned to and normalized at specific PriceMap action levels. Market metrics define “where” a potential shift in momentum or state will occur by outlining the threshold of signal acceptance. Order book dynamics complete the optimization process by improving timing and identifying “when” an opportunity will occur and if it is valid. The image below shows how incorporating the micro structure of the order book enhanced the effectiveness of the execution of the SELL R FADE and SELL UP REVERSAL PlayBook Strategy Themes.

orderbook-int-trade-post-3-bm-2

Using the above image:

  • SELL R FADE – The context of the PlayBook Strategy Theme “FADE” and normalized PriceMap entry level “R” provide an expectation to anticipate a rejection from the R LEVEL which is the price point that represents the peak for any corrective action of the BEAR TREND state. The market metrics further improve vision by identifying the threshold area surrounding the R FADE to anticipate a rejection. Using this intelligence as the macro context of the SELL R FADE opportunity the order book dynamics provide the micro confirmation.
    • Order Book Events
      • Intensity of Trade – As price action breaks out above the UP there is a flurry of buying in-front of the R-AD metric. As the MKT trades into the signal acceptance area (R-AD) there is less intensity identifying a divergence of interest.
      • Resting Paper – A “wall” of resting paper builds up within the R-AD metric confirming an area of “resistance” which confirms the validity of the R LEVEL itself.  A re-test of the high area does not generate any intensity signaling a divergence in interest and confirming the SELL R FADE.
  • SELL UP REVERSAL – The “wall” of resting paper above the MKT gives a “more likely to occur” expectation to a negative turn and a resumption of the BEAR TREND. The macro context of the market state and structure provides trade vision that a REVERSAL from the UP would not only confirm the SELL R FADE strategy but would also generate a new sell opportunity with the potential to be the start of the next extension lower.
    • Order Book Events
      • Liquidity Shift – This event provides a “tell” that a new trend is developing by shifting liquidity down. In a prelude to a REVERSAL opportunity after a rejection from the R LEVEL a negative liquidity shift offers a chance to anticipate a failure from the UP-AD and get into a trade early with the order book shift.
      • Intensity of Trade – A failure from the UP-AD metric signals a SELL UP REVERSAL strategy which when supported by intensity of trade confirms the event and is similar to validating a BREAKOUT.
      • Resting Paper – It is interesting to note that prior to the UP-AD failure, resting paper below the market began to “move out of the way”, which was another “tell” confirming the negative sentiment shift and underlying dominance of the BEAR TREND condition.
Summary

Observing price action within market structure in the context of the market state and underlying PlayBook strategy themes provides a macro foundation for TradeTactics which can be optimized by incorporating market metric thresholds and order book events. This combination of macro structure and micro structure offers the best results in creating more effective execution of TradeTactics.

Market State Transition

MARKET STATE TRANSITION

A market STATE condition as a definition does not change and is the same from day to day or from market to market regardless of asset class. A BULL TREND STATE will always be classified as a trending market that has positive higher move high higher move low structure. That is the definition of what a BULL TREND “is”. If the market is not maintaining positive structure then the definition is no longer true and signals that the market is transitioning into a different STATE. In a general sense markets that are performing to their STATE expectation are easier to anticipate verses markets that are not performing to expectation and are transitioning into a new market STATE.

We do not know when a market will transition to a new market STATE but we do know where it will make a decision to do so or not. It is at the market STRUCTURE points that define the price alignment the STATE that the market will make a decision for the current STATE to persist by holding structure or break structure and transition to a new MARKET STATE.


holdstructure_v03

Hold Structure

bearstructure_v03

Break Structure

If price action holds STRUCTURE, it is a sign that the attributes of the market STATE will dominate price action. A break in STRUCTURE is a signal that the market is in transition to a new STATE. Markets that hold STRUCTURE are easier to predict as the context of the trading condition is known. Markets in transition that break STRUCTURE are more difficult to predict as the characteristics of the condition are fluid and not defined.

Market Strategy Insight

FACT FOUNDATION

When you look at a chart at the end of the day the price action seems self-evident even though at the moment it was anything but. The reason is that the trade vision at the moment is clouded with bias and opinion hiding what the market is “telling” you what is wants to do.

When we view the market with a fact focus, though a MARKET STATE lens, the “tells” are revealed in real time by the price action within the MARKET STRUCTURE, identifying the STRATEGY THEMES that are dominating the session so opportunities can be anticipated and trading tactics aligned.