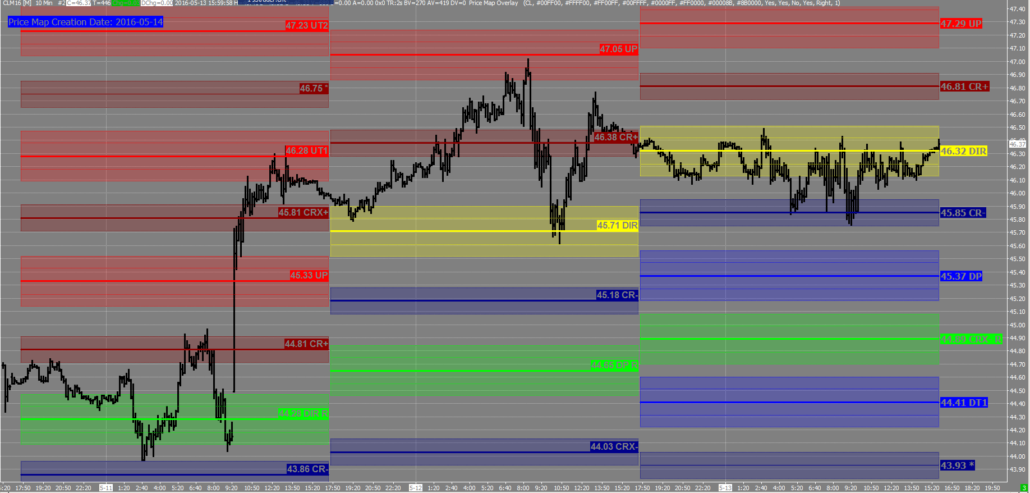
PriceMap Qualifiers CriticalRange
CriticalRange
The PriceMap defines the structure of the market state by identifying the key price band or CriticalRange for the trade period. The Upside Pivot [UP] and Downside Pivot [DP] directional levels encapsulate the CriticalRange which will behave like key resistance and support levels, defining the behavioral area of indecision or neutral zone for the trade period.
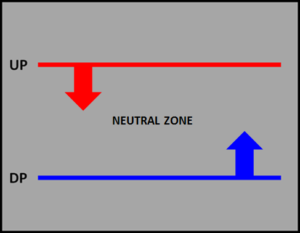
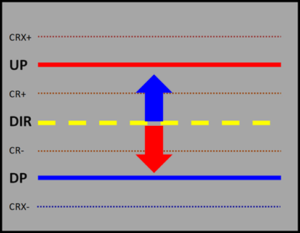
The CriticalRange is broken up into 6 quadrants, defined by a directional level mid point and minor levels on either side of the UP and DP. This structure and the inherent meaning of each level are key to interpreting market “tells” in real-time.
DIRECTIONAL
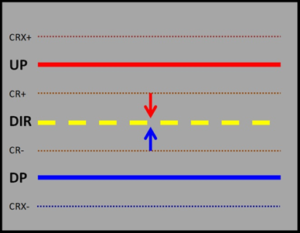
The DIR (Directional) is the mid-point of the Critical Range but is not necessarily symmetrical. The DIR acts as a classic pivot point for the trading session that the market will rotate around to find its immediate bias within the CriticalRange.

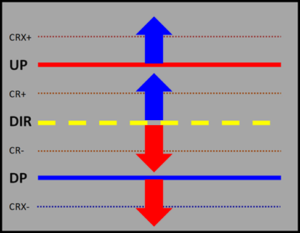
A held trade above the DIR gives the market a positive lean and below negative, targeting the UP and DP CriticalRange extremes. Trading within the CriticalRange represents a neutral posture for the market. A breakout of the CriticalRange signals a directional bias and possible trend move for the session.
CR + and CR –
The CR+ and CR – define the interior quadrants of the CriticalRange. These minor levels will come into play as the market rotates around the DIR, either tightening the coil of a digestive trade or preparing for a transitional BREAKOUT.
- Classic rotational trading within the CR+ and CR- range is typical for NON TREND type consolidation prior to a move. A market that has tested both the CR+ and CR- and has maintained the integrity of each, is a “tell” that a sideways trade will persist producing a NON EVENT session.
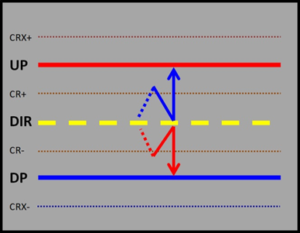
- A breach of the CR+ or CR- after a rotational trade around the DIR will give the market a bias targeting the CriticalRange parameters (UP/DP). If the signal is valid and “ready to go”, price action will maintain structure at the DIR after a CR+ or CR- breach. If it does not, it is a sign of digestion or potential reversal.
CRX + and CRX –
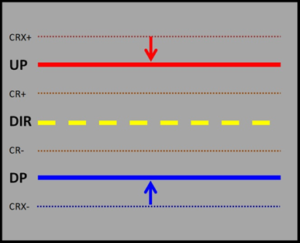
The CRX +/- are the Critical Range Breakout extremes. These are the price points that must be taken out to confirm a structural break or “Breakout” and can result in good exhaustive extremes.
- Exhaustive Extreme – The CRX+ and CRX – identify the CriticalRange thresholds and represent an exhaustive extreme for any false CriticalRange BREAKOUT. If the integrity of the CRX + or CRX – remain intact any BREAKOUT signal must remain suspect. These levels can be used as stop levels for any FADE or REVERSAL strategy at the UP or DP as they are the “squeeze” high or low for any momentum exhaustion.
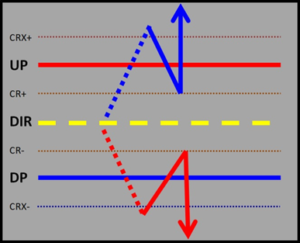
- Structure Break – The CRX+ and CRX – identify the confirmation points that must be violated to confirm a BREAKOUT. Once the CRX + or CRX – has been violated the market should maintain that bias above or below the respective CR + or CR-. The best BREAKOUT scenarios have the market hold structure above the UP or below the DP and just “go” with only one shot, if any, after a CRX +/- violation. Trading back inside the CriticalRange to the CR + or CR – will take some of the energy away from the BREAKOUT signal and is a “tell” for more of a “stop and go” trend condition.
PRACTICAL APPLICATION
* Use the price action within the CriticalRange to provide insight to the markets next move.
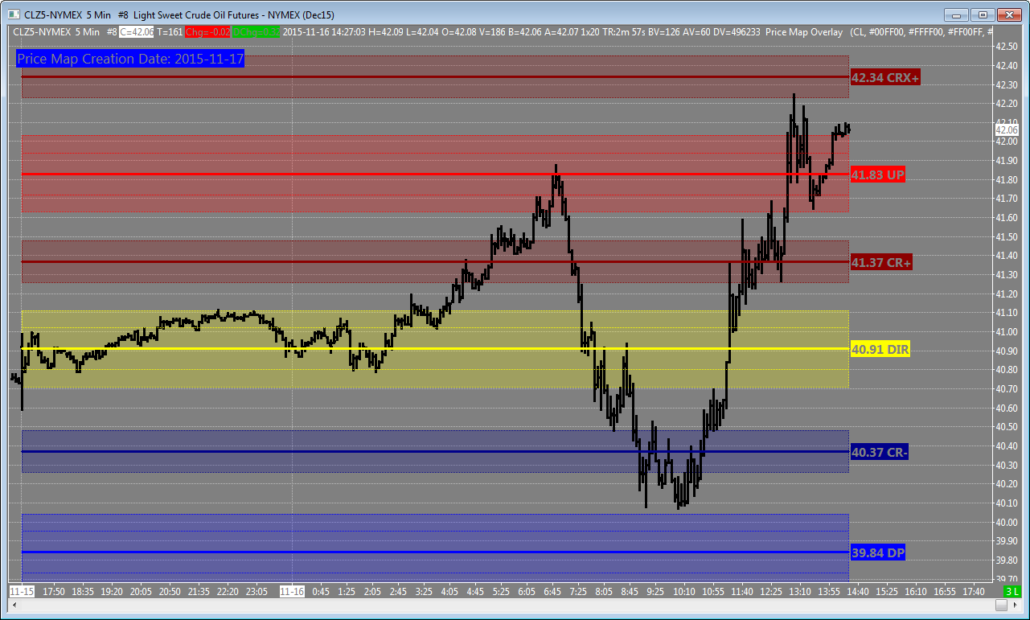
* Use the CR +/- and the CRX +/- to confirm or deny a trend move.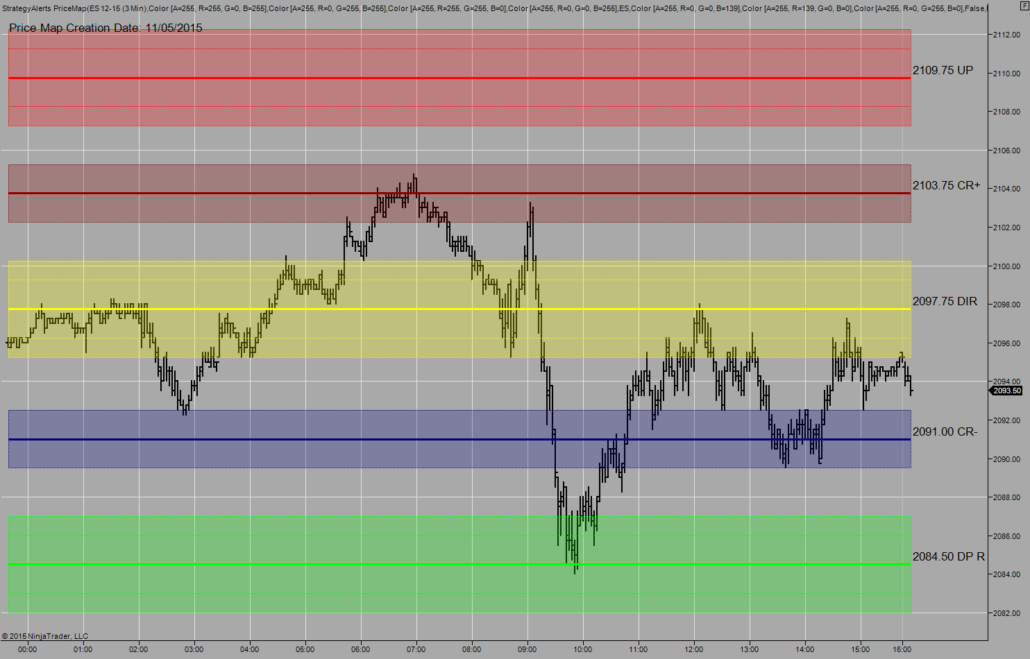
* Note tactic signals at these minor levels for position management of STRATEGY themes.
