Creating a Structured Trading Approach

JSAnalytics offers a foundation to create a more structured trading approach. It does this by providing the basic ingredients needed to make any clear decision – facts. In terms of trading the analytics are objective quantitative measurable market truths. The numbers “don’t lie” and need no subjective interpretation. No matter what your opinion is, the facts remain the facts. For a trader this is powerful, as our internal dialog is always second guessing if the decisions we have made are correct. Without a benchmark “fact check” it is easy for emotions to influence trading and cloud the decision making process . By creating a structured trading approach built on a fact foundation doubtful emotions are replaced with confidence and resolve. Market movement is seen for what it is with no emotional attachment. Execution of a trade plan is methodical and structured. The process offers a quantifiable way to measure performance and improve consistency, as every decision made can be compared to the same decisions made in the same context and structure. As a trader you are an observer of real time market movement within defined context and have a structured trade plan to anticipate and capture opportunity as well as a framework to improve the process of doing it.
How do you get started creating a more structured trading approach? By aligning trading tactics and methods to a FACT FOUNDATION.
There a 3 factual contexts that every trader and trading system must account for and be aligned with:
- The current market STATE and the characteristics that define it.
- The current STRUCTURE and its influence on the STATE expectations
- The STRATEGY themes that are inherent in STATE and STRUCTURE bias dynamic
JSServices identifies a markets STATE, STRUCTURE and STRATEGY themes as the FACT FOUNDATION to create a more structured trading approach with is MarketColor, PriceMap and PlayBook analytics.
![]()
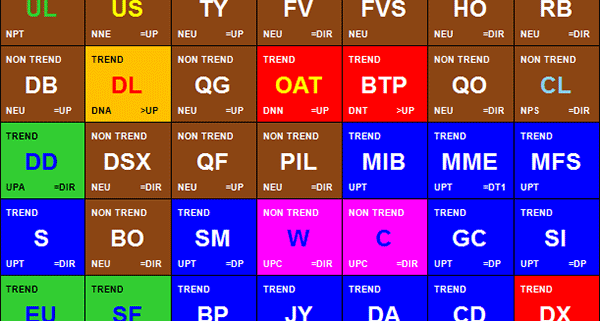
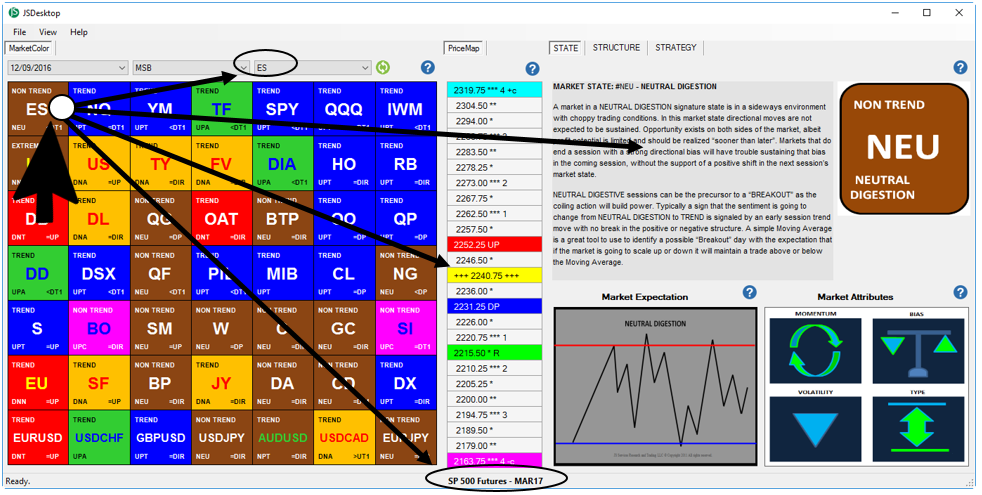
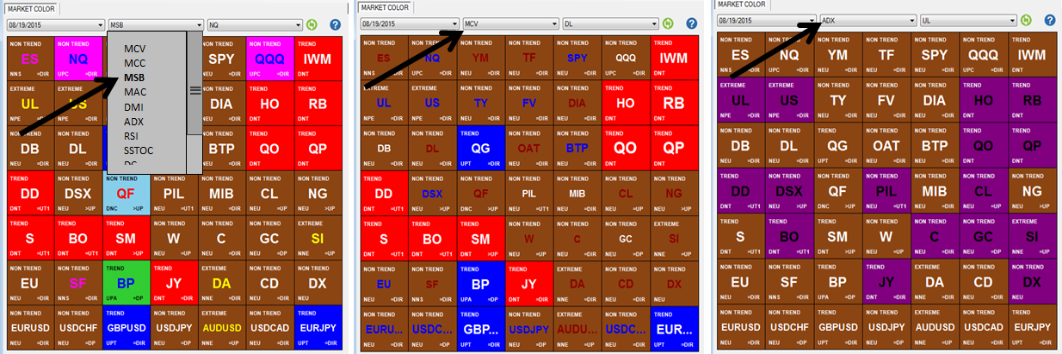
MarketColor defines the context of the current condition or market STATE. It is the underlying “technical” tone or environment. Just as a professional athlete will alter their tactics based on weather conditions, playing surface and opponents strength, so to a trader must standardize trading methods to the characteristics of the market STATE. MarketColor objectively provides these facts so a structured approach can be developed for each uniquely classified market STATE condition into a simple IF/THEN approach. IF its rainy, cold and playing on a natural field THEN the strategy is to play more conservatively. IF playing indoors on artificial surface THEN execute a faster strategy. In trading it as not as simple as this as the context or STATE can change during the “game” session. We need more facts than just what the characteristics of the condition or state “is” we need to know when those conditions or facts are changing or are no longer true. For this we need to know what the STRUCTURE is that defines the market STATE or the JSServices PriceMap.
![]()
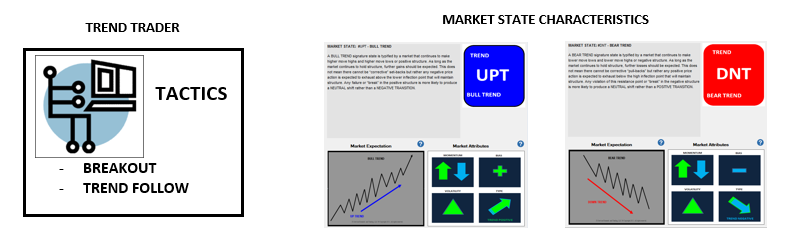
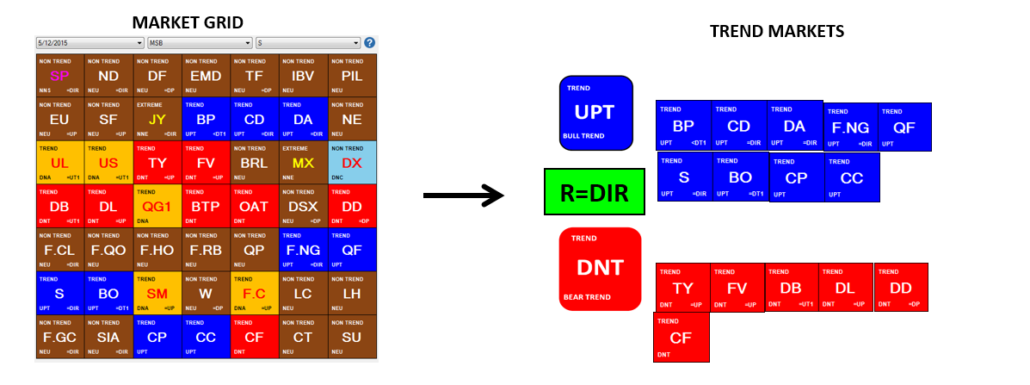
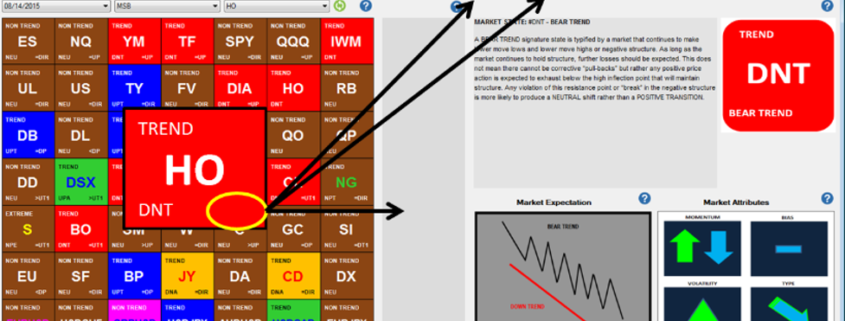
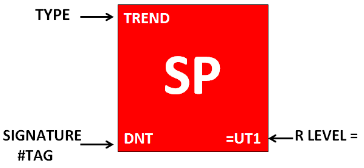
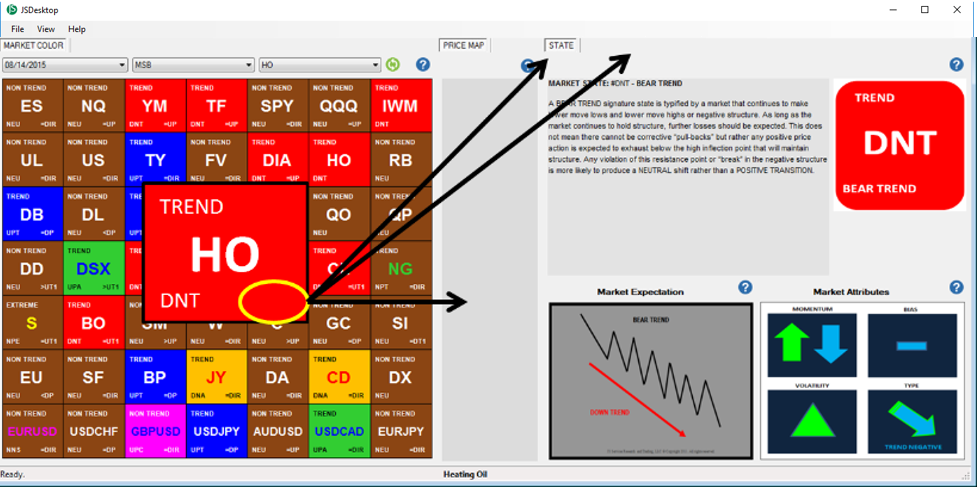
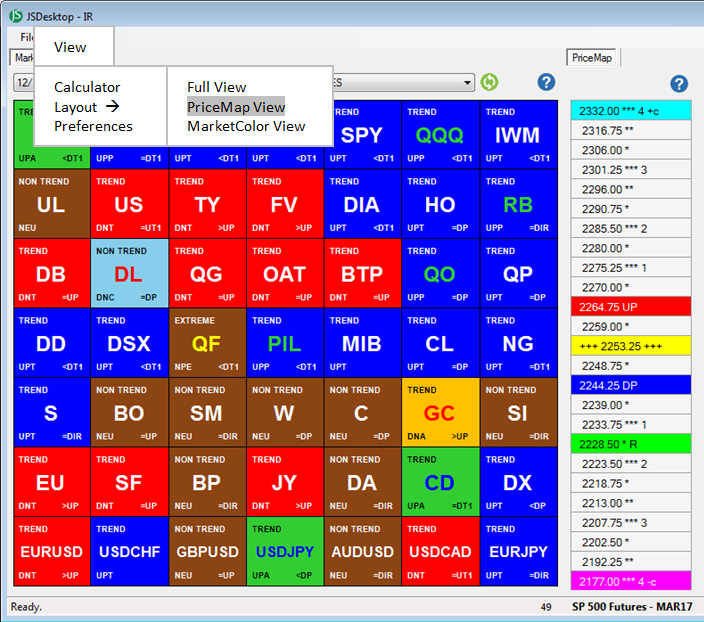
Market STRUCTURE is the price framework that defines the market STATE. As long as price action is holding STRUCTURE then the definition of the STATE is true and the characteristics that define it should be expected to influence trading conditions. If price action is not holding structure it is a “tell” that the market STATE is in transition to a new STATE and trading conditions are changing. In general markets that hold structure are easier to predict as their characteristics are known. The characteristics of a market that is transitioning to a new STATE are not as clear as we do not know what STATE the market is transitioning into. The market STRUCTURE framework or PriceMap identifies the price points where the market will make a decision to hold structure and persist or break structure and transition. It is at these price points where liquidity is the highest, risk is the lowest and opportunity the greatest. The PriceMap provides the framework to create a structured trading approach that is unified across all markets. To achieve alpha however we must anticipate opportunity and have a STRATEGY that differentiates the value between opportunities. We need a guide or “PlayBook”.
![]()
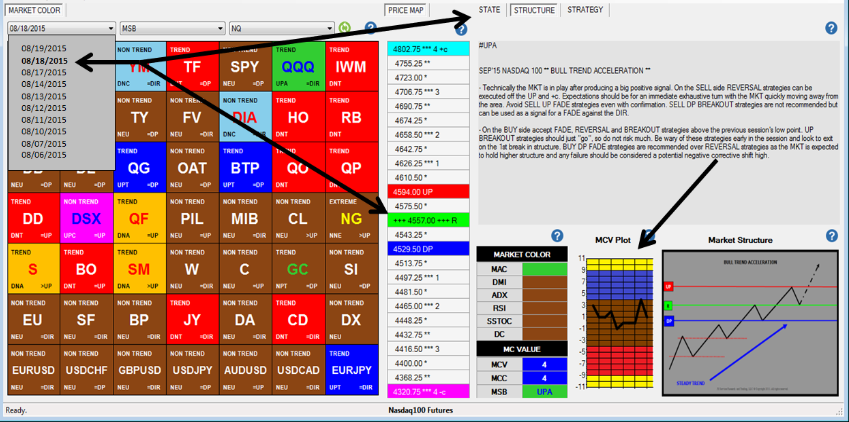
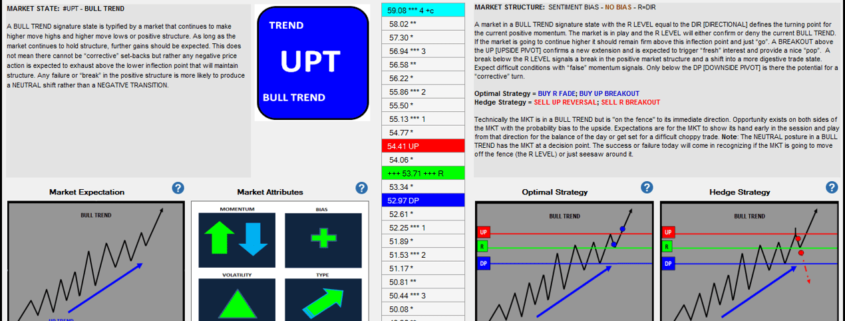
JSServices PlayBook offers an objective FACT FOUNDATION to improve consistency by identifying the STRATEGY themes that are expected to dominate price action. IF the MKT is in this STATE with this STRUCTURE THEN this is the optimal STRATEGY. If however there is a break in STRUCTURE then this HEDGE STRATEGY should be executed to capture the shift in STATE. The PlayBook removes the question of “What to do?” by presenting the best opportunity for the current STATE and STRUCTURE bias. Professional sports teams have certain plays designed for certain defenses, position on the field or time left on the clock. These plays are structured, optimized, practiced and executed consistently. During the playoffs is when we really see the beauty of a well orchestrated game plan executed by the victor. Every series the correct “play” is matched with the context of the game at the moment. As a trader your are the coach or director of your team of tactics. By having a FACT FOUNDATION you know the STATE expectation and characteristics prior to playing the game. With trading however you do not need to play every play and can be selective to only participate in STRUCTURES that favor your success. When you do trade it can be with STRATEGIES that have been optimized through consistent execution in the same STATE and same STRUCTURE no matter what market or asset class.
Trading is one of the most difficult, exciting, demanding, fulfilling businesses. Without a structured approach the challenging aspects of trading can quickly overwhelm frustrate us. When trading is done with a structured approach however the positive attributes of the vocation begin to shine and feed on themselves providing clarity to every individuals unique path to success.
Request a demo of our Desktop application which will allow you to integrate al JSServices analytics into your workflow and create a more structured trading approach.