R LEVEL – Market Structure Bias (MSB)
SENTIMENT BIAS – The R LEVEL
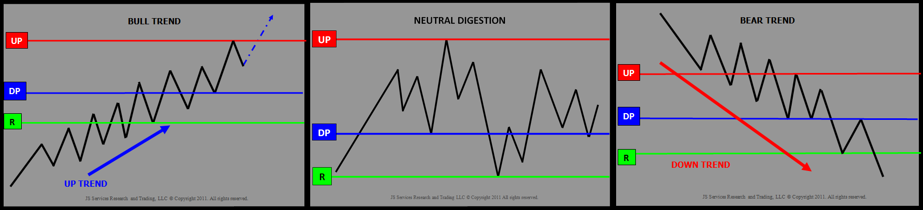
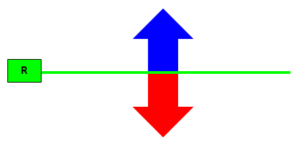
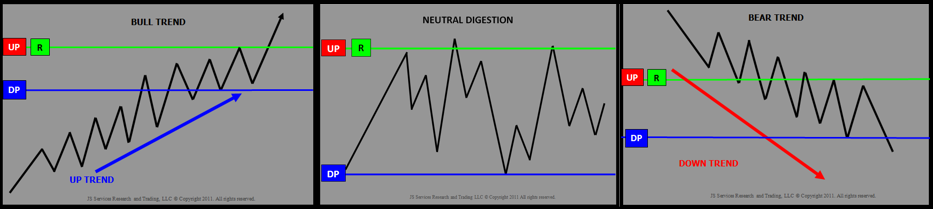
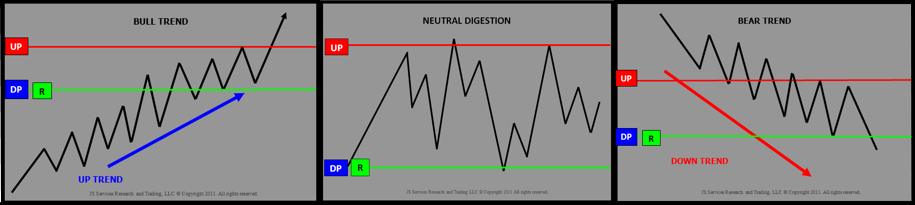
The R LEVEL [Reversal Level] is the “Over-Under” number for the trade period. Trading above the R signals a positive buy break bias and trading below the R signals a negative sell rally bias. This is the inflection point where sentiment shifts from positive to negative and vice versa.
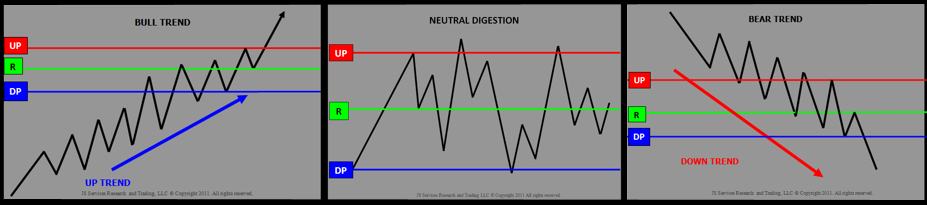
The R LEVEL is the most significant price level on the PriceMap as it defines the session bias and is the best actionable starting point when using the analytics. Traders should be aware of price activity in relation to the R level and note if the current action is with or against the bias. In a general sense, signals in the direction of the R bias should be expected to be smoother, with follow through potential, and signals against the R bias to be more laborious and unlikely to be sustained.
Market Structure Bias (MSB)
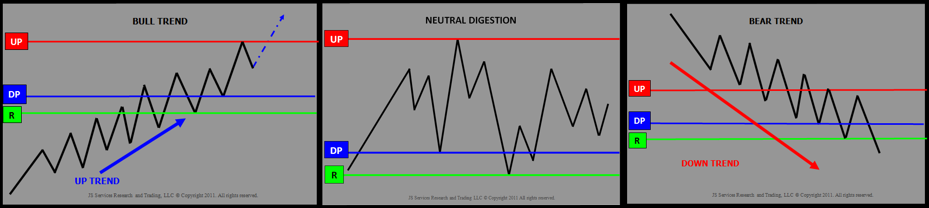
The R LEVEL represents the sentiment bias for the trading period which further defines the market State expectation by its position on the PriceMap. Where the R level is on the PriceMap Framework will skew the condition of the market state and define a Market Structure Bias (MSB). There are 9 potential R LEVEL positions on the PriceMap Framework each with its own unique influence on the current condition. Trading tactics should be aligned with the MSB skew to improve their effectiveness.
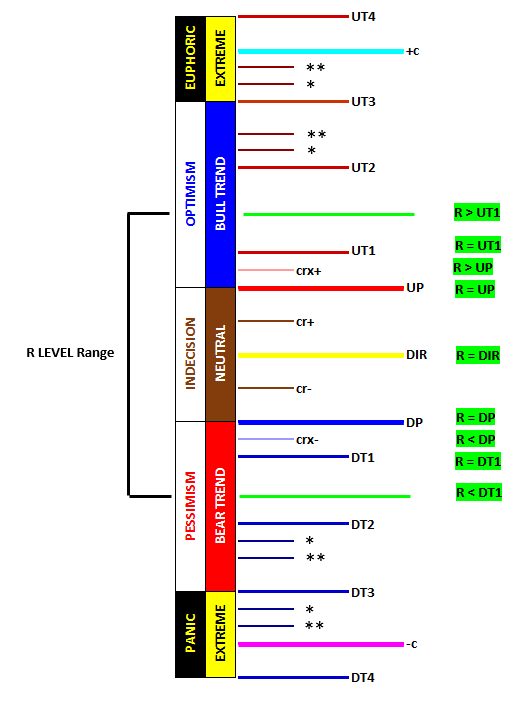
PriceMap Framework R LEVEL Positions
Market Structure Bias (MSB) R LEVEL positions
R =DIR
The R LEVEL equal to the DIR (Directional) is in a classic pivot point position, as sentiment is balanced or “on the fence”. The market is indecisive or is preparing to make a move. Any market State condition with the R=DIR structure bias should respect the pivotal nature of sentiment. Typically, when the R LEVEL is in this position it will either just breakout and “go” producing a linear move or a difficult rotational trade will consume the market for the trade period within the CR+ and CR- validation levels.
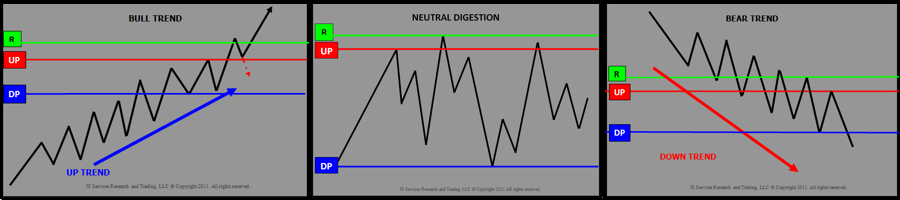
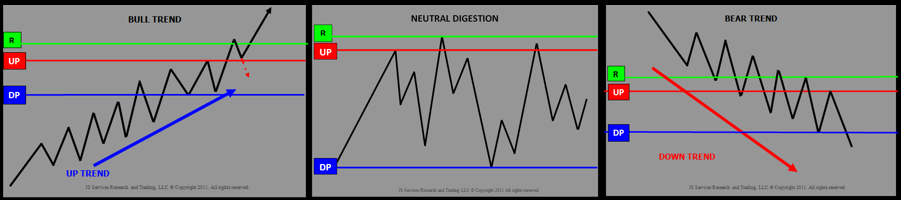
R=UP
The R LEVEL at the top of the Critical Range defines a “hard” resistance point at the UP (Upside Pivot). Energy is centered at this price point and a violation should be expected to produce sharp interest. A downside failure below the DP (Downside Pivot) however should NOT be expected to have the same energy and have a more measured expectation. This structure bias identifies a corrective expectation for positive trend type states and the optimal entry area for negative trend states.
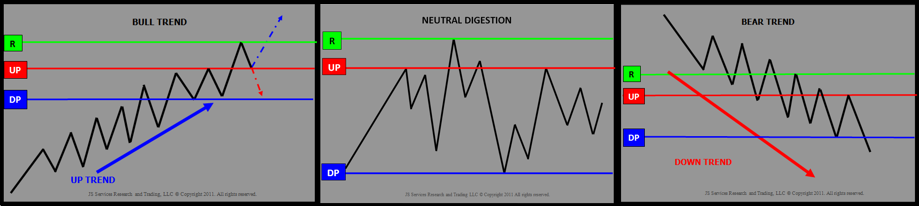
R >UP
The R LEVL above the UP but less than the UT1 creates a RESISTANCE BAND with the UP. Trading tactics should focus on the entire zone for signal acceptance. Typically this would be on the sell side as this is a resistance band but will transition into a support band if the market violates the R LEVEL and starts to transition higher. This structure bias identifies a corrective expectation for a positive trend type states and the optimal entry area for negative trend states.
R =UT1
The R LEVEL = to the UT1 (Upside Target #1) creates an even wider resistance band with the UP. Signal acceptance anywhere in the price band is acceptable however it is best to commit to opportunities closer to the UP or UT1. As the R LEVEL moves farther outside the CriticalRange the energy in the market place is skewed higher. Any lower price movement should be expected to be move measured and any positive turn from lower levels should be expected to target the R LEVEL. This structure bias identifies a corrective or digestive expectation for positive trend type states with the R LEVEL defining current lid for the underlying positive momentum. For negative trend states the R LEVEL identifies where the real selling energy is and the optimal entry area to get back on the down trend.
R >UT1
The R LEVEL above the UT1 identifies the high point for any price squeeze against the underlying trend if it is going to resume in the session. A market in this position has an underlying negative tone and any sell signals within the UP to R LEVEL range, are an actionable opportunity. Sales below the DP is a lower value opportunity and the threat of a corrective squeeze up to the R LEVEL is real. Typically the market will attempt some type of corrective move when the R LEVEL is in this position. A good “tell” is either an exhaustive REVERSAL signal at the DP or a transitional positive BREAKOUT at the DIR targeting the R LEVEL.
R =DP
The R LEVEL at the bottom of the Critical Range defines a “hard” support level at the DP (Downside Pivot). Energy is centered at this price point and a failure should be expected to produce aggressive offers. An upside breakout above the UP (Upside Pivot) however should be expected to NOT have the same energy and any upside breakout to be more measured. This structure bias identifies a corrective expectation for negative trend type states and the optimal entry area for positive trend states.
R <DP
The R LEVEL below the DP but greater than the DT1 creates a SUPPORT BAND with the DP. Trading tactics should focus on the entire zone for signal acceptance. Typically this would be on the buy side as this is a support band but will transition into a resistance band if the market violates the R LEVEL and starts to transition lower. This structure bias identifies a corrective expectation for a negative trend type states and the optimal entry area for positive trend states.
R =DT1
The R LEVEL = to the DT1 (Downside Target #1) creates an even wider support band with the DP. Signal acceptance anywhere in the price band is acceptable however it is best to commit to opportunities closer to the DP or DT1. As the R LEVEL moves farther below the DIR the energy in the market place is skewed lower. Any higher price movement should be expected to be move measure and any negative turn from higher levels should be expected to target the R LEVEL. This structure bias identifies a corrective or digestive expectation for negative trend type states with the R LEVEL defining current floor for the underlying negative momentum. For positive trend states the R LEVEL identifies where the real buying energy is and the optimal entry area to get back on the up-trend.
R < DT1
The R LEVEL below the DT1 identifies the low point for any price squeeze against the underlying trend if it is going to resume in the session. A market in this position has a defined underlying positive tone and any buy signals within the DP to R LEVEL range are an actionable opportunity. Buys above the UP are a lower value opportunity and the threat of a corrective squeeze down to the R LEVEL is real. Typically the market will attempt some type of corrective move when the R LEVEL is in this position. A good “tell” is either an exhaustive REVERSAL signal at the UP or a transitional negative BREAKOUT at the DIR targeting the R LEVEL.