MyTradePlan
This questionnaire provides the foundation to develop a TradePlan that will allow you to:
- Continually evaluate your trading in an objective way
- Trade without emotion and with minimal stress.
- Make needed adjustments as “matter of fact” not with the emotion that plan-less trading invokes.
Make your answers to the questions as clear and succinct as possible. There is no room for ambiguity in your plan; so avoid vague, fuzzy statements. Also, where possible, always define and qualify your statements.

Personality Profile
Countless papers have been written about how the best traders are cool as cucumbers and show no difference in emotion regardless of whether they are winning or incurring heavy losses. On the other hand a novice trades well on a simulator only to be faced with a whirlwind of emotion when real money is at risk. How do you avoid becoming a slave to emotion? With a TradePlan.
- Why do You Want to be a Trader?
- What Type of trading appeals to you?
- What are Your Personal Strengths and Weaknesses?
- What frame of mind are you in now?
- What are Your Income Targets?
Setting Goals
Setting goals is an essential part succeeding at anything worthwhile. Goals therefore; are a big part of your TradePlan as they provide you with a meaningful (to you personally) objective to work towards. The plan provides the way to track progress. Think in terms of your development as a trader, as opposed to thinking of purely financial goals.
- Where do you want to be as a trader in one year?
- Monthly?
- Weekly?
- Daily?
Some Details
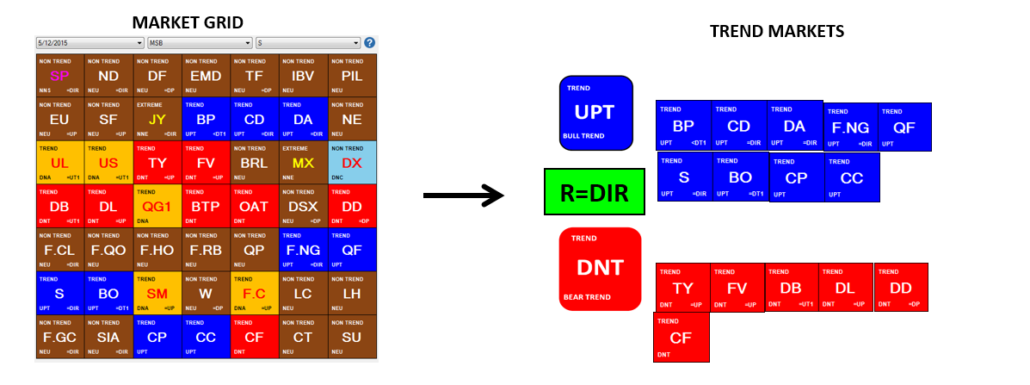
Most Plans will recommend limiting your market of focus but with a Strategy Based Trading approach that same edge can be applied to market state conditions and specific structure bias. In this approach limiting your trading to markets that are only in a NON TREND state with sentiment outside the CriticalRange to apply your deviation tactics can be even more empowering than only focusing on U.S. Stock Indices or Yield curve trades. Your personality traits will typically drive the type of trading that is best suited for creating a sustainable TradePlan. The charts and applications you use must correspond with this view.
- Which Markets do you want to trade and why?
- What timeframe do you want to Trade and why?
Tools of the Trade
Your broker and trading platform are critical to your performance, ask questions look for recommendations here is a list of concerns:
- The type of markets that you wish to trade. If, for example, you wish to trade U.S. stock indexes, which broker offers the largest universe of futures and do they also allow you to trade securities.
- The size of your account. If you have only limited capital with which to fund your trading, you need to start with mini products or micro currencies.
- The platform you use to trade. Which ones does your broker support if you have questions.
- The level of support and customer service offered by the broker. There are hands off and full service brokers see which one is the best for you – most appropriate is not always the cheapest
- Which Trading Platform are you going to use and why?
- Do you have experience with it?
- What Infrastructure do you have supporting your trading?
Before the Market Opens . . .
To begin trading without doing your homework beforehand is like building a house without a blueprint – possible? Maybe but not recommended at all. Have a TradePlan and develop a routine to ensure that you are prepared fully for the trading day ahead; this decreases your susceptibility to seat of the pants trading and emotional mistakes. In addition it builds self-confidence and improves your ability to trade more intuitively.
- What is your Daily Pre-market Routine (or post close routine)?
- Do You Analyze Yesterday’s Trades?
- Do you consider the Fundamental Market Conditions?
- What does your trading day look like by the Hour?
- Do you keep and update a trade watch list of markets that are in your preferred market state?
Risk & Money Management
This is the crux of ANY trading successful trading endeavor period. Failure to apply sound risk and money management principles will, almost certainly, be financially ruinous. First of all, let us define the difference between risk and money management. Risk management focuses on the steps necessary to minimize losses by assessing market state conditions, sentiment bias influence, volatility expectations, risk-reward, probabilities and the proper use of stop loss orders etc. Money management, on the other hand, focuses on the steps necessary to maximize profits by the use of trailing stops and adjusting position size etc. This is summed up perfectly in that giant of trading axioms: ‘cut your losses short and let your profits run. It is important that your feelings about risk are compatible with your TradePlan.
- What is Your Attitude toward Risk?
- What is your Overall Market (account) Risk?
- Do you understand your Broker and Hardware Risk?
- Do you understand the risks associated with your trading tactics? Please explain
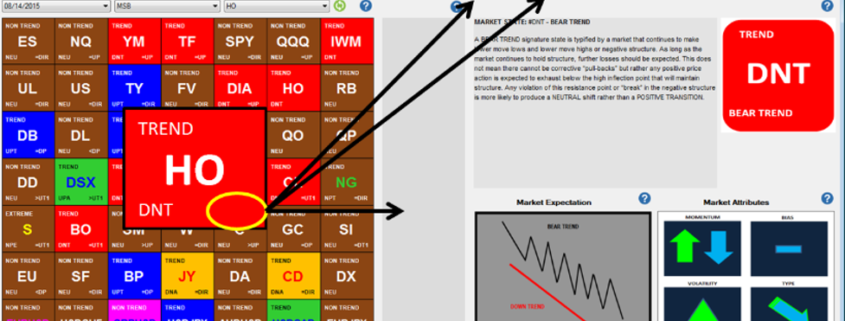
ALL strategies break down. This is due to the markets constant transition from one trading environments to the next. It is crucial to identify what market states compliment the criteria of a trading strategy or tactic and monitor its performance during different market state themes. Markets are constantly in transition and we need to constantly update our tactics as conditions change.
Advanced Risk Management Topics
When it comes to assessing the specific risk associated with a proposed trade, most traders focus only on the risk-reward ratio. Unfortunately, this is only a part of the picture, unless probability is factored into the equation. Here’s why: suppose the risk-reward ratio is 4:1 – a gain of 80 points while only risking 20. In isolation, this looks excellent. However, if the probability of a trade being successful is only – say 20%, i.e. the probability of a 20 point loss is 80%, suddenly the proposed trade does not look quite so attractive! To assess the probability of success of a trading strategy we must start by standardizing our TradePlan to market state and structure conditions. This needs to be precise with no ambiguity. “IF the market is in this state and structure; THEN my strategy is to does that”. This is vital in order to build the foundation to create a sustainable trade program.
- Do you understand the Probability of a Successful Trade? What is the real risk of an opportunity?
- Do you understand the Risk-Reward Ratio of your strategies?
- Do Calculate the Risk Per Trade?
- How do you make decisions on where to place Your Stop Loss Orders?
- At what point will You Cease Trading for the day?
General Money Management
Your trading capital must be money that you can afford to lose and be set aside from everyday expenses. If you lose the lot, it should make no difference to your standard of living. Clearly define in your plan the extent to which you will credit additional funds to your account in the event of large drawdowns and debit the account when it starts to burst at the seams with huge profits.
- Large Drawdowns and Profits – What will you do?
- What Money Management Approaches do You Use?
Specific Money Management
Utilizing a trailing stop to lock in profits once the trade is on the right side of break even has two clear advantages. 1) At worst, you may end up with a scratch trade – but no losses. 2) At best, it allows profits to run which enables you to take a sizeable chunk out of the expected move. Part of standardizing a TradePlan should consider how trial stops adjustments should be anticipated in different market state and structure conditions to reduce profit give-back as much as possible. Profit Give-Back refers to how much unrealized profits do you “give-back” on a trade. This should be a function of the opportunity as well as the overall risk management aspects of a TradePlan.
- How do You Determine Your Position Size?
- How do you lock in Profits?
- Do you use a Profit Give-back ratio?
- At what dollar amount of unrealized profit would cause your mental state to change?
- What is your profit give-back ratio [the amount of unrealized profit you would “lock in” with a trail stop] for the following scenarios?
Unrealized Expectation Profit Give-back Ratio
+100 +300
+200 +300
+200 +500
+200 +750
+400 +750
+400 +1500
+400 +2500
+750 +1500
+750 +2500
Exit Strategy
Exit strategies are harder to get right than entry strategies. Unfortunately, they are much more important because, self evidently, they control the profit and loss. Arguably, for discretionary traders, the best exit strategy is one that is dynamic and market controlled, as opposed to a rigid mechanical strategy imposed upon each trade, regardless of market conditions. A dynamic, market controlled exit enables you to take some money off the table offered by the eventual losers and let the big winners run to realize a greater proportion of the increased gains on offer. These additional profits could transform an overall trading strategy from one that barely breaks even into one that is profitable beyond what we thought possible.
- Losing trades – Do You Exit before Your Stop is Hit? Explain
- Losing trades – Which Signals Will See You Exit Early?
- Winning Trades – Which Signals Will See You Exit before the Initial Target is Hit?
- Winning Trades – Which Signals Will See You Close Half?
- Winning Trades – When Will You Close the Remainder?
Trade Strategies, Setups & Entries
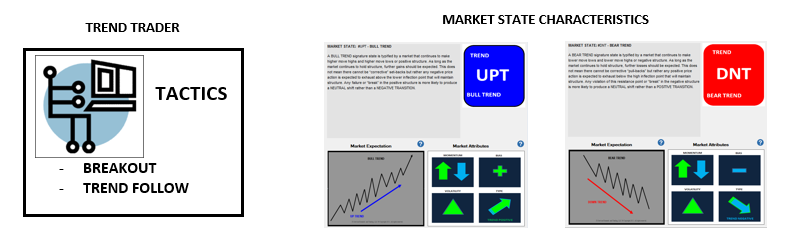
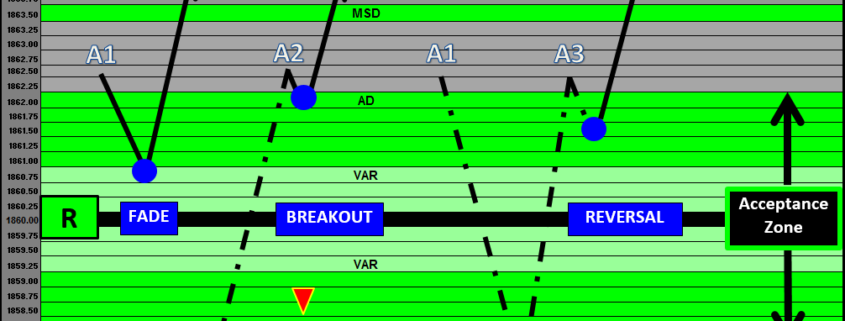
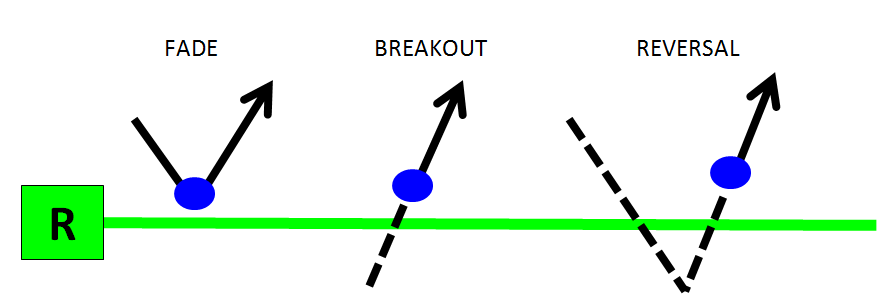
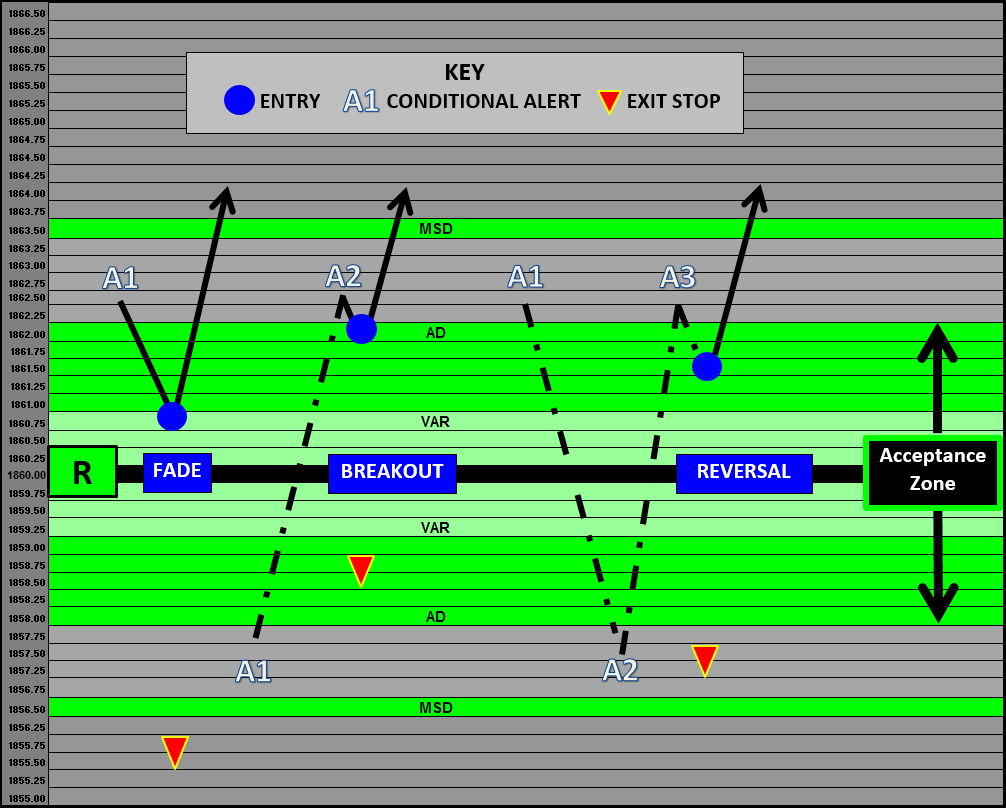
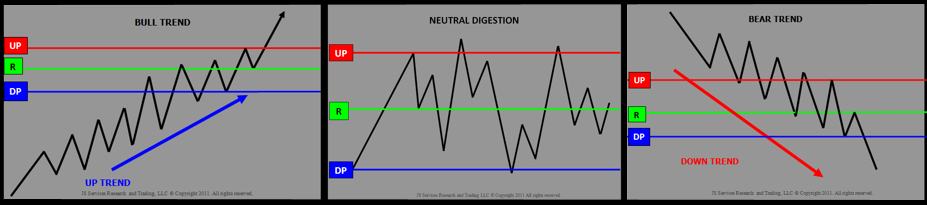
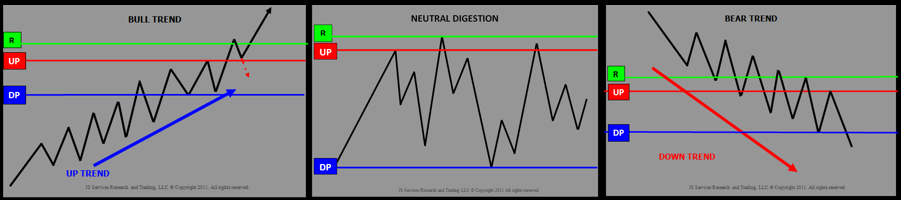
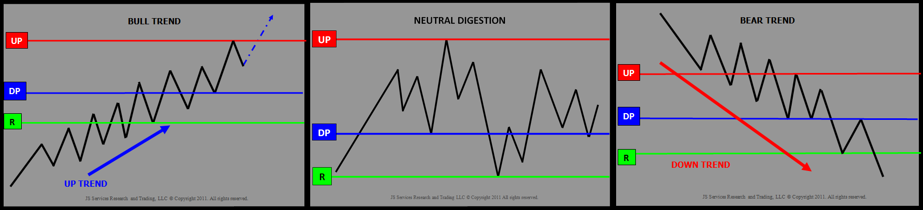
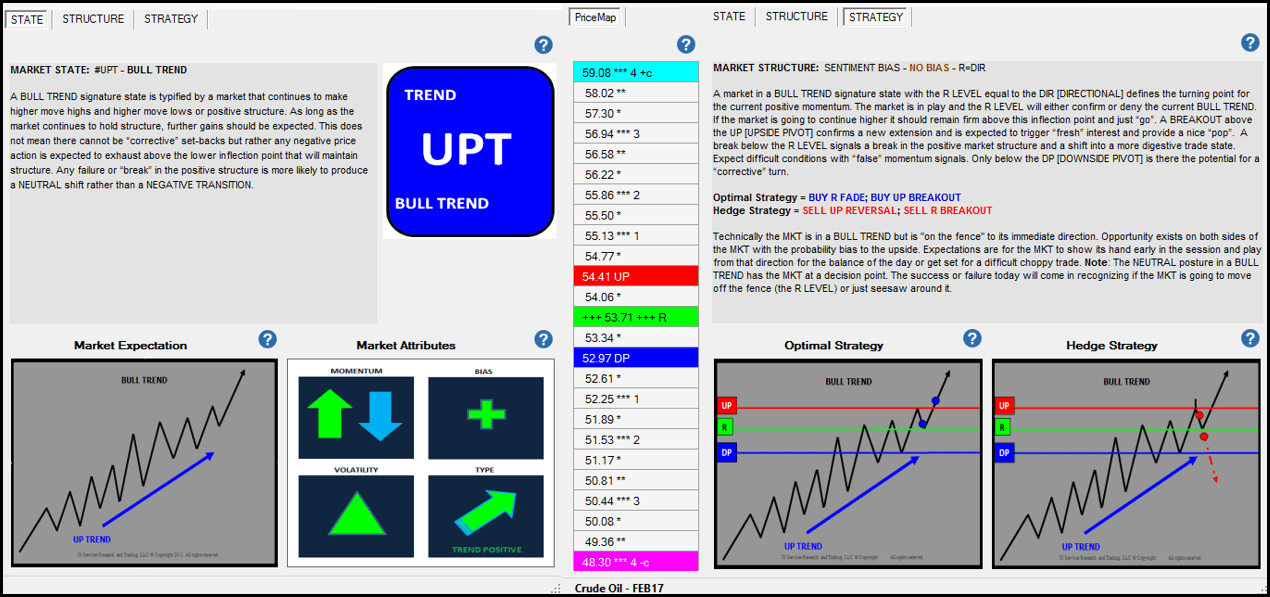
Strategies will vary in their profitability and usefulness according to market state conditions and structure alignment. Virtually all strategies fall into one of three generic groups: BREAKOUT, FADE (retracements) and REVESALS. Within these groups are a multitude of trading tactics, but basically follow one of these themes.
Based on your Personality Profile you may gravitate towards one entry strategy type but should be comfortable with each theme and a solid understanding of what market states they will work best in.
- Which Market States do you like to Trade?
- What are tactics do you apply and what are Your Setups?
- How do You Find Your Setups?
- Which Signals Will Trigger Your Entry?
After the Market Closes
Once you have finished trading for the day it seems like you should just walk away from the stress. The process should include examining both winning and losing trades. It is essential that you know what you did right and, just as importantly, what you did wrong.
- Do You Recorded Today’s Trades?
- Do you note if you executed Your Trades According to Your Plan in a journal?
Discipline
Having trading plan with detailed entry and exit instructions and excellent risk and money management procedures all count for nothing if you lack the necessary discipline to implement them. The next questions are about ensuring that you stick rigidly to the commitments that you have made to YOURSELF . Adhering to your plan is relatively easy during periods of profit. However, the real test will be your ability to stick to it even when your trading is not going so well.
- Have you Back Test or Forward Test (Sim) your strategy?
- Do you have any Promises to Yourself [consequences of following or not following the Trade Plan]?
- What Questions do You Ask after a Winning Trade?
- What Questions do You Ask after a Losing Trade?
- What Steps are You Taking to Learn More about Trading?

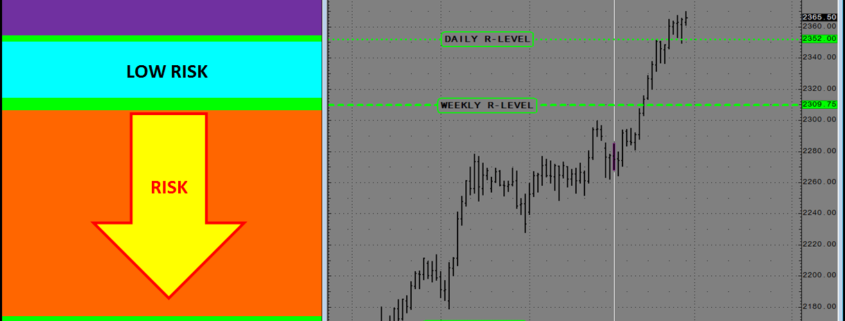
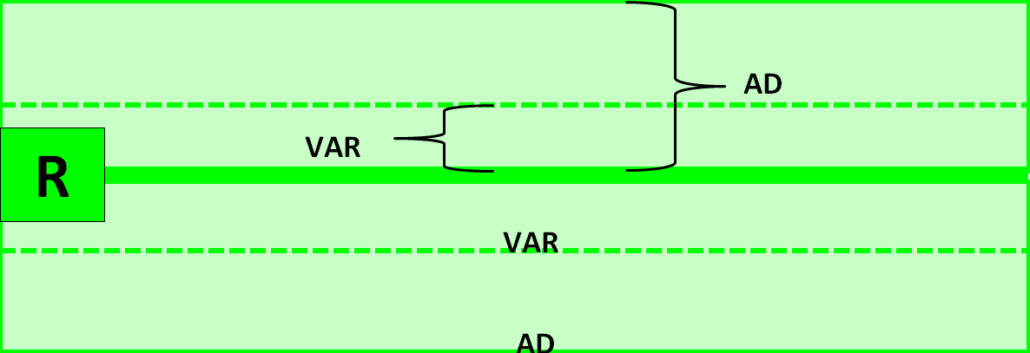
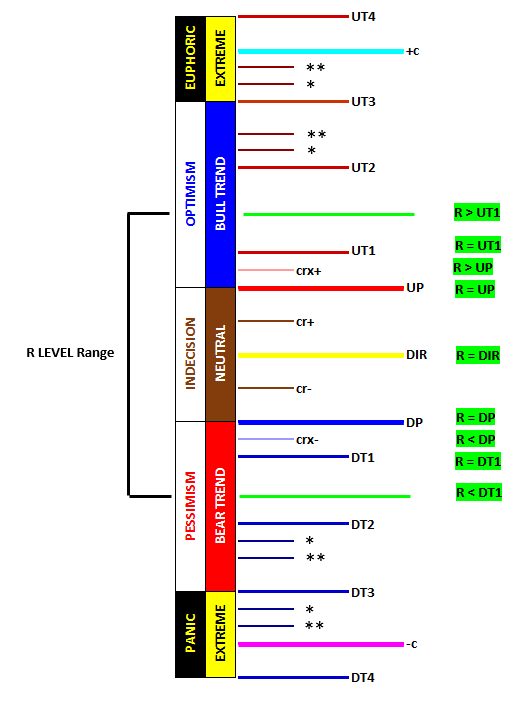
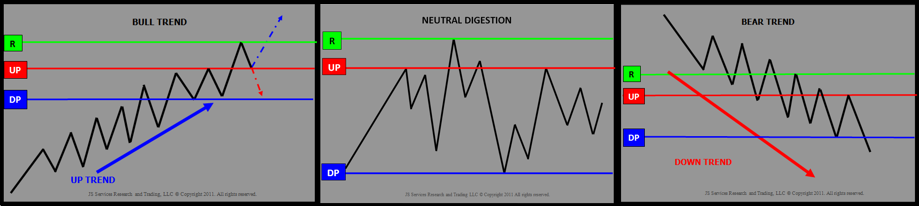
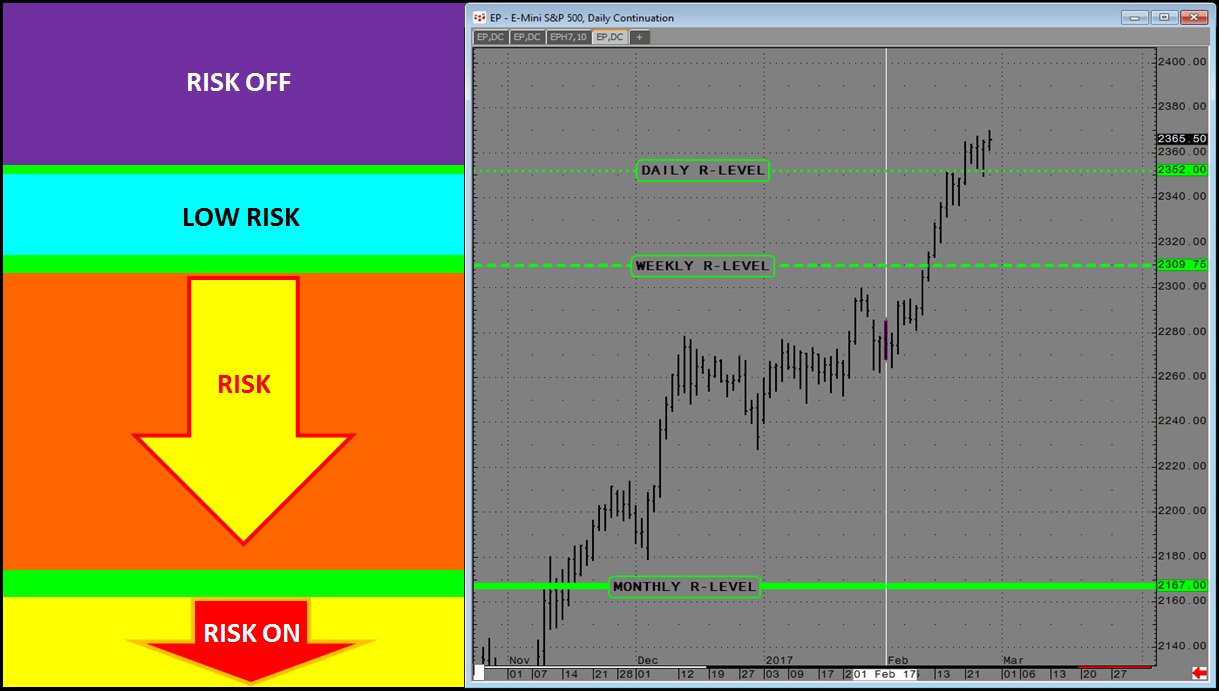 Daily, Weekly, Monthly R-LEVEL Risk Structure
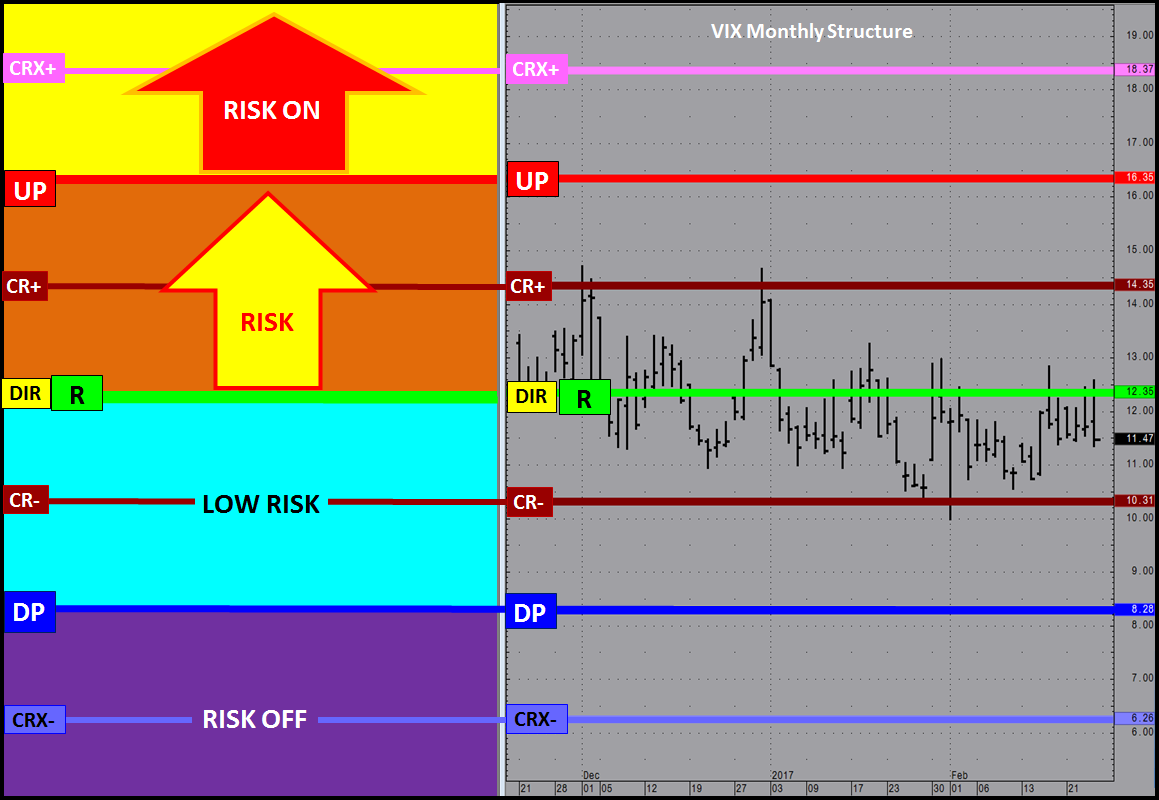
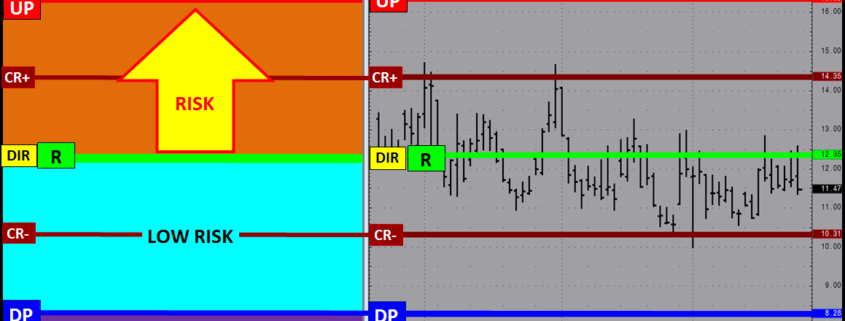

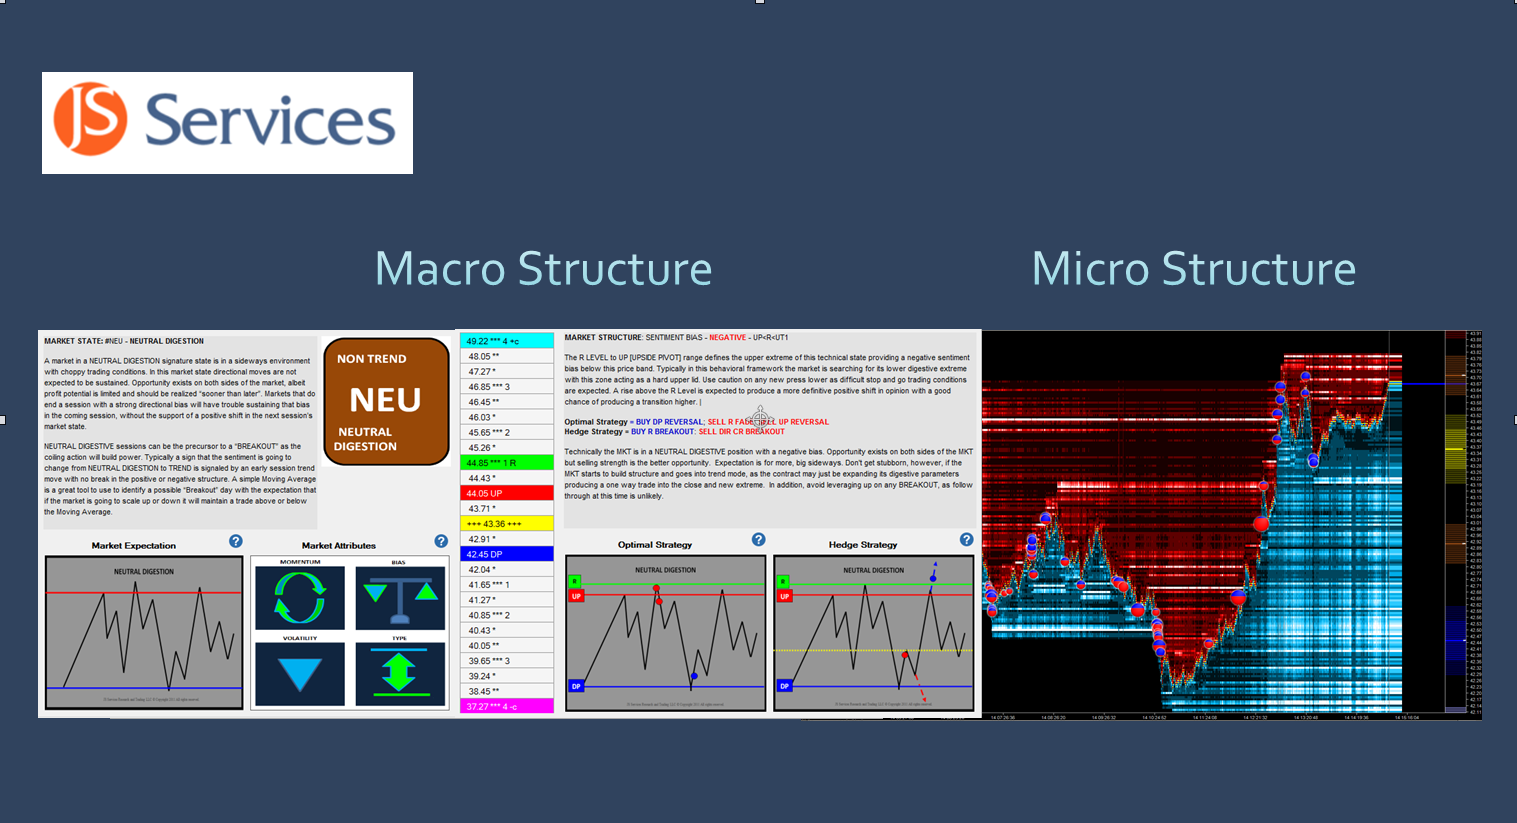
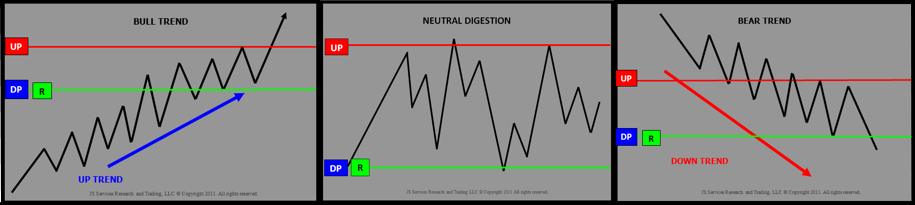
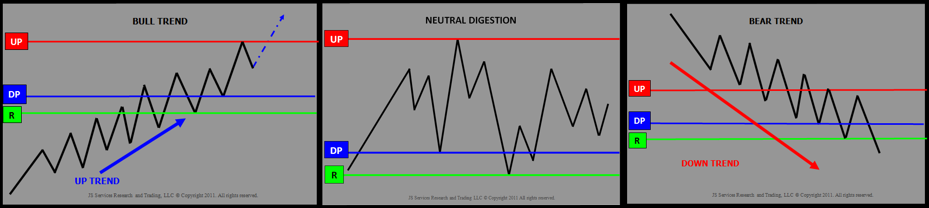
 Macro Structure Micro Structure
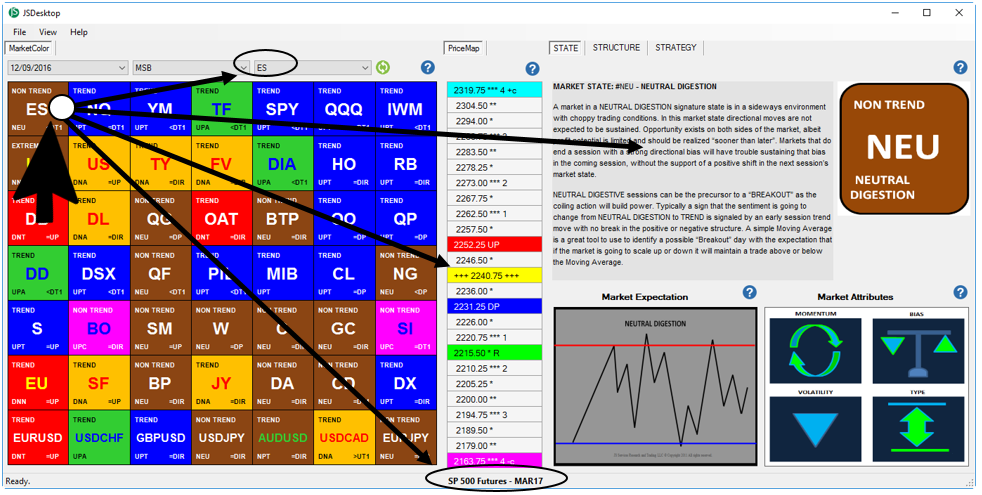
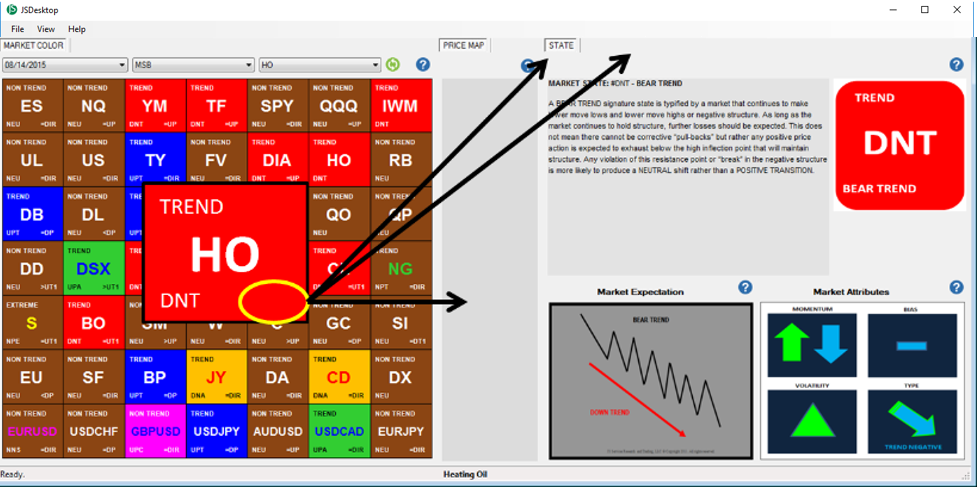
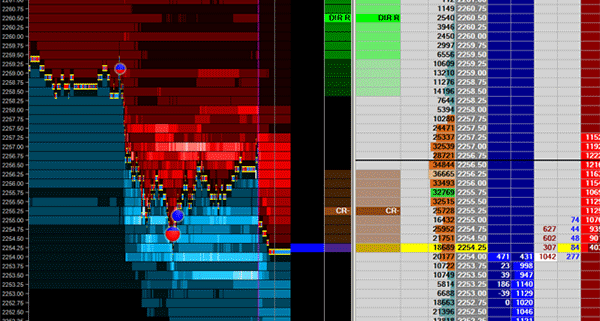
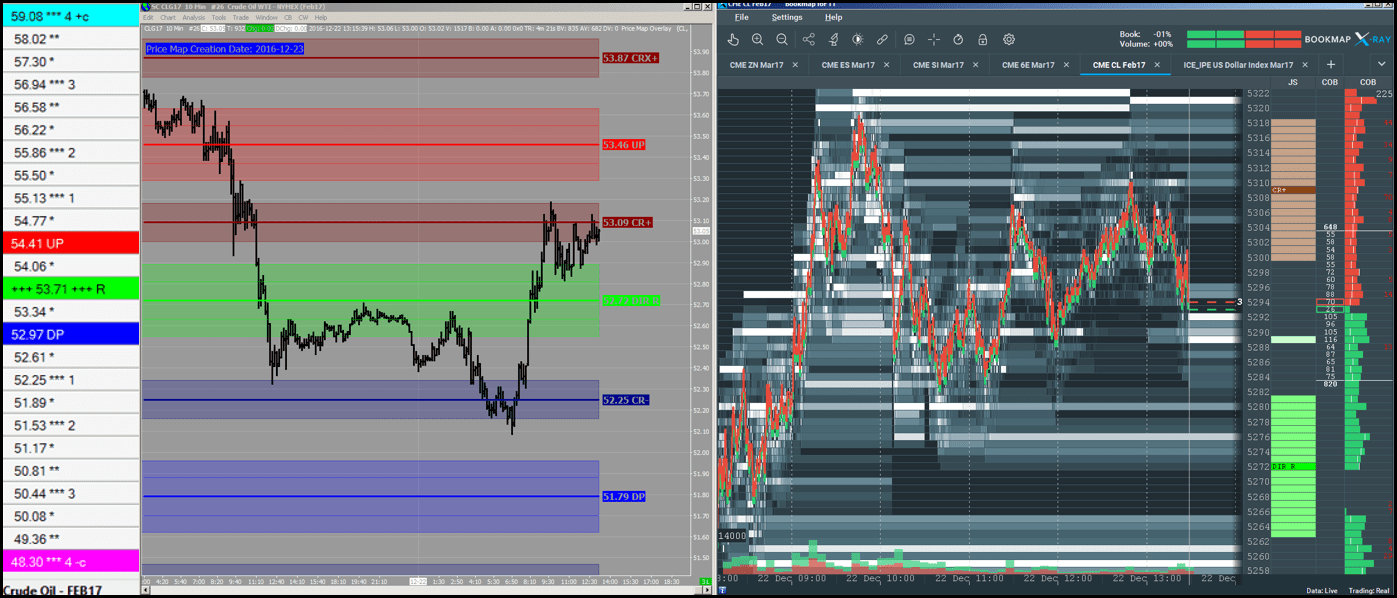
 JSDesktop
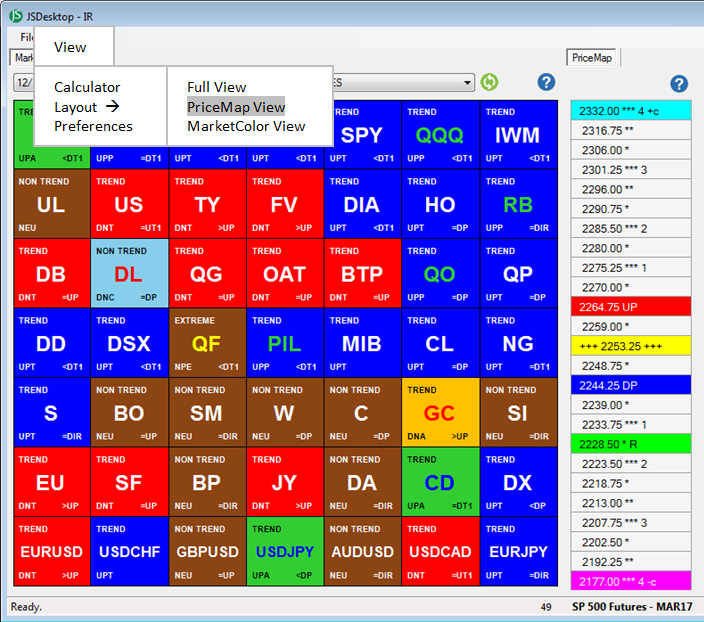
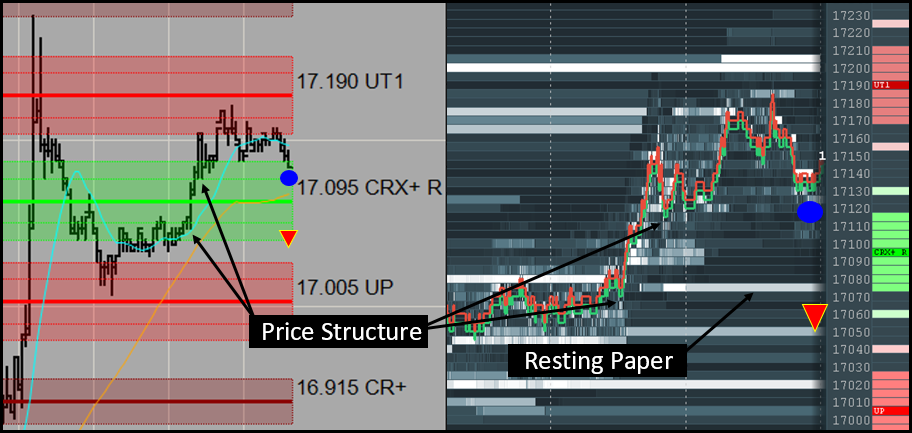
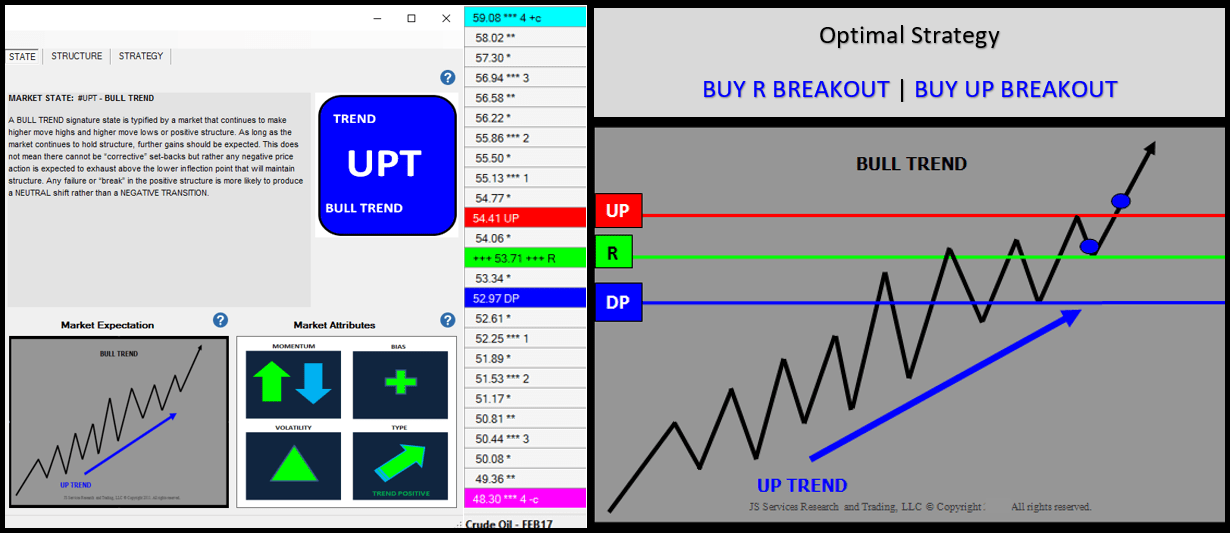 JSDesktop displays the JSAnalytics
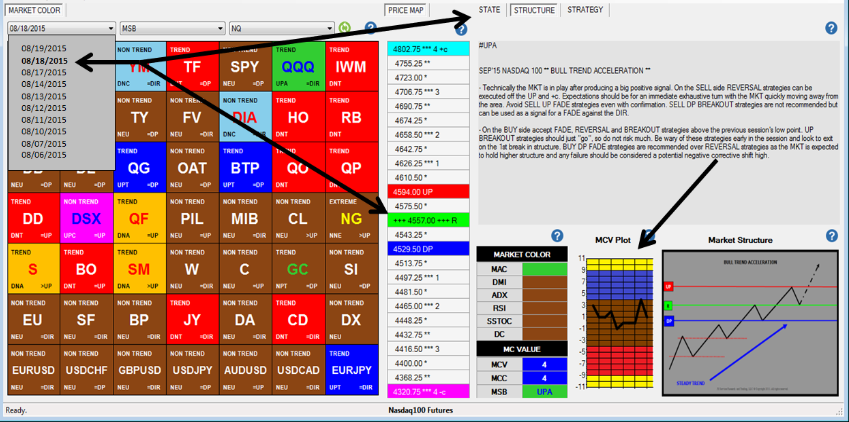
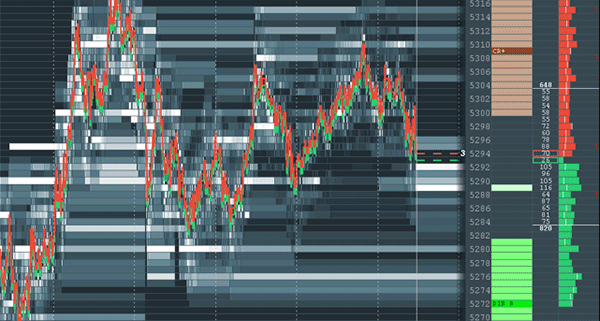
 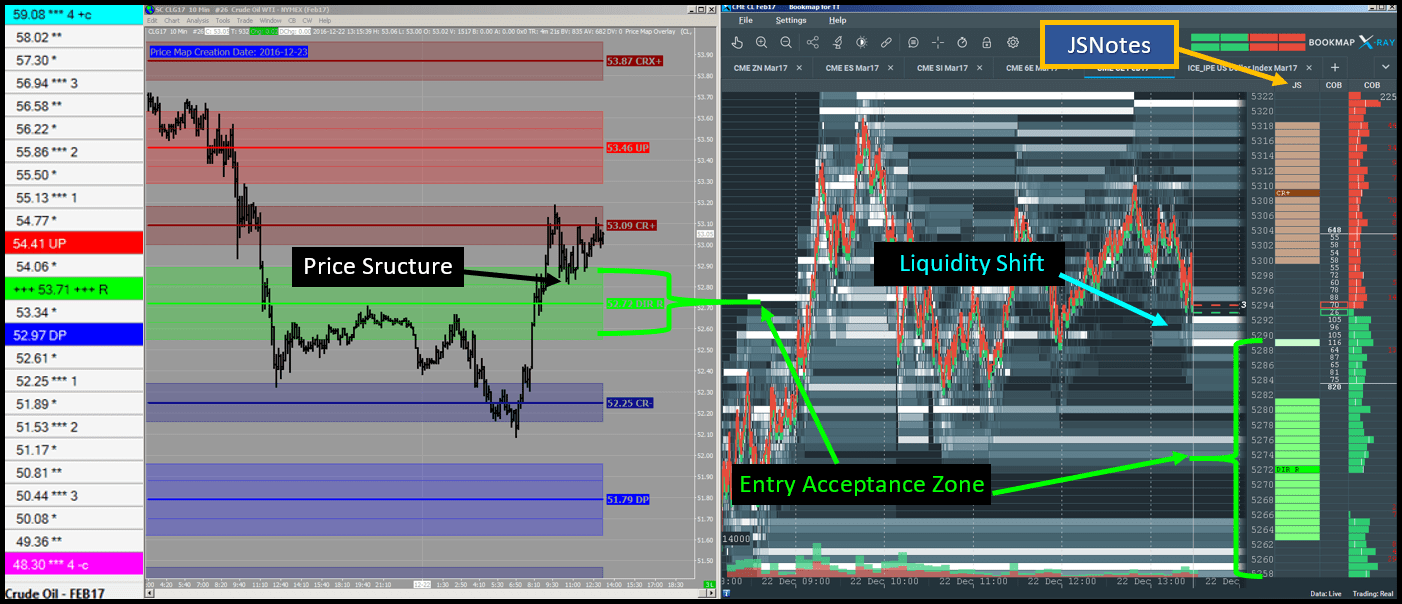 Example of a Liquidity Shift event occurring at the top of the PriceMap Entry Acceptance Zone
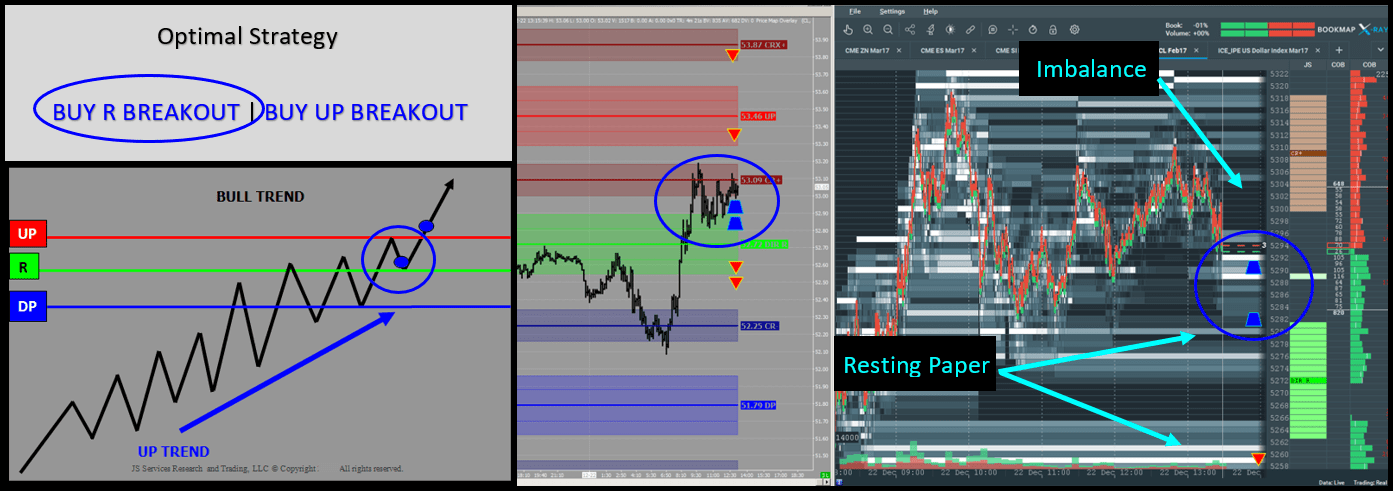 BUY R BREAKOUT Strategy Theme is “in play”