The following statement is furnished pursuant to Commodity Futures Trading Commission (“CFTC”) Regulation 1.55(c).This brief statement does not disclose all of the risks and other significant aspects of trading in futures, forex and options. In light of the risks, you should undertake such transactions only if you understand the nature of the contracts (and contractual relationships) into which you are entering and the extent of your exposure to risk. Trading in futures, forex and options is not suitable for many members of the public. You should carefully consider whether trading is appropriate for you in light of your experience, objectives, financial resources and other relevant circumstances.
The risk of loss in trading commodity futures contracts and foreign currency can be substantial. You should, therefore, carefully consider whether such trading is suitable for you in light of your circumstances and financial resources. You should be aware of the following points:
1. You may sustain a total loss of the funds that you deposit with your broker to establish or maintain a position in the commodity futures market or foreign exchange market, and you may incur losses beyond these amounts. If the market moves against your position, you may be called upon by your broker to deposit a substantial amount of additional margin funds, on short notice, in order to maintain your position. If you do not provide the required funds within the time required by your broker, your position may be liquidated at a loss, and you will be liable for any resulting deficit in your account.
2. The funds you deposit with a futures commission merchant for trading futures and forex positions are not protected by insurance in the event of the bankruptcy or insolvency of the futures commission merchant, or in the event your funds are misappropriated.
3. The funds you deposit with a futures commission merchant for trading futures or forex positions are not protected by the Securities Investor Protection Corporation even if the futures commission merchant is registered with the Securities and Exchange Commission as a broker or dealer.
4. The funds you deposit with a futures commission merchant are generally not guaranteed or insured by a derivatives clearing organization in the event of the bankruptcy or insolvency of the futures commission merchant, or if the futures commission merchant is otherwise unable to refund your funds. Certain derivatives clearing organizations, however, may have programs that provide limited insurance to customers. You should inquire of your futures commission merchant whether your funds will be insured by a derivatives clearing organization and you should understand the benefits and limitations of such insurance programs.
5. The funds you deposit with a futures commission merchant are not held by the futures commission merchant in a separate account for your individual benefit. Futures commission merchants commingle the funds received from customers in one or more accounts and you may be exposed to losses incurred by other customers if the futures commission merchant does not have sufficient capital to cover such other customers’ trading losses.
6. The funds you deposit with a futures commission merchant may be invested by the futures commission merchant in certain types of financial instruments that have been approved by the Commission for the purpose of such investments. Permitted investments are listed in Commission Regulation 1.25 and include: U.S. government securities; municipal securities; money market mutual funds; and certain corporate notes and bonds. The futures commission merchant may retain the interest and other earnings realized from its investment of customer funds. You should be familiar with the types of financial instruments that a futures commission merchant may invest customer funds in.
7. Futures commission merchants are permitted to deposit customer funds with affiliated entities, such as affiliated banks, securities brokers or dealers, or foreign brokers. You should inquire as to whether your futures commission merchant deposits funds with affiliates and assess whether such deposits by the futures commission merchant with its affiliates increases the risks to your funds.
8. You should consult your futures commission merchant concerning the nature of the protections available to safeguard funds or property deposited for your account.
9. Under certain market conditions, you may find it difficult or impossible to liquidate a position. This can occur, for example, when the market reaches a daily price fluctuation limit (“limit move”).
10. All futures, forex and options positions involve risk, and a “spread” position may not be less risky than an outright “long” or “short” position.
11. The high degree of leverage (gearing) that is often obtainable in futures and forex trading because of the small margin requirements can work against you as well as for you. Leverage (gearing) can lead to large losses as well as gains.
12. In addition to the risks noted in the paragraphs enumerated above, you should be familiar with the futures commission merchant you select to entrust your funds for trading futures positions. As of July 12, 2014, the Commodity Futures Trading Commission requires each futures commission merchant to make publicly available on its Web site firm specific disclosures and financial information to assist you with your assessment and selection of a futures commission merchant. Information regarding this futures commission merchant may be obtained by visiting the websites of the respective FCM partner of NinjaTrader Brokerage: Dorman Trading (www.dormantrading.com), Phillip Capital (www.phillipcapital.com), FXCM (www.fxcm.com)
ALL OF THE POINTS NOTED ABOVE APPLY TO ALL FUTURES AND FOREX TRADING WHETHER FOREIGN OR DOMESTIC. IN ADDITION, IF YOU ARE CONTEMPLATING TRADING FOREIGN FUTURES OR OPTIONS CONTRACTS, YOU SHOULD BE AWARE OF THE FOLLOWING ADDITIONAL RISKS:
13. Foreign futures transactions involve executing and clearing trades on a foreign exchange. This is the case even if the foreign exchange is formally “linked” to a domestic exchange, whereby a trade executed on one exchange liquidates or establishes a position on the other exchange. No domestic organization regulates the activities of a foreign exchange, including the execution, delivery, and clearing of transactions on such an exchange, and no domestic regulator has the power to compel enforcement of the rules of the foreign exchange or the laws of the foreign country. Moreover, such laws or regulations will vary depending on the foreign country in which the transaction occurs. For these reasons, customers who trade on foreign exchanges may not be afforded certain of the protections which apply to domestic transactions, including the right to use domestic alternative dispute resolution procedures. In particular, funds received from customers to margin foreign futures transactions may not be provided the same protections as funds received to margin futures transactions on domestic exchanges. Before you trade, you should familiarize yourself with the foreign rules which will apply to your particular transaction.
14. Finally, you should be aware that the price of any foreign futures or option contract and, therefore, the potential profit and loss resulting therefrom, may be affected by any fluctuation in the foreign exchange rate between the time the order is placed and the foreign futures contract is liquidated or the foreign option contract is liquidated or exercised.
THIS BRIEF STATEMENT CANNOT, OF COURSE, DISCLOSE ALL THE RISKS AND OTHER ASPECTS OF THE COMMODITY AND FOREIGN CURRENCY MARKETS.


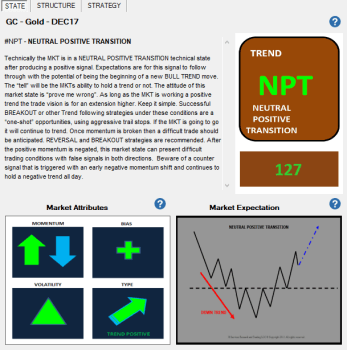

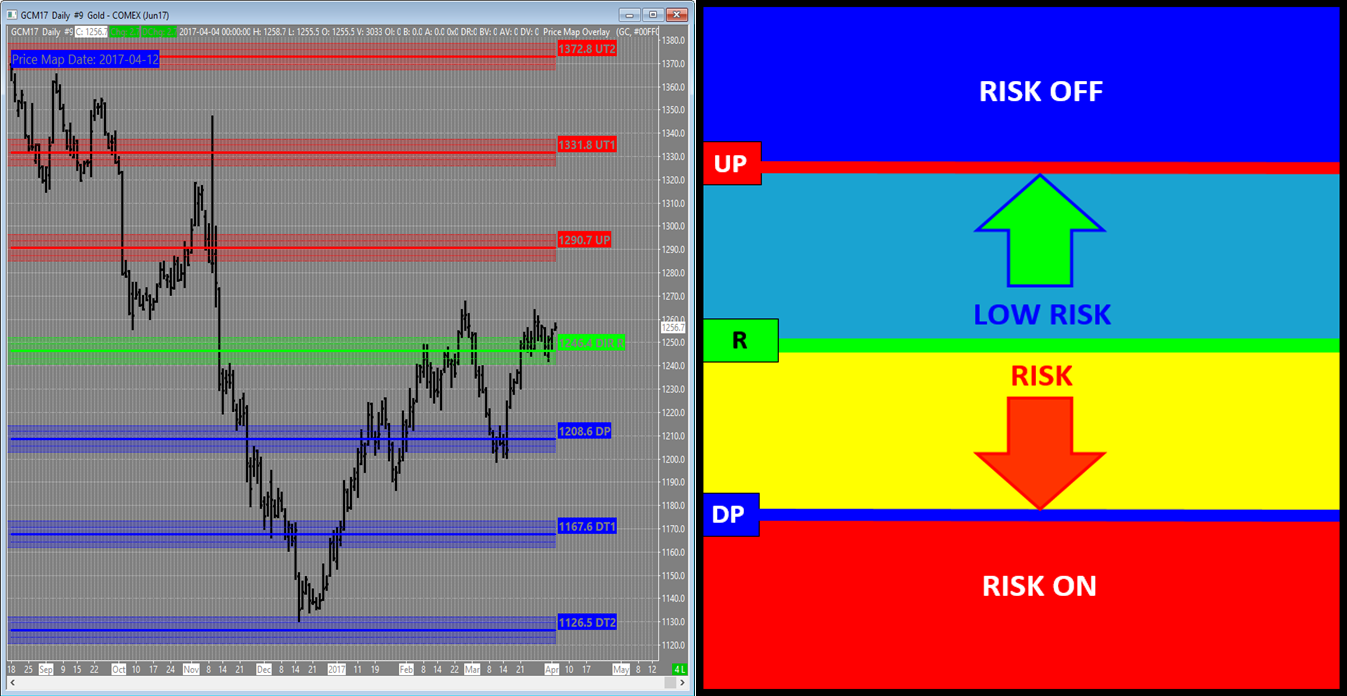
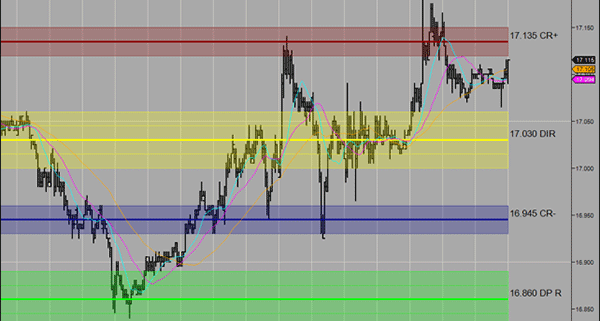
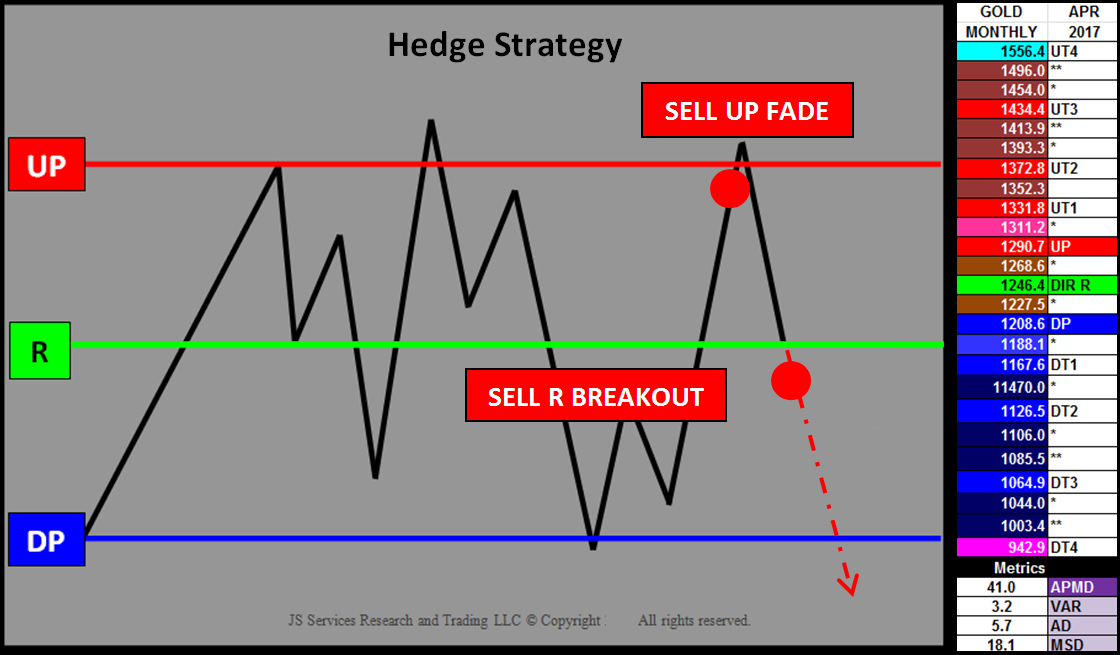 Hedge Strategy and GOLD Monthly April 2017 PriceMap
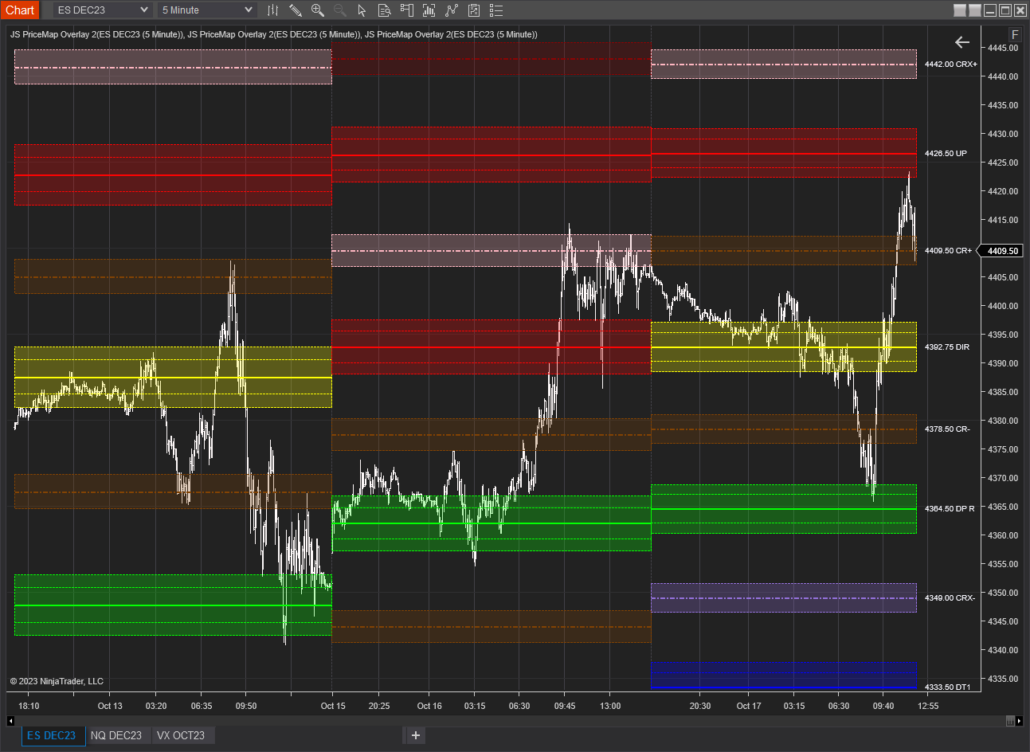


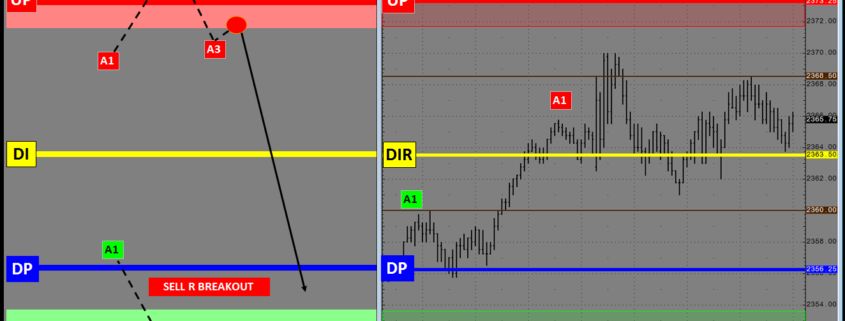
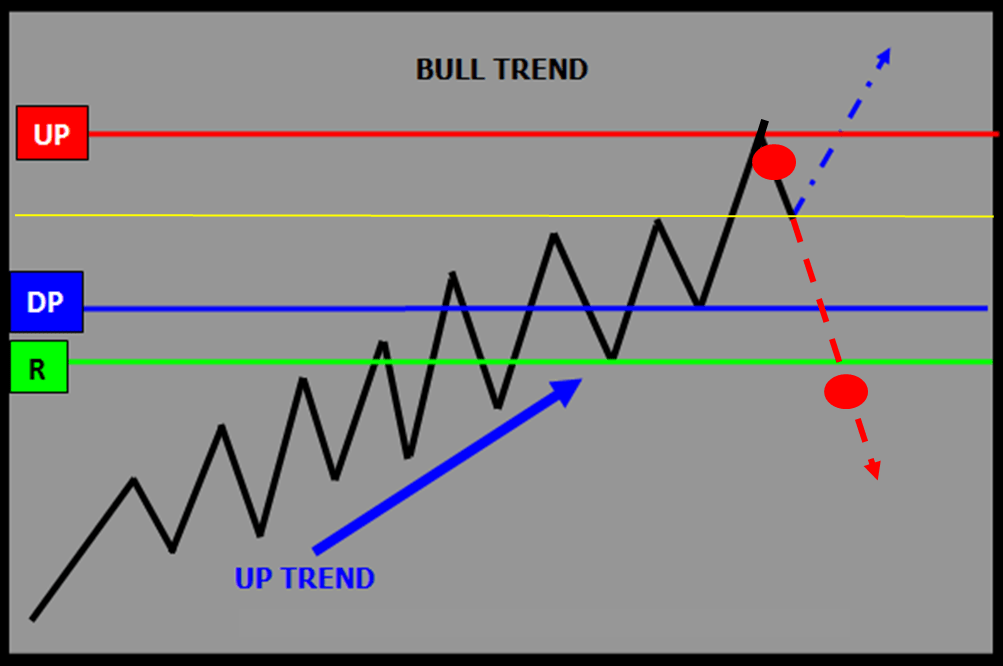
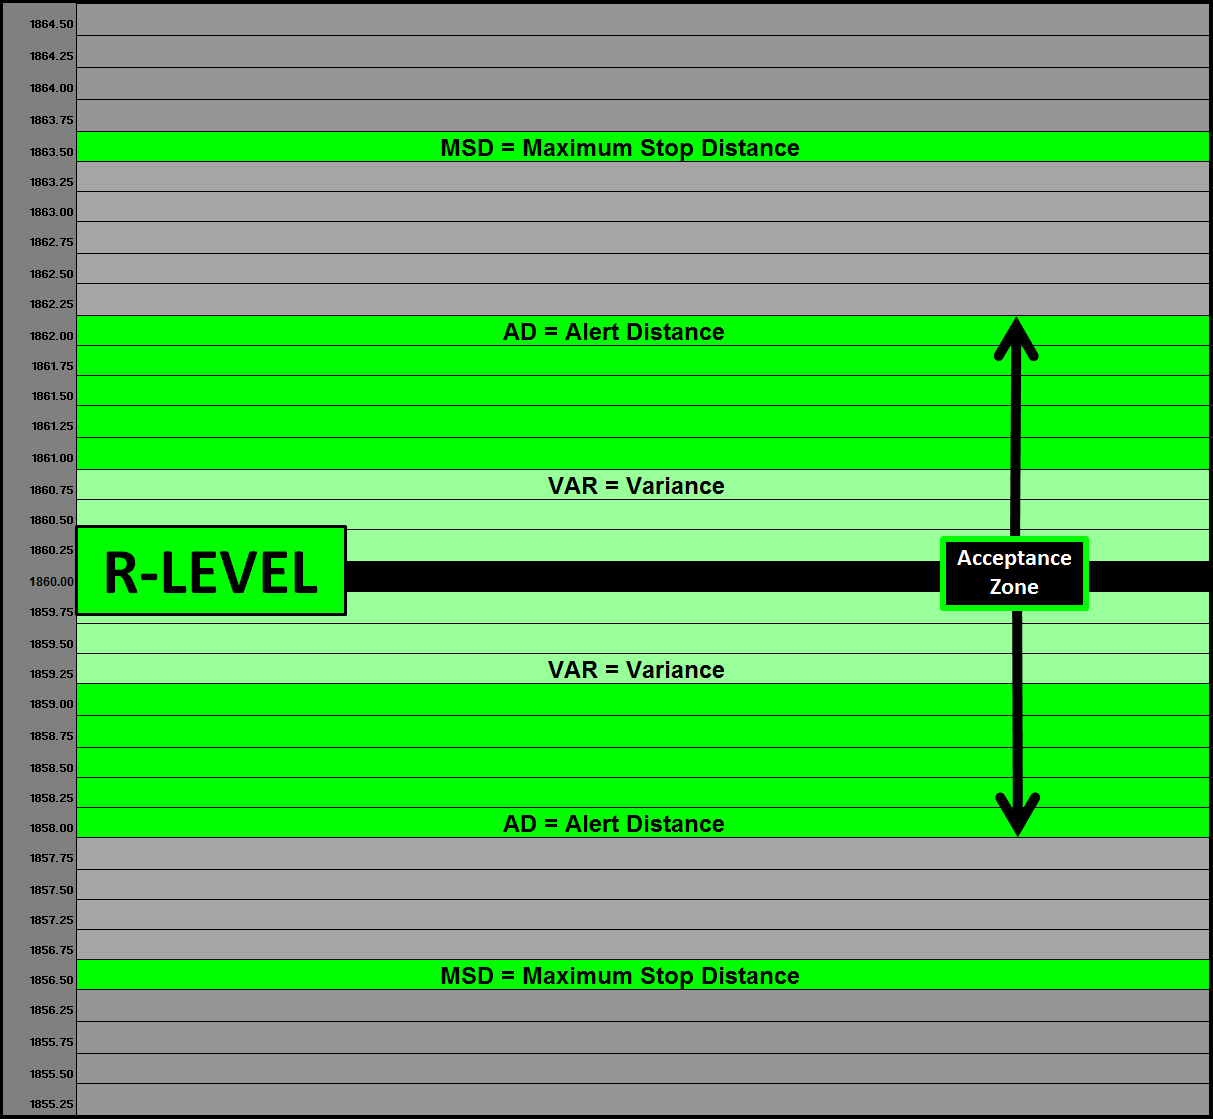
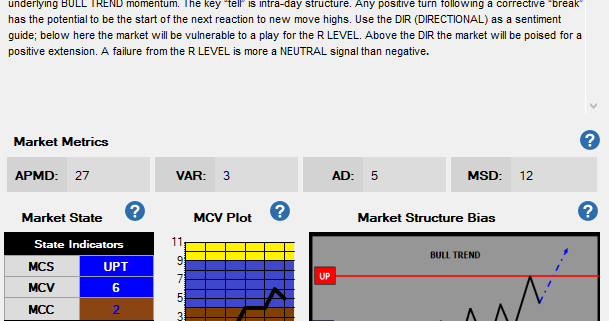
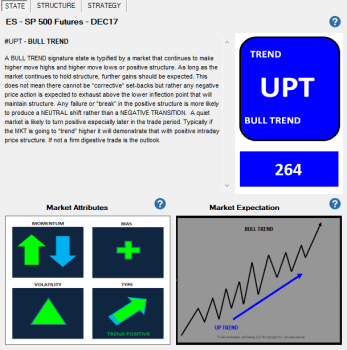
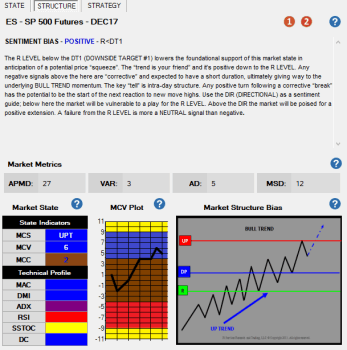
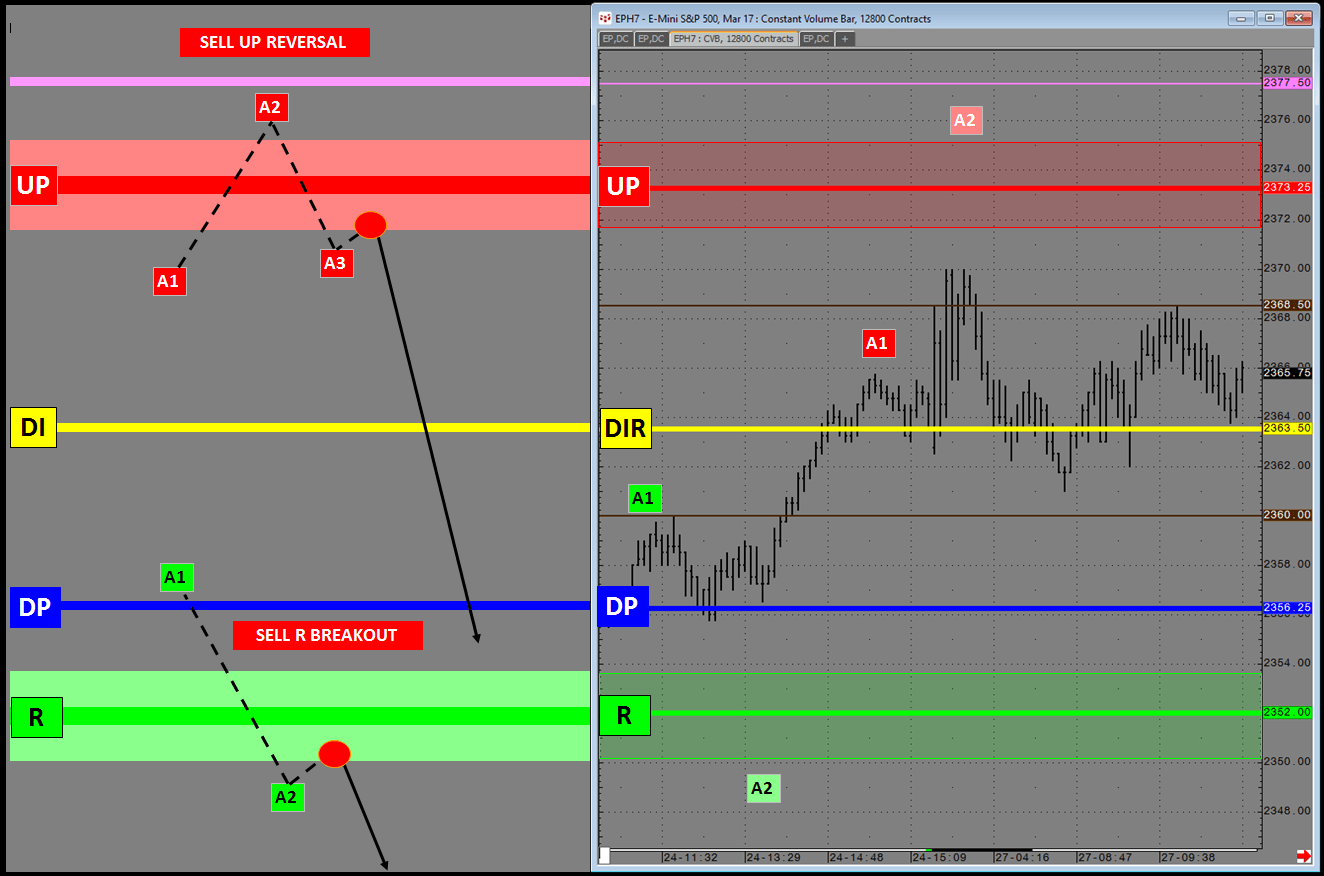 PlayBook Entry Tactics SP500 E-Mini with Market Metrics