
PriceMap Definitions
![]()
JSServices PriceMap Analytics use quantitative methods to objectively define the price STRUCTURE of the market STATE. The knowledge of the market STATE STRUCTURE and the awareness of current price action within it, provides clarity to the value of an opportunity and the risk and reward associated with it.
OVERVIEW
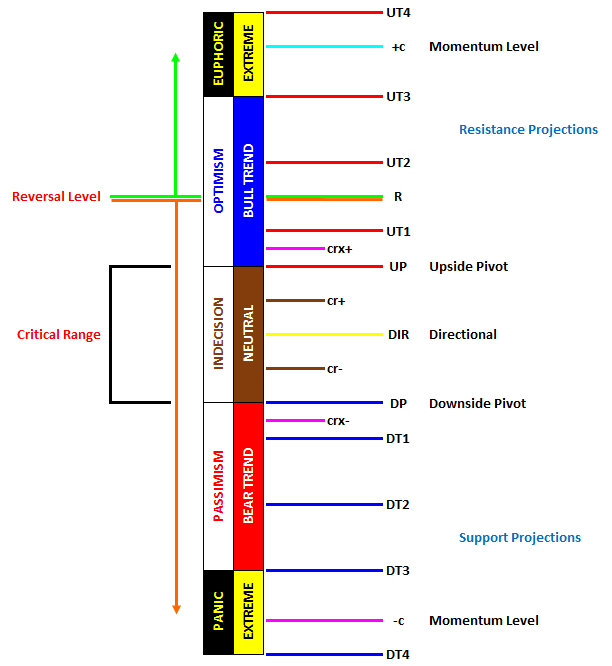
Price levels in the PriceMap series followed by stars *** are minor structure and major target “support and resistance” levels. The star *** value weights are determined by their structural significance to the market state alignment. Alignment defined as the price point that will have an influence on the market maintaining structure or not. The more stars ***, the more value a level has and the greater significance to the structural integrity of the price framework of the market STATE. Prices followed by symbols (+++ +++ (DIR), UP, DP, R, +c and – c) are directional pivots or trend indicators. These levels are the actionable points of the PriceMap, as they define where potential transitional shifts in STATE will occur and are the preferred entry levels.
In a general sense trading within the CRITICAL RANGE (UP–DP) represents a neutral posture for the market and trading outside a trend posture with the DIRECTIONAL (+++ +++ the classic pivot point within this range. The ***# levels are Upside/ Downside Target (UT/DT) projections the for a CRITICAL RANGE breakout.
The R Level qualifier represents the sentiment bias for the trade period. Trading above the R signals a positive buy break bias, while trading below signifies a negative sell rally bias. A price violation or failure at the R Level would reverse this bias.
+c and – c symbols represent Continuation Momentum numbers that define the technical event extremes.
JS PRICEMAP QUALIFIER KEY
R = REVERSAL LEVEL is the SENTIMENT BIAS level for the trade period, positive bias above, negative below.
UP = UPSIDE PIVOT is a key resistance point for the trade period and the top of the CRITICAL RANGE
DP = DOWNSIDE PIVOT is a key support point for the trade period and the bottom of the CRITICAL RANGE
MAJOR LEVELS
DIR (+++ +++) DIRECTIONAL is a classic pivot point that sets the bias for trading within the CRITICAL RANGE [CR]
UT1 (***1) UPSIDE TARGET #1 is the minimum target for a CR BREAKOUT
UT2 (***2) UPSIDE TARGET #2 is the expected target for a CR BREAKOUT
UT3 (***3) UPSIDE TARGET #3 is the best case objective for a CR BREAKOUT
UT4 (***4) UPSIDE TARGET #4 is an event extreme target
+c +CONTINUATION MOMENTUM defines the technical extreme
DT1 (***1) DOWNSIDE TARGET #1 is the minimum target for a CR BREAKOUT
DT2 (***2) DOWNSIDE TARGET #2 is the expected target for a CR BREAKOUT
DT3 (***3) DOWNSIDE TARGET #3 is the best case objective for a CR BREAKOUT
DT4 (***4) DOWNSIDE TARGET #4 is an event extreme target
-c -CONTINUATION MOMENTUM defines the technical extreme
MINOR LEVELS
* MINOR 1 STAR LEVEL represent a minor support or resistance level
** MINOR 2 STAR LEVEL represent a good minor support or resistance level
CRX+ CRITICAL RANGE EXTREME + defines the CRITICAL RANGE positive extreme
CR+ CRITICAL RANGE + defines the interior +quadrant of the CRITICAL RANGE
CR- CRITICAL RANGE – defines the interior -quadrant of the CRITICAL RANGE
CRX- CRITICAL RANGE EXTREME – defines the CRITICAL RANGE negative extreme
MARKET METRICS
VAR = VARIANCE – defines the optimal area influence of a Major or Minor Level
AD = ALERT DISTANCE – defines the area of signal acceptance and structure thresholds for a Major Level
MSD = MAXIMUM STOP DISTANCE – Defines the maximum area of influence of a Major Level


