Application Integration NinjaTrader
Integration
How to set-up the JS PRICEMAP Integration Video click HERE
- DOWNLOAD DATA
- DOWNLOAD and IMPORT the JS NT SCRIPT
- ADD the PRICEMAP to a CHART
- EDIT the SETTINGS
- DISPLAY FEATURES
STEP 1 DOWNLOAD DATA
The PRICEMAP integration for NinjaTrader comprises two essential parts:
- The NinjaScript indicator, which displays PRICEMAP levels on your chart.
- The data files, which contain the price levels shown.
Updating this data is a crucial part of your DAILY WORKFLOW.
To DOWNLOAD DATA:
- OPEN the PLAYBOOK
- Refresh the PLAYBOOK to be sure you have the current data.
- Go to the DOWNLOAD TAB and select the PriceMap files you want to download.
- PriceMap file contains DAILY, WEEKLY, MONTHLY data available for Tier 2 subscriptions.
- PriceMap Daily file contains ONLY DAILY data is for Tier 1 subscriptions.
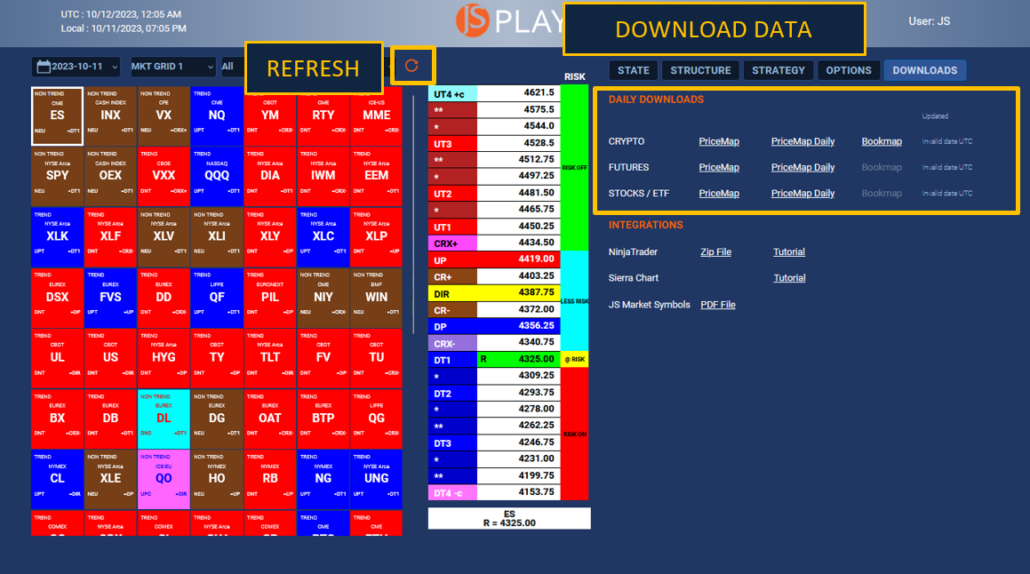
- Selected files will show up in Your DOWNLOAD directory.
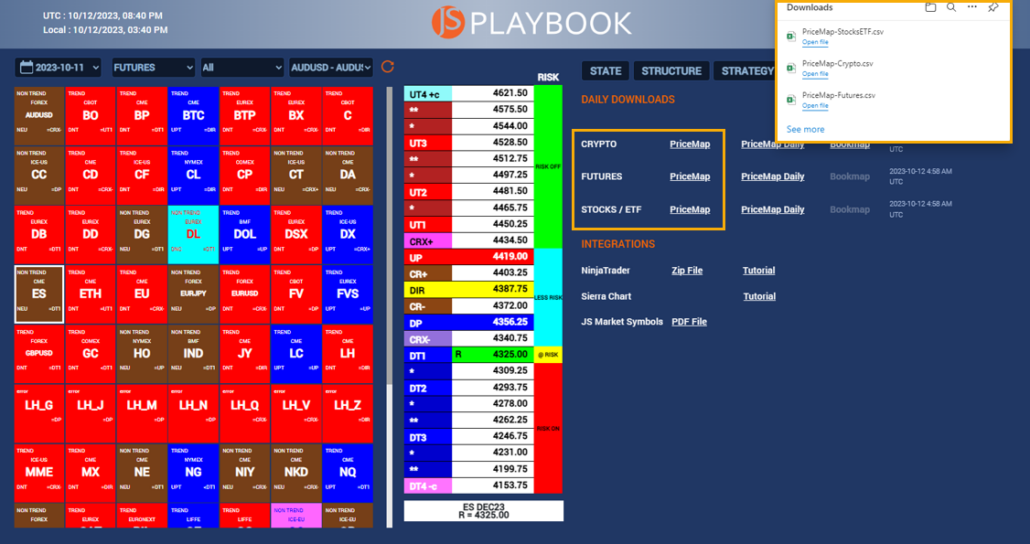
- Choose an existing directory or create a new one on your local drive to store the files. The directory name is flexible; however, consistency is key. Ensure you save and overwrite files in this specific directory each trading day.
- Avoid copying and pasting them directly from the DOWNLOAD directory. Instead, select the files and drag them to the designated data directory (e.g., C: folder). This ensures the original files are moved out of the DOWNLOAD directory.
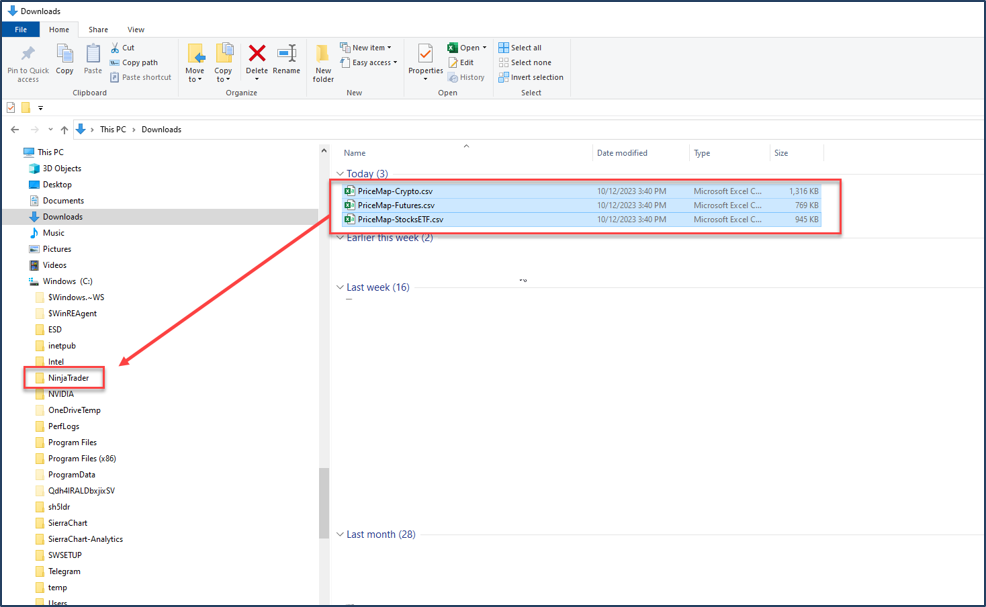
- Note: Direct copying leads to duplicate files in the DOWNLOAD directory, like PriceMap-Futures.csv. When you download again, the system will generate a new file, PriceMap-Futures(1).csv, which disrupts the integration due to the changed filename. Dragging ensures the file is moved, not duplicated.
- Remember the file path. For this example: C:\NinjaTrader\ PriceMap-Crypto.csv
STEP 2 –DOWNLOAD and IMPORT the JS NT SCRIPT
1. DOWNLOAD JS NinjaScript
Download and save the JS_NT8.zip file from the JS PLAYBOOK DOWNLOAD tab. You can save it in the same directory you created for your data files.
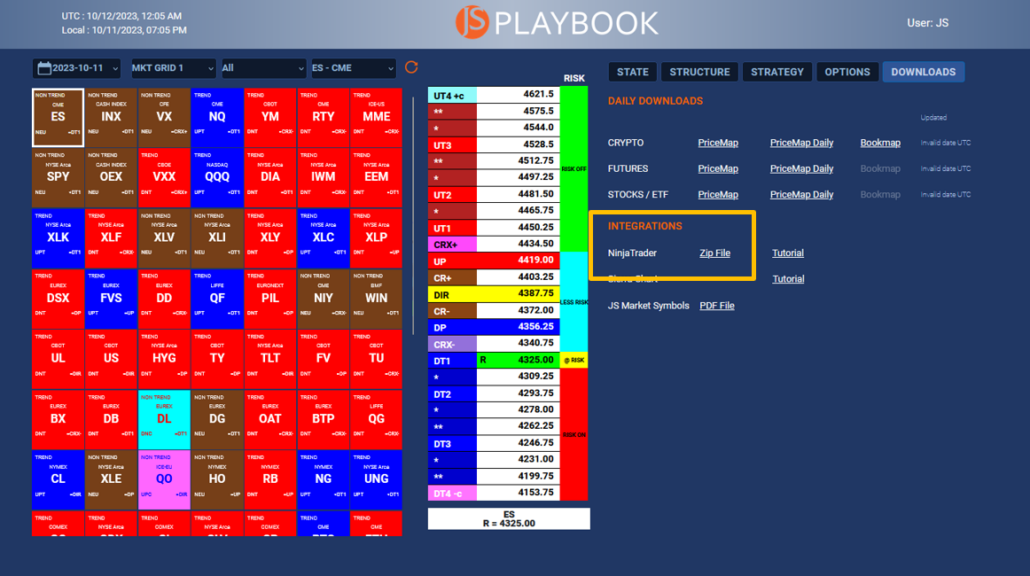
2. Remove Previous JS NinjaScript Version
- If you already have an older version of the JS NinjaScript installed, it’s essential to remove it before importing the new one. If you do not, then proceed to Step 4.
- Open the NinjaTrader Control Center.
- Navigate to TOOLS > Remove NinjaScript Assembly.
- From here, select and remove the older version of the JS NinjaScript.
- Once removed, you can proceed to import the new version.
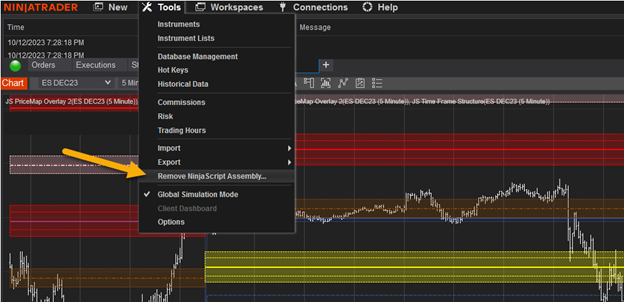
3. Import JS NinjaScript
-
- Open the NinjaTrader Control Center.
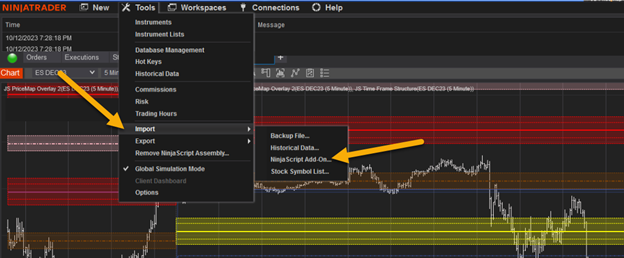
- Navigate to TOOLS > IMPORT.
- From here, select > NinjaScript Add On.
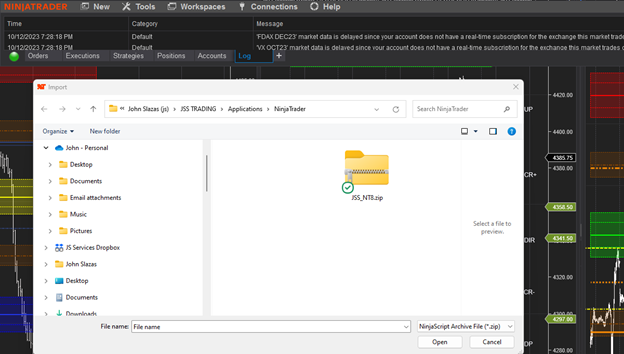
- This should open the directory that contains the JSS_NT8.zip. If not go to the directory you saved the file in, find the file and select it.
NinjaTrader will confirm the success of the IMPORT. If not close and re-open the NT application and repeat STEP 2.
STEP 3 ADD the PRICEMAP to a CHART
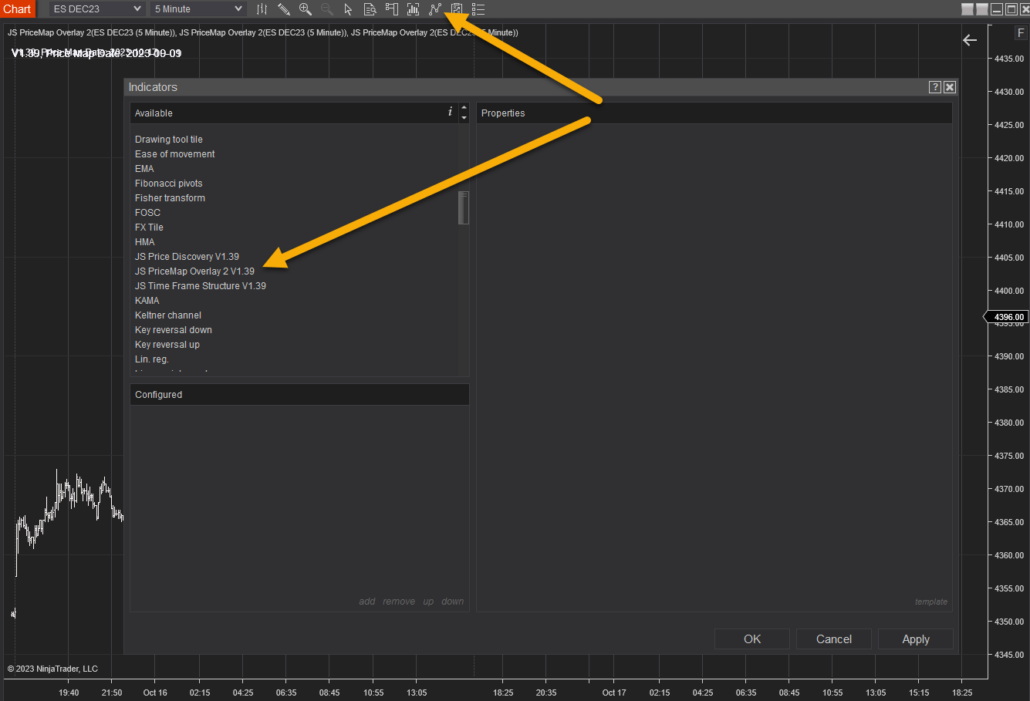
- Open the INDICATORS window and scroll down to find the JS PriceMap Overlay Indicator.
2. Select the JS PriceMap Overlay Indicator and select ADD.
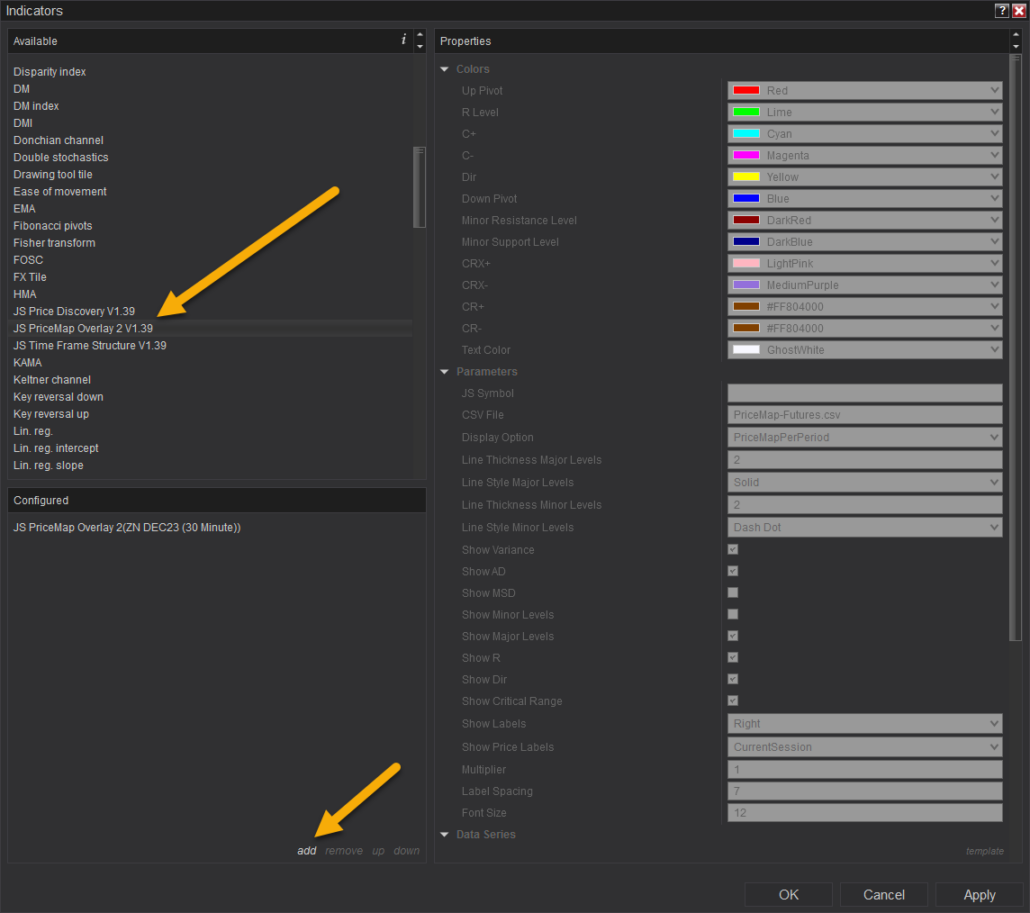
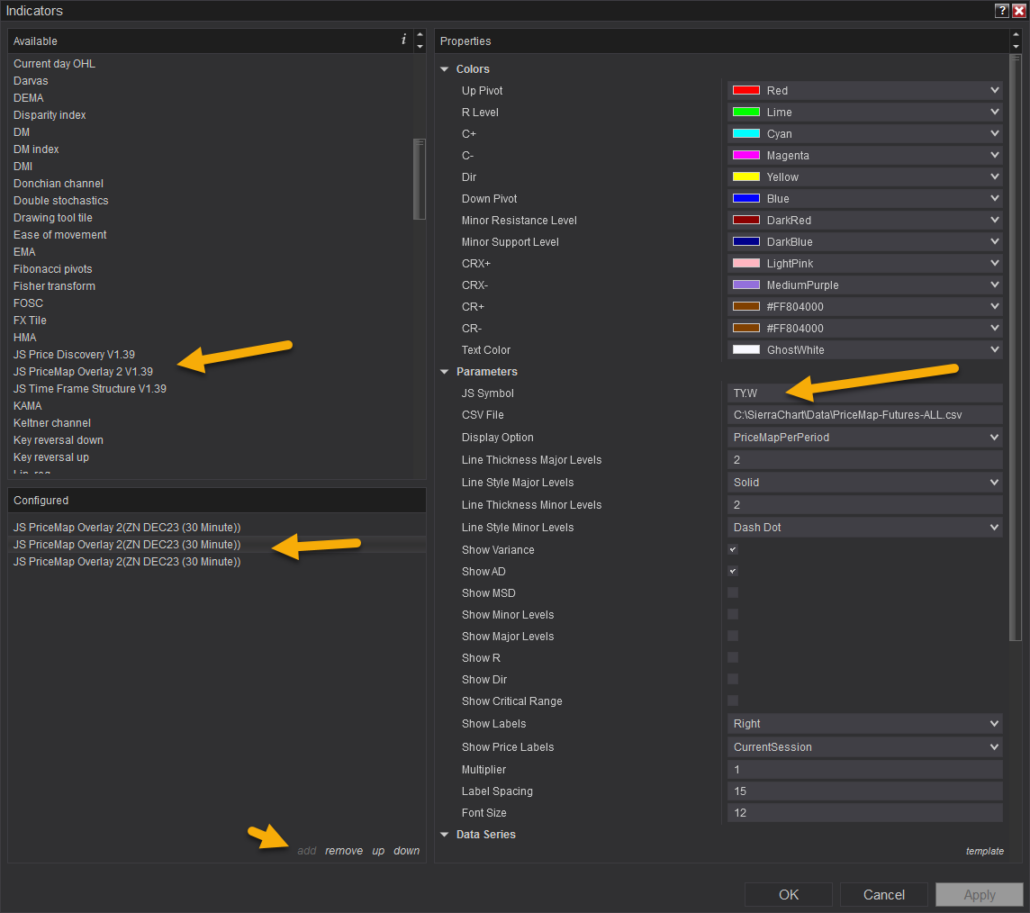
3. Enter the JS Symbol with the Time Frame for the desired PriceMap period. Example below:
TY.D = 10yr T-NOTE DAILYPriceMap
TY.W = 10yr T-NOTE WEEKLY PriceMap
TY.M = 10yr T-NOTE MONTHLY
- For JS SYMBOL LIST click HERE
4. Enter the CSV FILE path. Be sure to enter the entire directory name, file name and extension. Example below (Your path will be unique to your machine):
-
- C:\Users\JSTRADE\NinjaTrader\PriceMap-Futures.csv
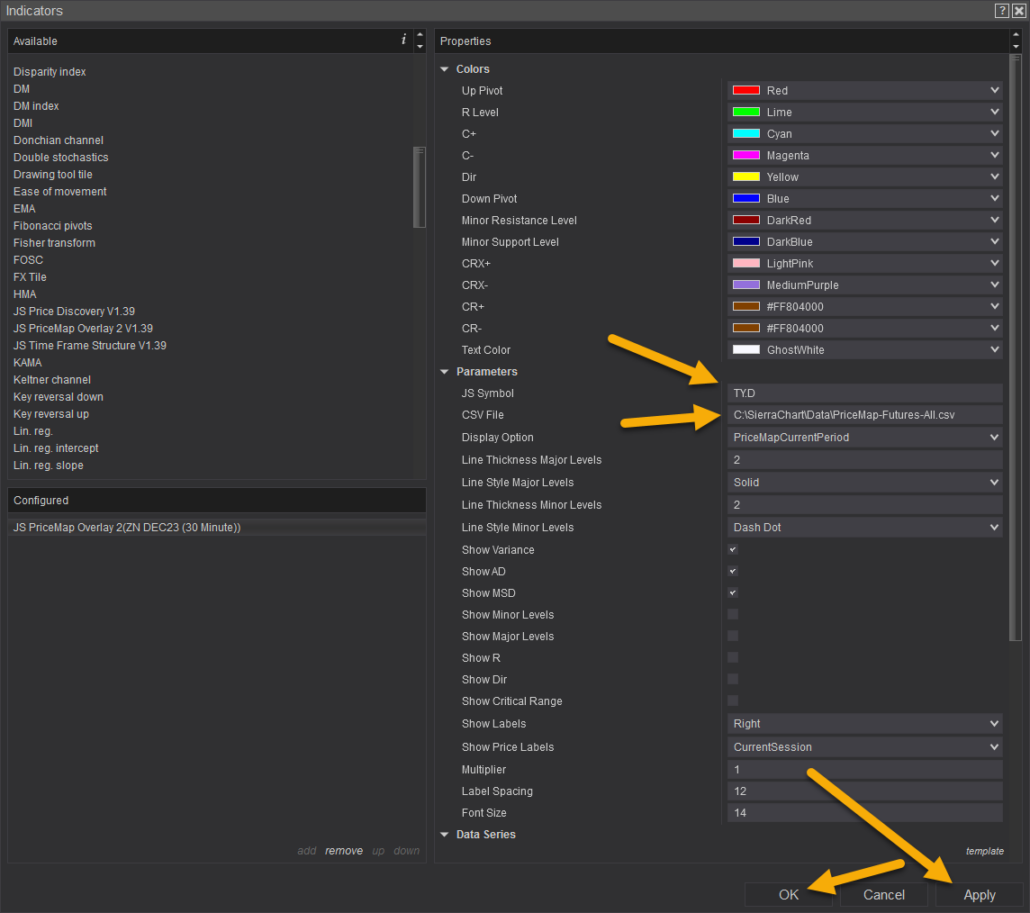
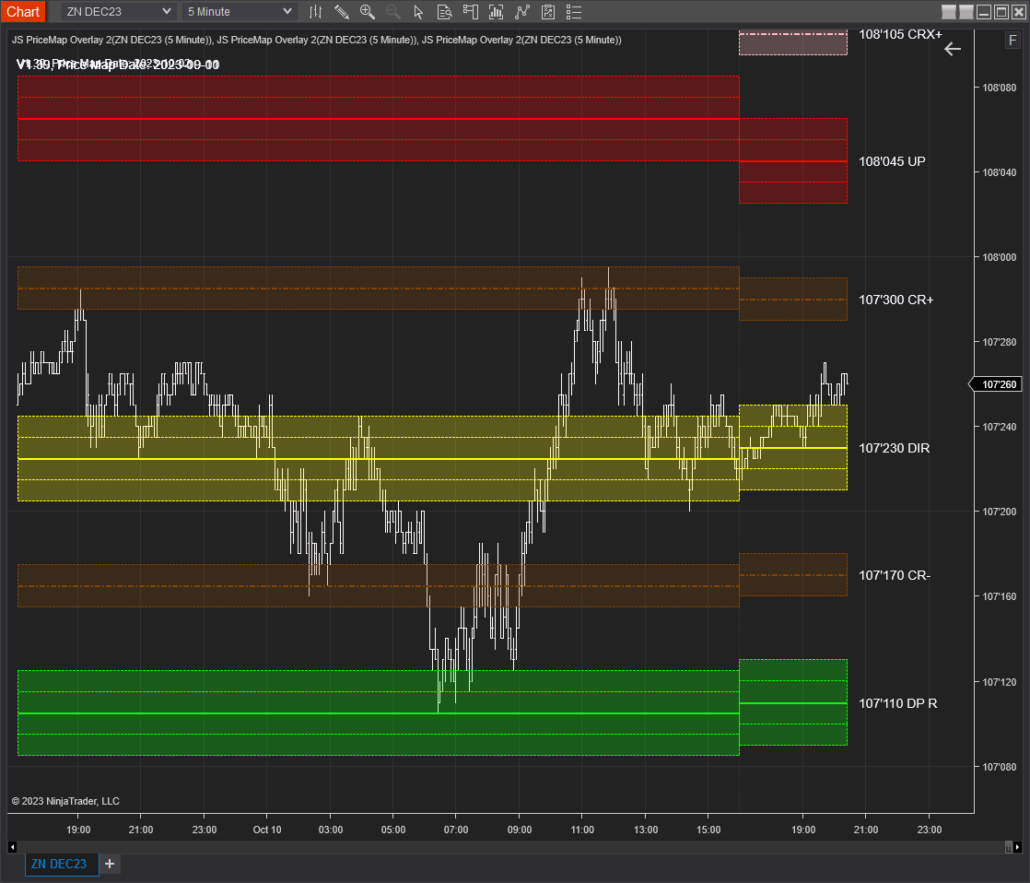
5. Click APPLY then OK. The PriceMap Levels should appear.
Trouble Shooting
If the PriceMap levels do not show up
- Be sure you are connected to the internet and NT data source connection.
- Be sure to check the spelling of the CSV PATH. The entire directory name, file name and extension are needed.
- C:\Users\JSTRADE\NinjaTrader\PriceMap-Futures.csv
- Be sure the CSV file is in the directory you entered in the CSV PATH and it has the correct date.
6. Set up All PriceMap Indicator Timeframes
- Highlight the DAILY JS PriceMap Overlay that you just created and Click the TEMPLATE button in the lower right-hand corner.
- Name and Save this template. You can then load this template in the future with your CSV path and customized settings only having to edit the JS Symbol and Time Frame extension.
- Highlight the JS PriceMap Overlay Indicator and add two additional instances to display the WEEKLY and MONTHLY PriceMap levels.
- Load the Saved Template and edit the appropriate JS Symbol extension (.W and .M).
STEP 4 EDIT the SETTINGS
The PriceMap Overlay Indicator has many customization settings. This section will go over the key ones that can ONLY be modified in the setting Properties not directly from the chart Display:
- Qualifier COLOR
- Display Options
- Price Label Display
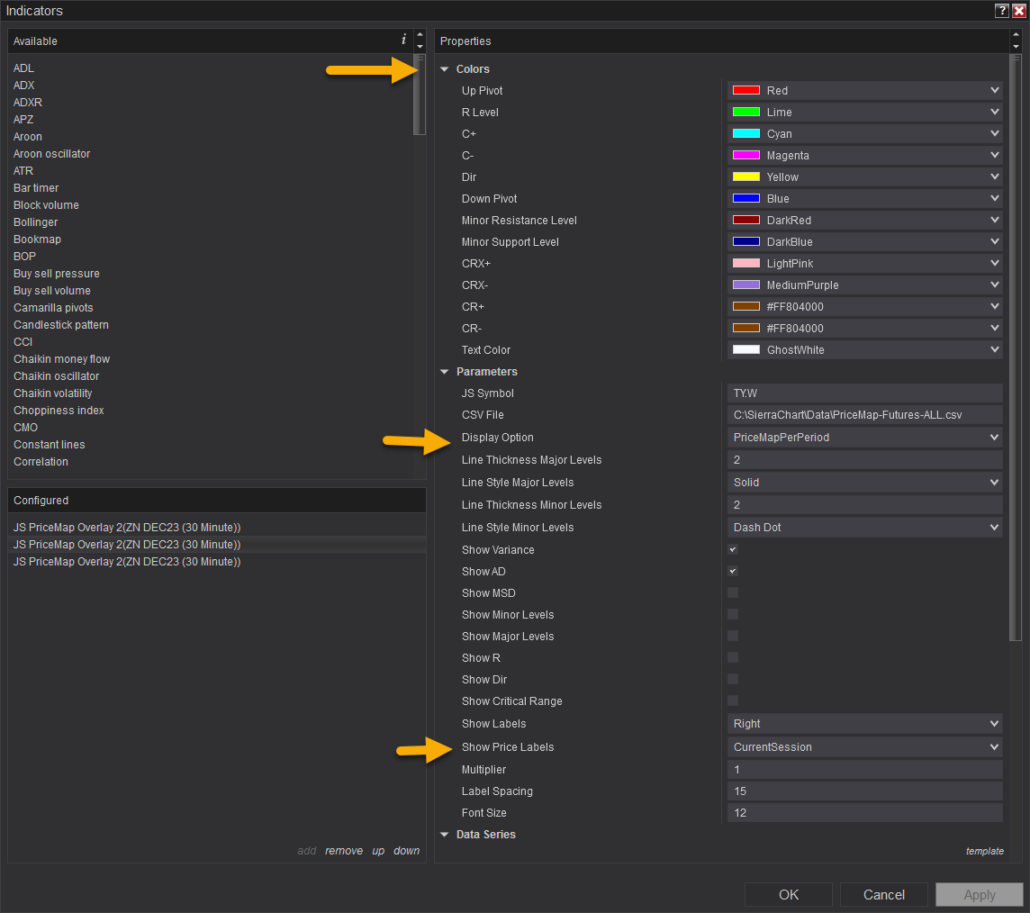
- QUALIFIER COLOR – Each of the PriceMap qualifiers coloring can be edited however we do not recommend doing so other than to change the shade slightly to contrast better with the background chart color. All qualifier colors aere standardized in the education tutorials are a key awareness component for more intuitive execution. For example, my chart background is dark and I slightly lighten the DP “Blue” to make it easier to read the qualifier label against the dark chart background.
- DISPLAY OPTIONS
- PriceMapNewPeriod – This is an advanced setting designed for specific times during the week or month and offers insight rather than structural information. Purpose: It previews potential PriceMap levels and the R LEVEL for the upcoming period, assuming the previous period close was the current periods. Key Points:
- Not Valid for Trading: These levels aren’t valid for trading decisions.
- Insight at Period Ends: For instance, when using the (.M) symbol for the monthly PriceMap, this setting provides insights on possible R LEVEL shifts in the new month while applying this display option during the end of the current month’s settlement period.
- Not Guaranteed: These previews aren’t definitive. True structure emerges only after the period closes.
- Useful for Overlaps: Gaining insights into possible shifts can be valuable for decisions that stretch into the new time frame as the New Period R LEVEL and DIR will influence momentum bias.
- Not for Daily (.D) Traders: Do not use this setting for the DAILY PriceMap. If your PriceMap levels seem off, check if “PriceMapNewPeriod” is selected in DISPLAY OPTION. Switch to “PriceMapCurrentPeriod” if it is.
Remember, use this feature wisely and understand its limitations.
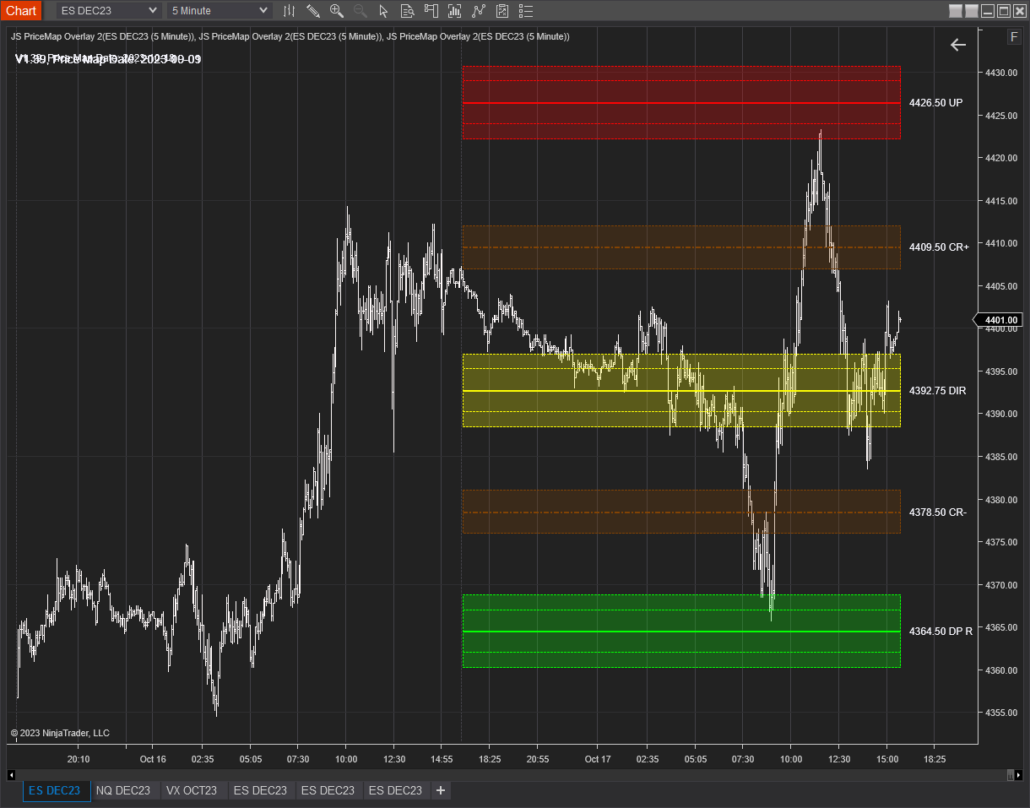
- PriceMapCurrentPeriod
- This is the recommended display setting.Purpose: It shows the levels for the current time period.Key Points:
- Valid for Trading: These are the only PriceMap levels considered valid for trading decisions.
- Stay Current: Ensure accurate and real-time trading insights by always using the “PriceMapCurrentPeriod” setting.
For optimal trading accuracy, it’s essential to use this recommended setting.
- This is the recommended display setting.Purpose: It shows the levels for the current time period.Key Points:
- PriceMapNewPeriod – This is an advanced setting designed for specific times during the week or month and offers insight rather than structural information. Purpose: It previews potential PriceMap levels and the R LEVEL for the upcoming period, assuming the previous period close was the current periods. Key Points:
- PriceMapPerPeriod
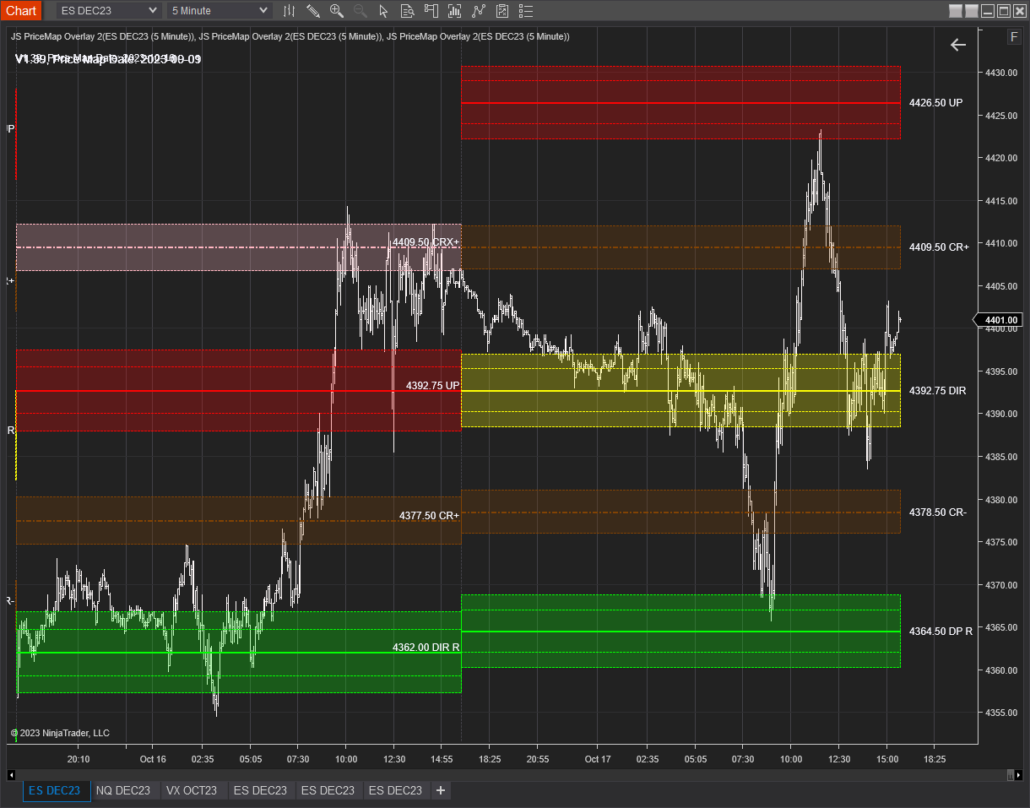
- Overview: This setting offers a combined view of the current PriceMap and its historical counterparts. Benefits:
- Deep Dive into Past Behavior: By observing past PriceMap patterns, gain a clearer understanding of market trends and behaviors.
- Inform Current Actions: Historical insights can shed light on the market’s present tendencies.
- Decision-making Guide: Keep in mind, only the current period’s levels are actionable for trading. Use historical levels purely for context and not for direct trading actions.
For effective trading, rely predominantly on the current period’s PriceMap levels.
- Overview: This setting offers a combined view of the current PriceMap and its historical counterparts. Benefits:
- SHOW PRICE LABELS
-
- ALL: Useful for those wanting a detailed view, especially when combined with the PricePerPeriod historical display for back testing purposes.
- CurrentSession: Generally the preferred setting, this displays only the labels for the ongoing trading session. It helps to avoid label overlap over price action, ensuring clarity.
- Disabled: opt for a clean view with no labels displayed at all.
-
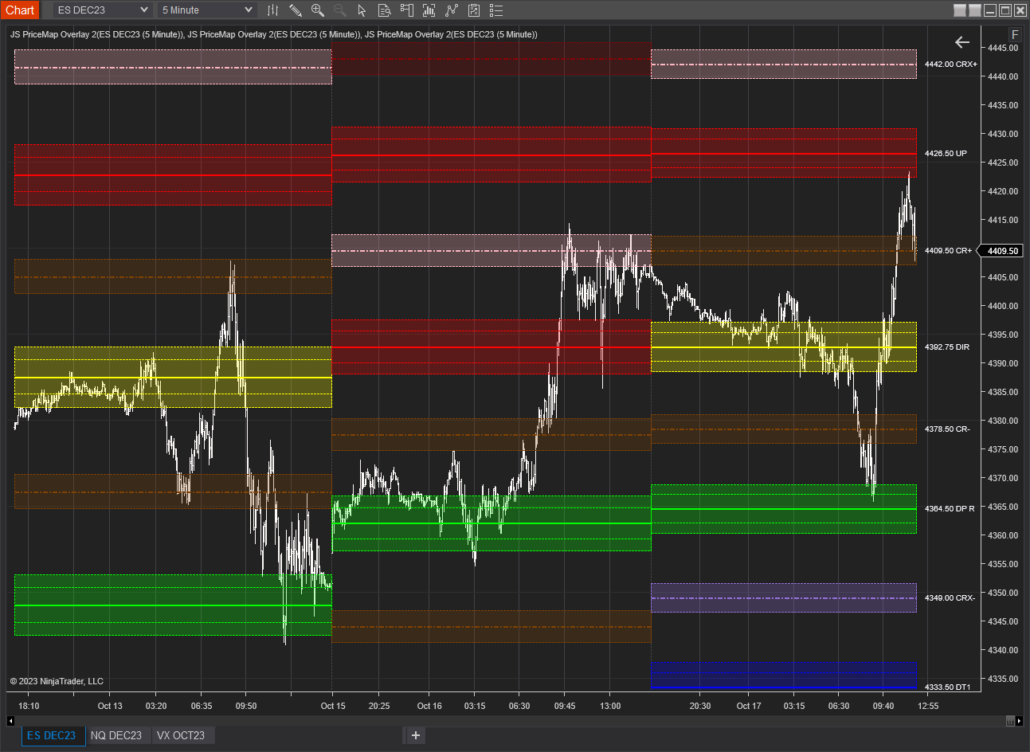
STEP 5 DISPLAY FEATURES
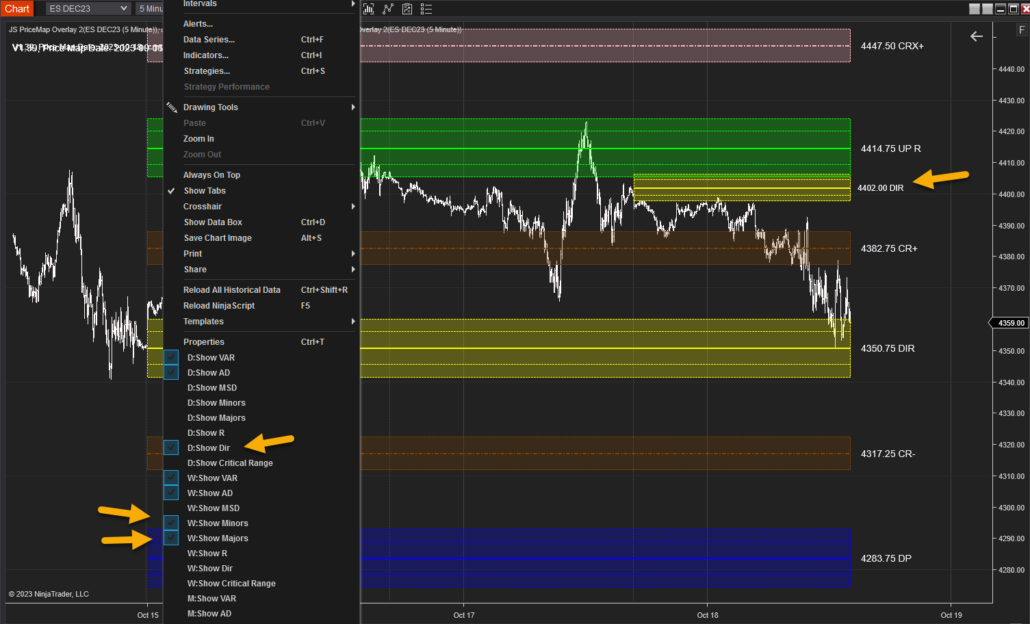
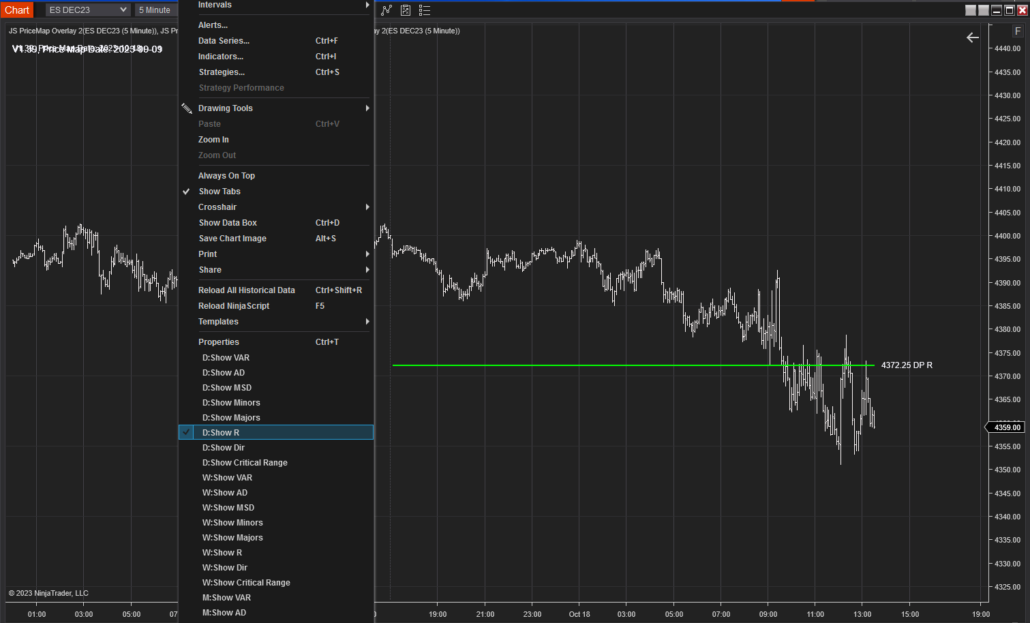
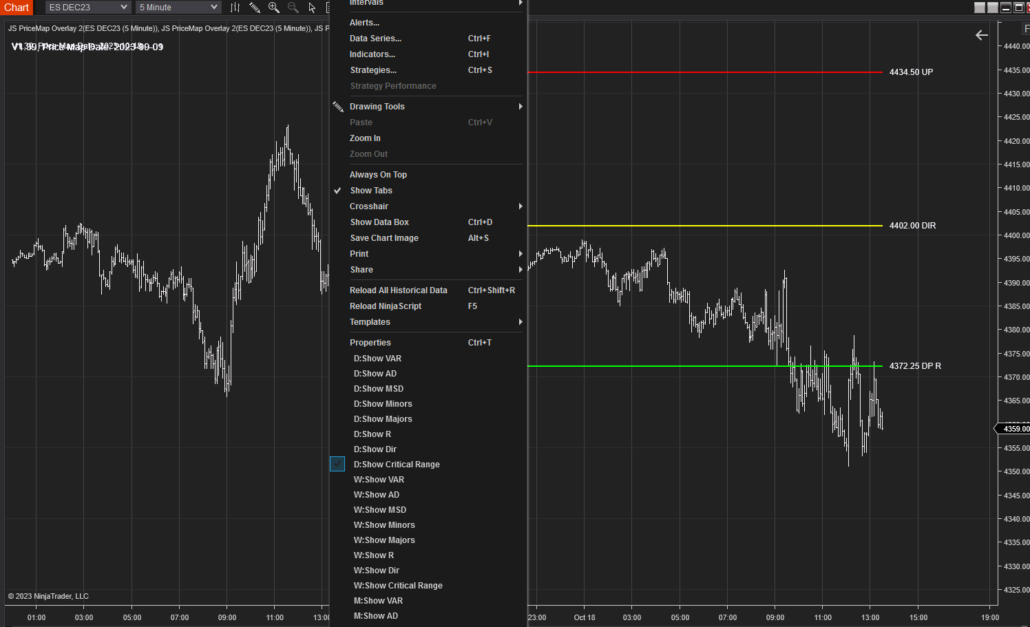
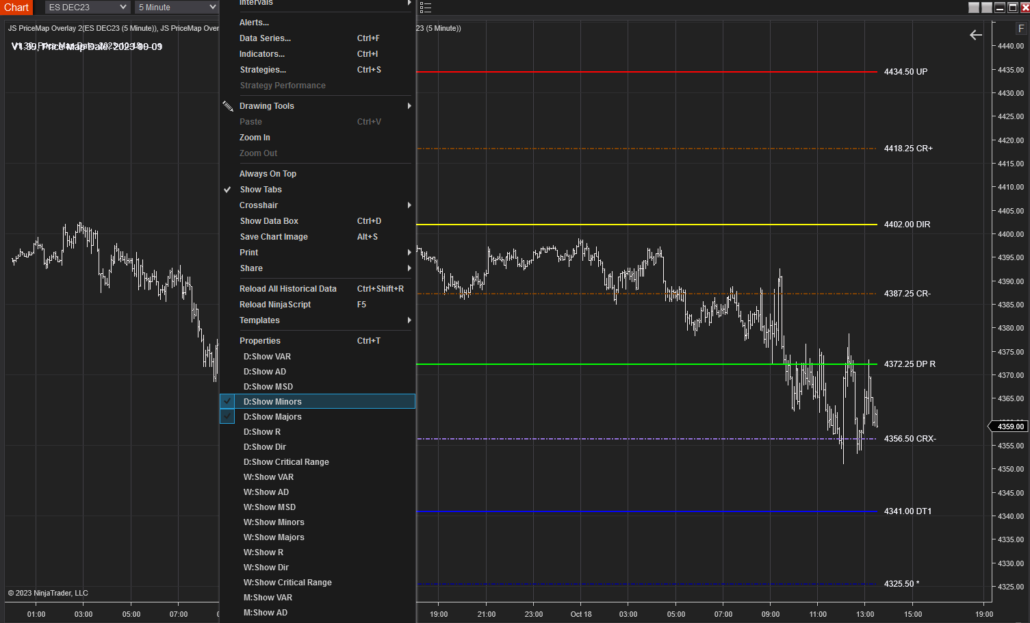
The display features are accessed by RIGHT CLICK on the chart. Here are the basic Display Features:
R LEVEL ONLY
CRITICALRANGE ONLY
ALL MAJOR and MINOR LEVELS
VAR Metric Boundary
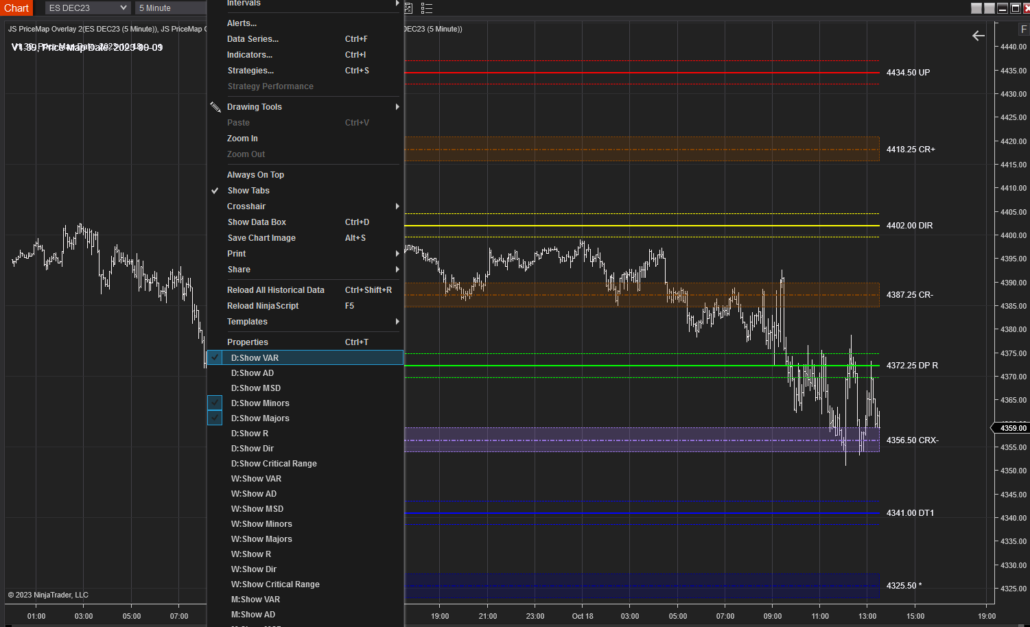
AD Metric Boundary
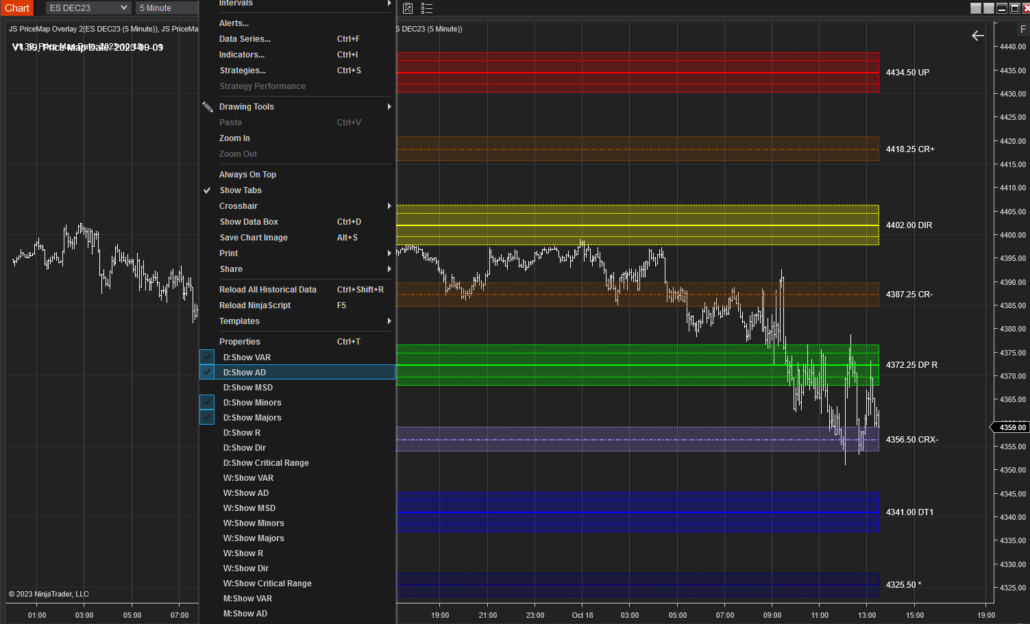
MULTI TIME FRAME VIEW
Additional Features
JS TIME FRAME STRUCTURE
The JS TIME FRAME STRUCTURE Indicator can be accessed in the same manner as the JS PriceMap Overlay. The TIME FRAME STRUCTURE plots the Previous Period HIGH, LOW, CLOSE and MIDPOINT and the Current Period HIGH, LOW and MIDPOINT.
SET-UP INSTRUCTIONS
- Add the Time Frame Structure Indicator
- Add the JS Symbol Only. Do not add an extension.
- Add the csv file path and file name.
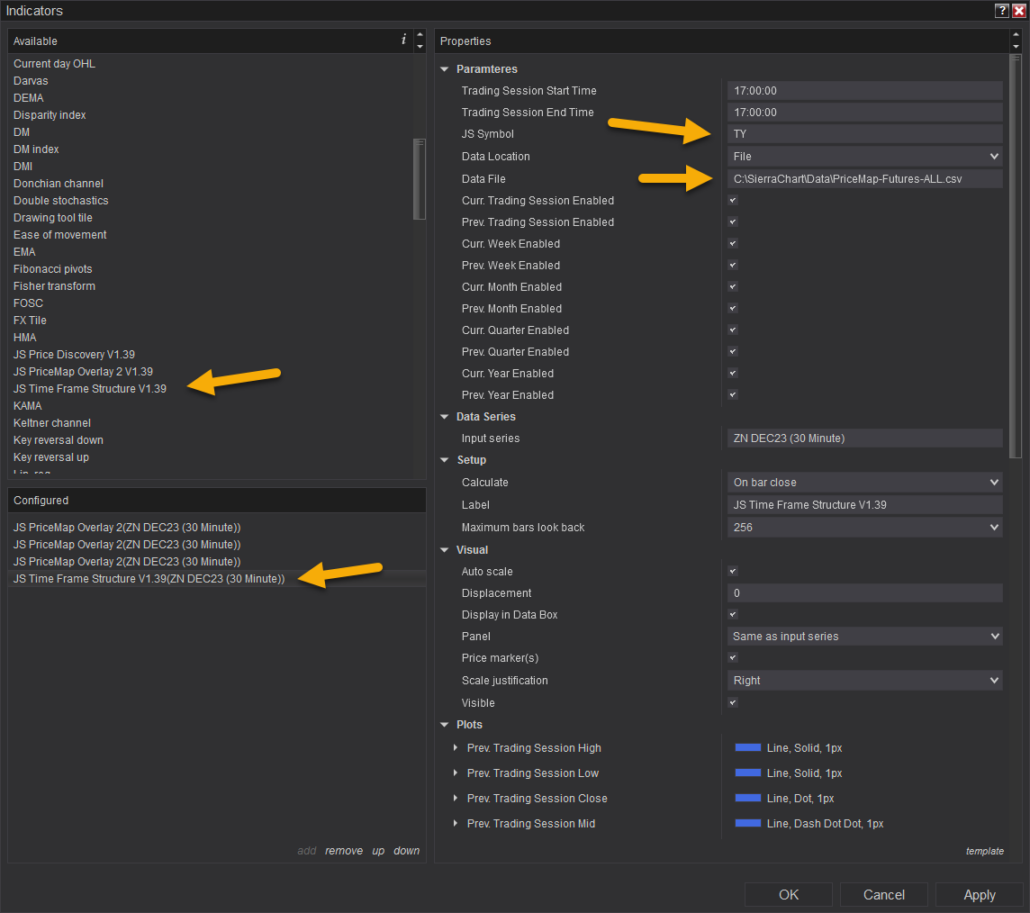
4. Click APPLY and OK
DISPLAY SETTINGS
The default setting is for the indicator to display all time frames for both the Current and Previous Period.
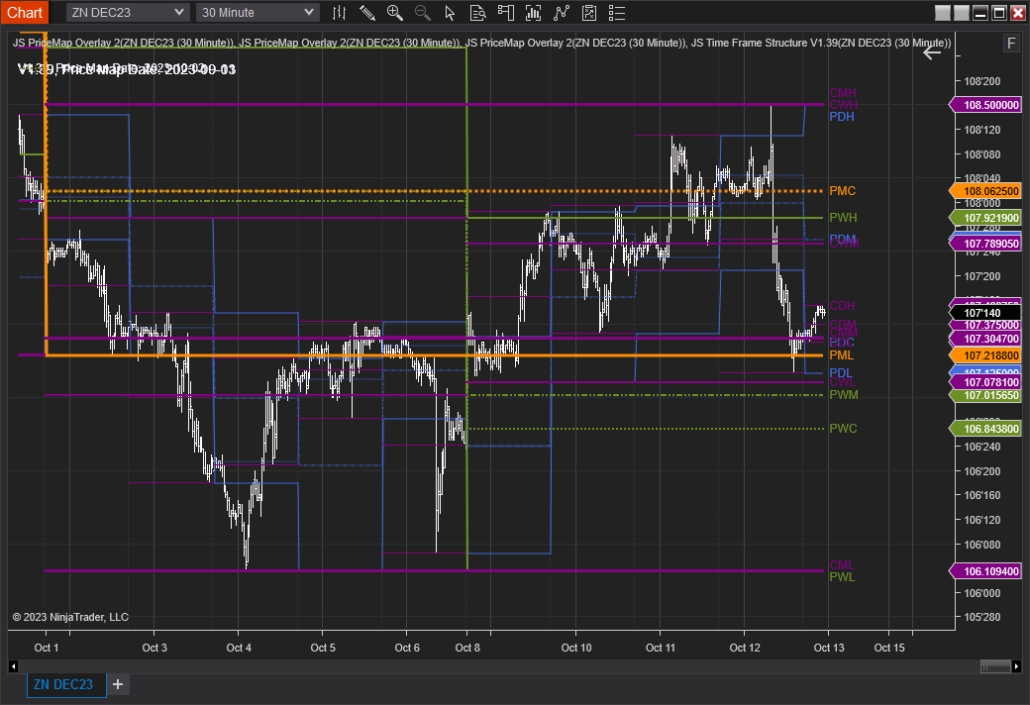
RIGHT CLICK on the chart to select the desired Time Frame and period to display. You may have to scroll down to view all the display options.
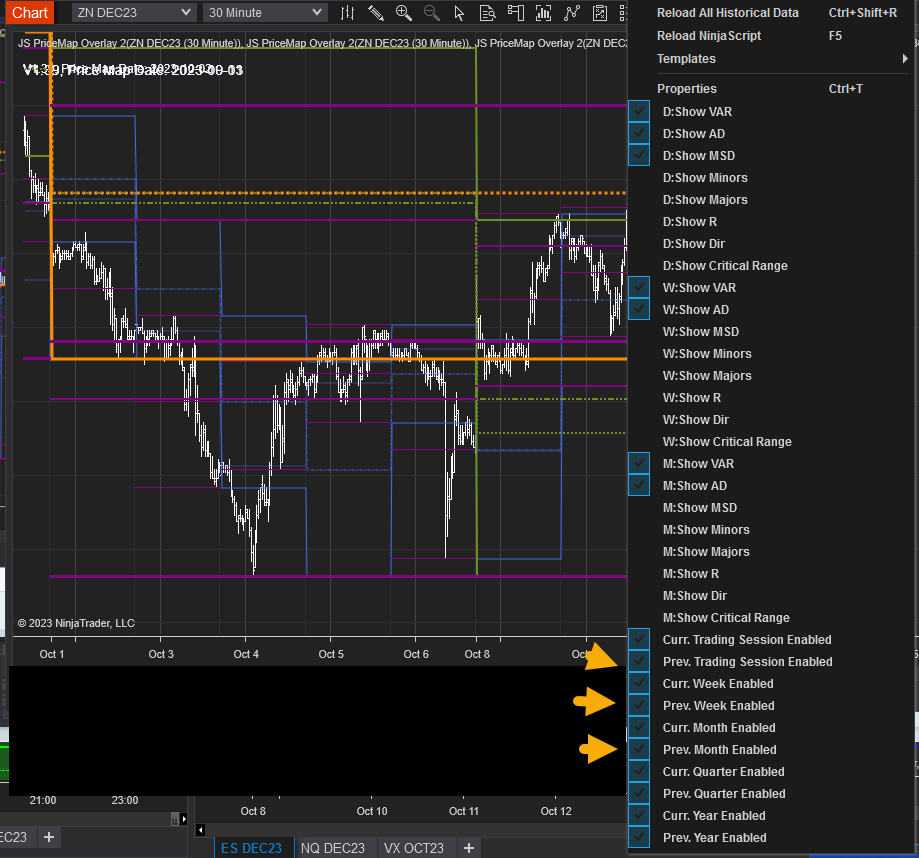
Below is a view of the PREVIOUS DAY and the PREVIOUS WEEK parameters.
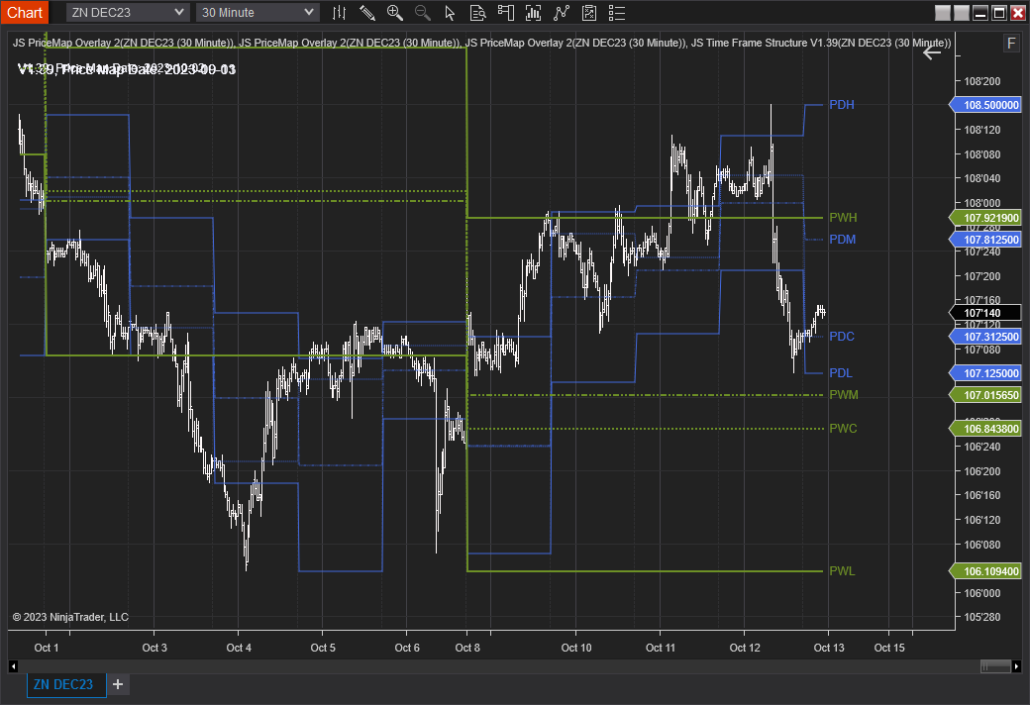
NOTE on Time Frame Structure:
Prioritizing the PREVIOUS PERIOD TIME FRAME STRUCTURE is essential, as it holds more significance than the CURRENT PERIOD. The data for the CURRENT PERIOD, sourced from the data file, can be outdated, especially if the market is recording new highs or lows for that time frame.
However, as we approach the end of a time frame period, the CURRENT PERIOD structure gains relevance. A notable exception is the CURRENT PERIOD MIDPOINT, equivalent to the period’s VWAP, which remains consistently valid.
Recommendation: Focus primarily on the PREVIOUS PERIOD. It serves as the main time frame structure and provides a more reliable foundation for trading decisions.


