
Analysis – Personality Profile Overview
PERSONALITY PROFILE QUESTIONAIRE OVERVIEW The personality profile questionnaire utilizes the NEO Five Factor Inventory derived from the research of Robert ... Read More

Analysis – TradePlan Development Worksheet
MyTradePlan This questionnaire provides the foundation to develop a TradePlan that will allow you to: Continually evaluate your trading in ... Read More
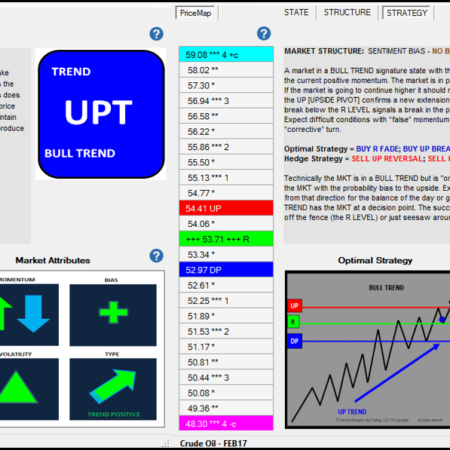
Creating a Structured Trading Approach
JSAnalytics offers a foundation to create a more structured trading approach. It does this by providing the basic ingredients needed to make ... Read More
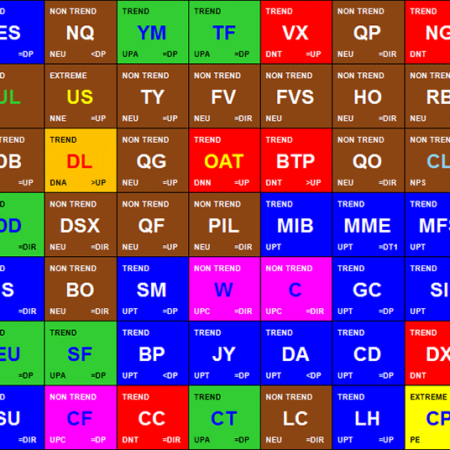
Getting Started – Market State
MARKET STATE Standardize your method with the characteristics of the market STATE using JSServices MarketColor Analytics to create a more sustainable trade ... Read More

Market State Awareness
The EDGE in discretionary trading comes in your ability to make intuitive decisions. It is the fluid execution of a ... Read More
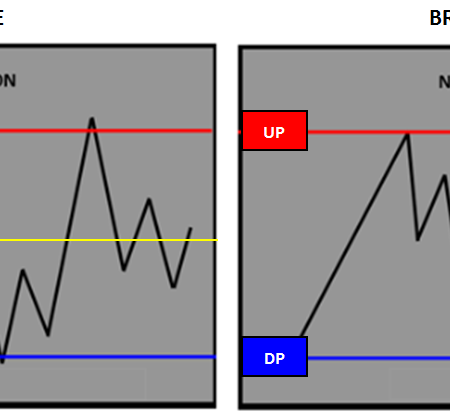
Market State Transition
MARKET STATE TRANSITION A market STATE condition as a definition does not change and is the same from day to ... Read More

Market Strategy Insight
FACT FOUNDATION When you look at a chart at the end of the day the price action seems self-evident even ... Read More
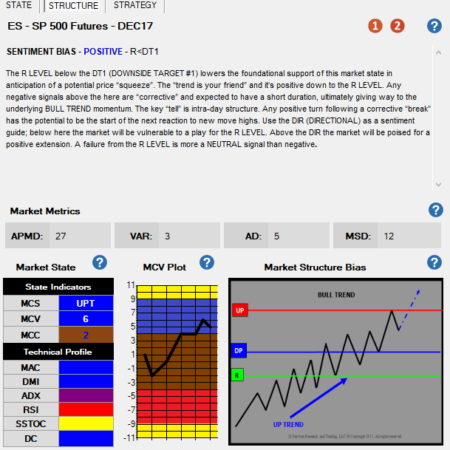
MarketColor as the basis for a Structured Trading Approach
MarketColor defines the context of the current condition or market STATE. It is the underlying "technical" tone or environment for the ... Read More
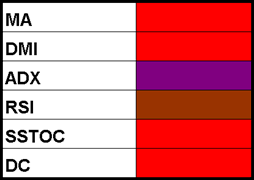
MarketColor Profile Analysis
MARKETCOLOR PROFILE Technical indicator analysis by design is lagging. It is always looking backward and “waiting” for the last price ... Read More
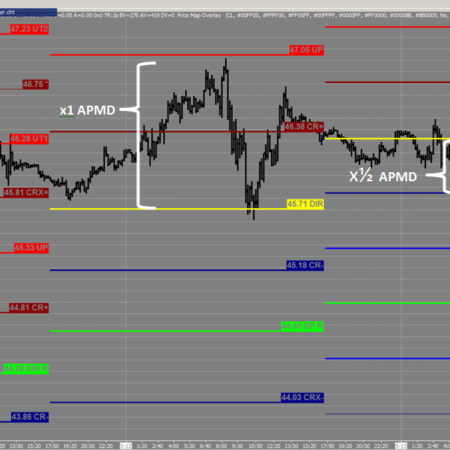
MarketMetrics – APMD (Average PriceMap Distance)
Average Price Map Distance (APMD) APMD (Average Price Map Distance) = the price segment distance the MKT is trading in ... Read More
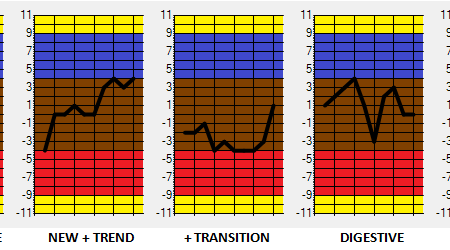
MCC Explanation
MC VALUE CHANGE (MCC) The MCC identifies the day to day shifts in the MCV. If the MCV is a ... Read More
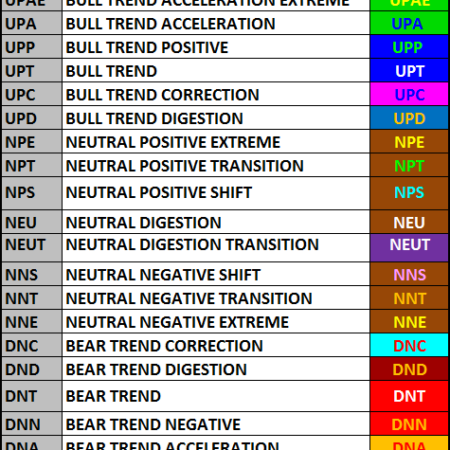
MCS Explanation
MARKETCOLOR STATE (MCS) The MC VALUE (MCV) is a bounded scale study which has a finite set of MC VALUE CHANGE ... Read More
MCV Explanation
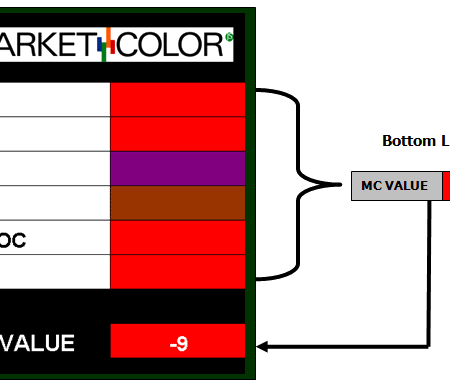
MC VALUE (MCV) The MCV is a summation of the different MarketColor technical indicator systems and represents a market's technical ... Read More

MCV Relative Strength
RELATIVE STRENGTH The MC VALUE is a single number in a bounded scale. This feature provides a quick “relative strength” comparison to ... Read More
MCV Size Management
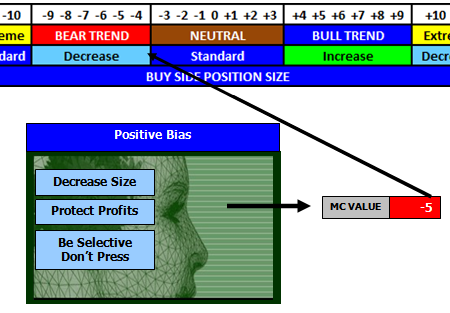
SIZE MANAGEMENT The MCV can be used for size management to gauge the amount of leverage used for a signal ... Read More
MCV Strategy Selection
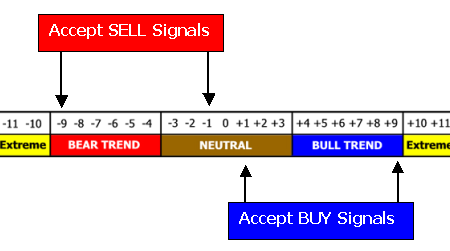
STRATEGY SELECTION The MCV is an objective Technical Indicator, which can be used as a criteria filter for confluence with ... Read More
Optimizing TradeTactics
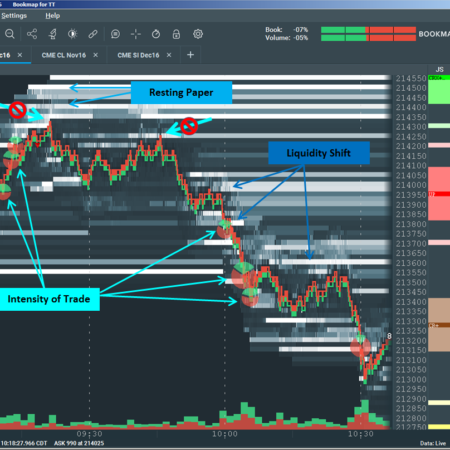
TradeTactics can be optimized when executed within market metric thresholds and their effectiveness improved by using real time order book ... Read More

Peak Performance through a Standardized TradePlan
The purpose of this document is to provide awareness on the steps needed to apply JSServices Analytics to Standardize a ... Read More

Personality Profile
Having access to a simple, yet powerful map that describes how your mind prefers to process market information, execute decisions, ... Read More
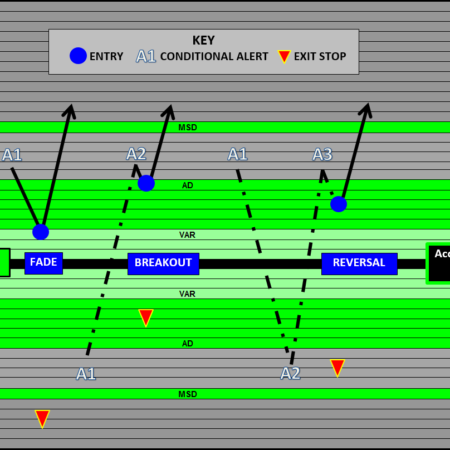
PlayBook Entry Strategy Tactics
Trade Entry Tactics The PlayBook Strategy Themes represent the best risk defined opportunities for the trade session and are defined ... Read More
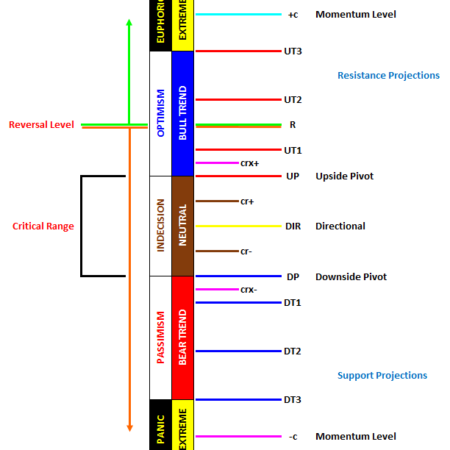
PriceMap Definitions
JSServices PriceMap Analytics use quantitative methods to objectively define the price STRUCTURE of the market STATE. The knowledge of the ... Read More
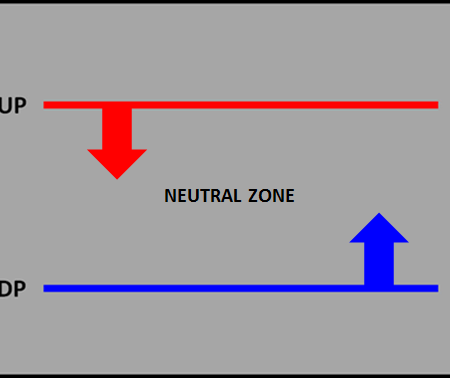
PriceMap Qualifiers CriticalRange
CriticalRange The PriceMap defines the structure of the market state by identifying the key price band or CriticalRange for the ... Read More
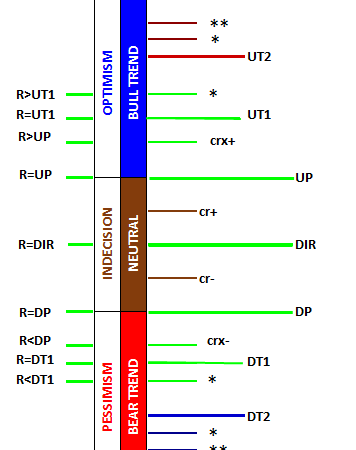
PriceMap Qualifiers R LEVEL Positions
The PriceMap is the framework of the market STATE and the R LEVEL defines the behavioral sentiment bias for the ... Read More
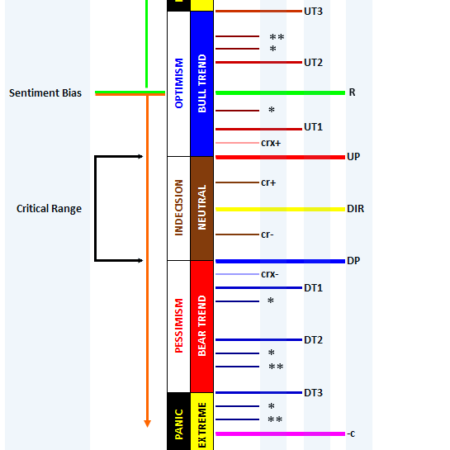
PriceMap QUICK START
PRACTICAL APPLICATION The PriceMap provides traders with the ability to anticipate opportunity at key structure points and create risk defined ... Read More

PriceMap R LEVEL
R LEVEL The PriceMap defines the price structure of the market state by identifying the sentiment bias for the trade period ... Read More
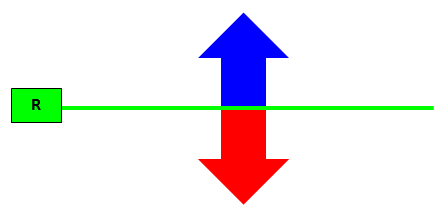
R LEVEL – Market Structure Bias (MSB)
SENTIMENT BIAS – The R LEVEL The R LEVEL [Reversal Level] is the “Over-Under” number for the trade period. Trading ... Read More
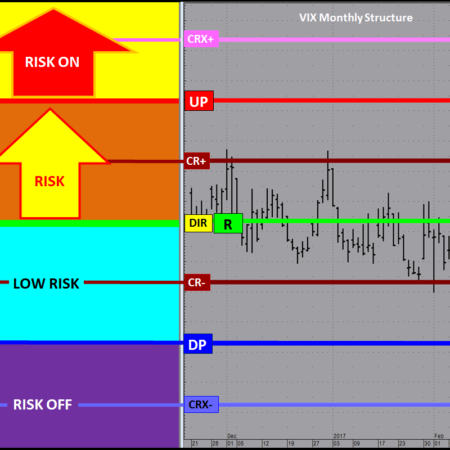
Risk State
RISK STATE Hedging is about managing risk which can be defined in term of volatility. Volatility Indices identify the RISK STATE or condition of ... Read More
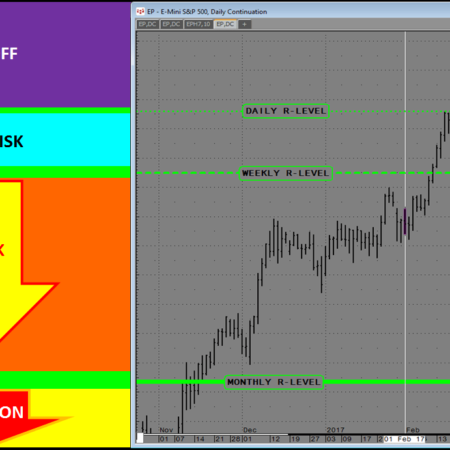
Risk Structure
RISK STRUCTURE Volatility Indices are used to identify the underlying risk condition or STATE a market is currently in. The PriceMap ... Read More

