PriceMap Overview
As the market moves up and down during a trade session, making sense of the price action without any structure is a challenging task. The PriceMap provides this structure by defining a framework that identifies the expected price action based on the characteristics of the current market state. Real clarity comes from observing price action within the PriceMap structure in the context of the market state.
PriceMap Foundation
In a general sense the PriceMap views the market as a staircase or ladder. As the market moves from step to step, what once was support becomes resistance. As each level is successfully breached, further gains or losses are expected to the next level on the PriceMap in the direction of the violation. An un-sustained violation of a PriceMap level is a sign of exhaustion, signaling a price move back to the previous level. It is important to understand these are not a series of simple support and resistance levels, which are too subjective to quantify an opportunity. The PriceMap is a set of objective quantitative technical levels, organized into a framework that provide structure in the context of the market state.

PriceMap Technical Explanation
PriceMap Framework
The PriceMap Framework is based on a set of key quantitative technical price levels. The levels are divided into three groups: directional levels, validation levels, and target levels. These groups of technical levels are then further used to define action qualifiers and market metrics. Together these components form the PriceMap Framework. The PriceMap Framework provides the structure required to enable a consistent approach in understanding price action and market momentum within a trade period. This structured approach is the foundation for strategy construction, such as our Playbook, and risk management that can be applied across all markets and asset classes.
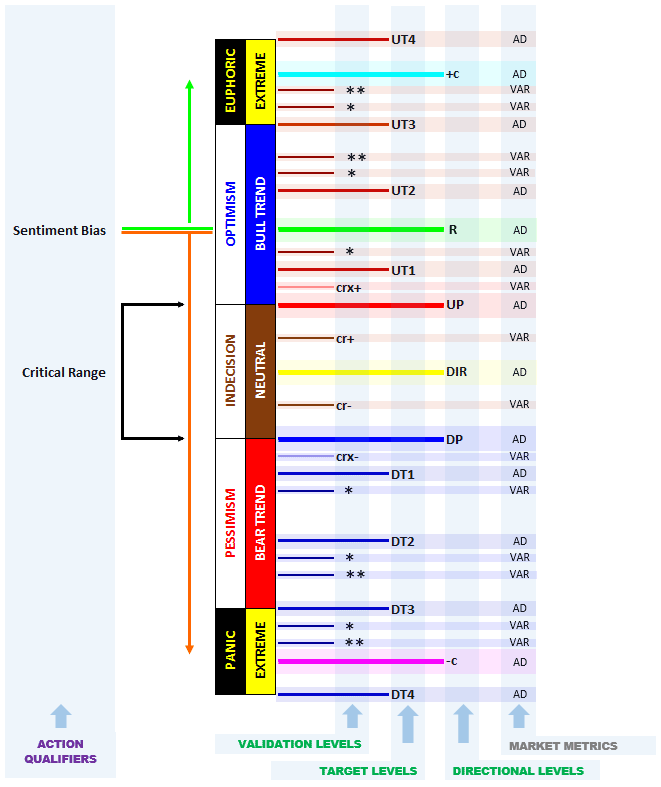
PriceMap Market Framework Definitions
Traders can integrate the PriceMap Framework into their current trading method using our integration tools or take advantage of our established integration solutions.
PriceMap Directional Levels
Directional Levels forecast a change in the market state. The levels define the boundaries that signal if the price action within a session is going to contain momentum and maintain the structure or break structure and change state. The levels also predict the point of dynamic equilibrium where increased levels of liquidity can be anticipated to offer the most consistency. Trading tactics are optimized when aligned with the Directional Levels which serve as the entry points into our PlayBook strategies.

PriceMap Directional Levels
- UP (Upside Pivot) is the upper boundary or the resistance level used to signal positive changes in market state characteristics. This level forms the top of the Critical Range.
- DP (Downside Pivot) is the lower boundary or the support level used to signal negative changes in market state characteristics. This level forms the bottom of the Critical Range.
- DIR (Directional) is a classic pivot point that identifies the directional bias and is the initiation point for new market trend moves.
- R (Reversal Level) is the dynamic point of equilibrium that defines the Sentiment Bias for the trade period. This is the best entry level to create consistency in your trades.
- -c, +c (Continuation Momentum) are the levels that identify the technical “event” extremes which also act as target forecasts for a multi session trend move.
PriceMap Validation Levels
Validation Levels confirm change in market state. As the price action in a trade period either violates or is sustained by these levels, specific insight in terms of confirming the shift in momentum and the transition to a new market state can be made . The Validation Levels can also be used for position management within a trade strategy.
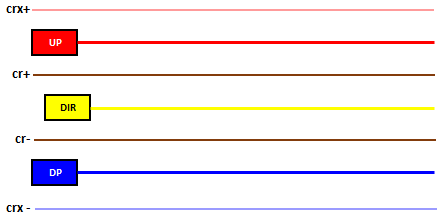
PriceMap Minor Levels
- crx+, crx- (CriticalRange Extreme) define the boundary extremes of the UP and DP Directional Levels which validate or deny a UP or DP breakout. A UP or DP breakout signals a market state change.
- cr+, cr- (Critical Range) define the mid-points, not necessarily symmetrical, between the UP / DIR and the DIR / DP. These levels validate momentum shifts from the DIR as well as follow through potential for UP or DP reactions.
- *, ** (Minor Star) represent the minor structure levels that validate or deny the ability of momentum to “trend” during a trade session.
PriceMap Target Levels
Target Levels determine the magnitude of the change in the extensions or shifts in market state. By observing the price action through the various Target Levels, deductions can be made regarding the strength of market momentum which determines the degree of change in market state. Target Levels can also be also used for entry but are best suited as exit targets for DIR, UP and DP breakout signals.
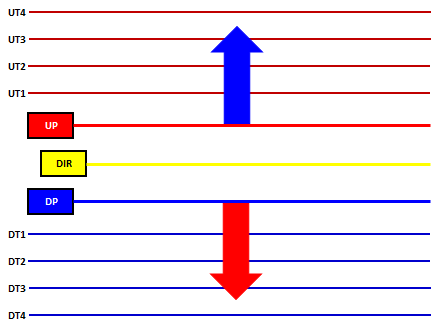
PriceMap Major Levels
- UT1/DT1 (Upside Target 1/Downside Target 1) identify the minimum level of an UP/DP breakout.
- UT2/DT2 (Upside Target 2/Downside Target 2) identify the expected level for an UP/DP breakout and the likely exhaustion point for any NON TREND market state condition.
- UT3/DT3 (Upside Target 3/Downside Target 3) identify the optimal level for a UP/DP breakout under “normal” trading conditions and likely exhaustion point for any TREND state condition.
- UT4/DT4 (Upside Target 4/Downside Target 4) identify the extreme level for a session event. The UT4/DT4 can also be noted as a multi session target for any TREND state condition.
PriceMap Action Qualifiers
The PriceMap Action Qualifiers provide the logical structure that confirms if the characteristics of the market state are true and will persist or are changing. The qualifiers also identify how sentiment will skew the characteristics and influence any change in the current state condition. The PriceMap Action Qualifiers are the market structure framework for the trade period and the basis of JSServices PlayBook Strategies.

PriceMap Action Qualifiers
Critical Range
The CriticalRange represents the hard level boundary, outlining the price structure that defines each unique market state. The CriticalRange provides insight to when shifts in state will occur by identifying where they will occur.
For Example:
- HOLD STRUCTURE – A market in a NON TREND type state will continue to perform to it’s “sideways” characteristics as long as price action is contained within the CriticalRange UP | DP parameters.
- BREAK STRUCTURE – A market in a NON TREND type state whose price action breaches the CriticalRange extremes (UP | DP) signals that the state condition characteristics are no longer true and the condition and its characteristics are changing or transitioning into a new market state.
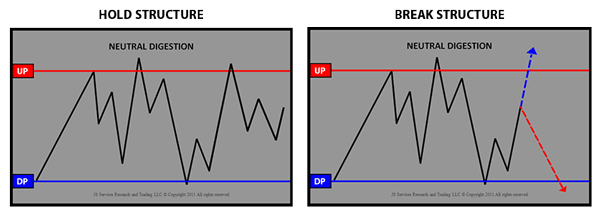
PriceMap CriticalRange Action Qualifier Example
In general: Trading within the CriticalRange identifies the condition as NON TREND and outside the CriticalRange as TREND. When price action is observed within the CriticalRange structure, in the context of the market state, awareness is improved to validate current conditions.
Sentiment Bias
The Sentiment Bias or R-LEVEL is the price level where the bias for the trade period shifts from positive to negative and vice versa. This FACT further defines the market state characteristics by its position on the PriceMap and is the level with the most influence for the trade period.
For example:
- POSITIVE SENTIMENT – An R-LEVEL below the market in a BULL TREND market indicates a POSITIVE SENTIMENT bias, is in alignment with the STATE characteristics and has a trend “continuation expectation”.
- NEGATIVE SENTIMENT – An R-LEVEL above the market in a BULL TREND market indicates a NEGATIVE SENTIMENT bias, is in conflict with the STATE characteristics and has a “corrective expectation”.
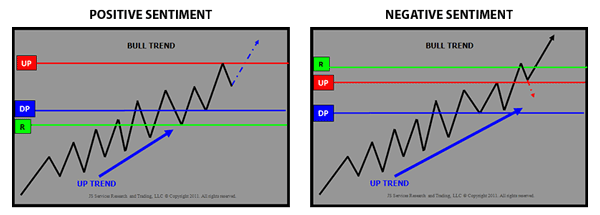
PriceMap Sentiment Bias Action Qualifier Example
In general: Trading above the R-LEVEL is positive and below negative. Observing the differential between the current price and the R-LEVEL provides insight to its influence as either a repellent when near or attraction when far away.
PriceMap Market Metrics
The PriceMap Analytics provide several Market Metrics which are used to determine the risk/ reward viability of an opportunity as well as identifying the thresholds that outline the areas for signal acceptance and confirm a structure break.
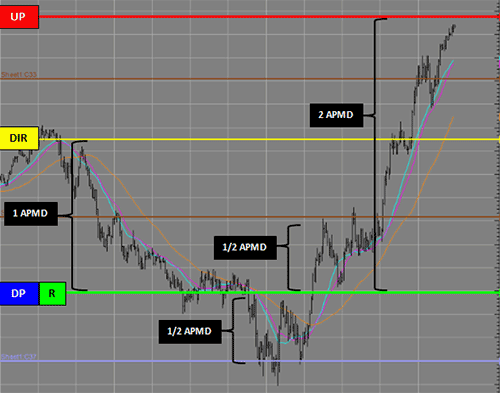
PriceMap APMD Market Metric Definition
- APMD (Average PriceMap Distance) provides a “reward” or target metric for a trade opportunity by identifying the price segment distance the market is trading in. Markets typically move in ½, 1x and 2x APMD impulses, the structure of which is outlined in the full PriceMap Framework.
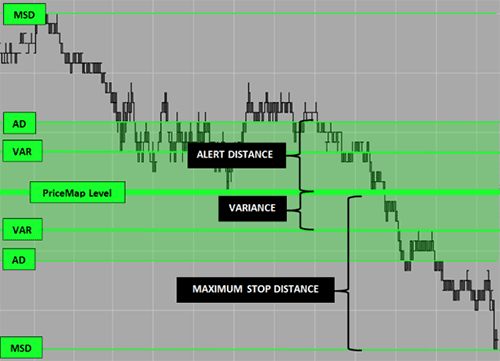
PriceMap VAR, AD, MSD Market Metric Definitions
- VAR (Variance) metric defines the variance surrounding a PriceMap level that should be considered “at the level”. This metric can be used for risk management but its primary function is to identify the optimal ENTRY areal. The VAR is also the signal acceptance threshold for a minor level.
- AD (Alert Distance) metric defines the signal acceptance area surrounding a Directional or Major PriceMap level. This metric also qualifies the structure thresholds for stop placement and conditional alerts for JSServices PlayBook strategy themes.
- MSD (Maximum Stop Distance) the maximum area of influence of a Major PriceMap level, which can be used as a conditional alert or stop risk level.
![]()


