
MarketMetrics – APMD (Average PriceMap Distance)
Average Price Map Distance (APMD)
APMD (Average Price Map Distance) = the price segment distance the MKT is trading in for the defined trade period.
IF we know the price segment distance the MKT is trading in, THEN we can forecast or anticipate price movement.
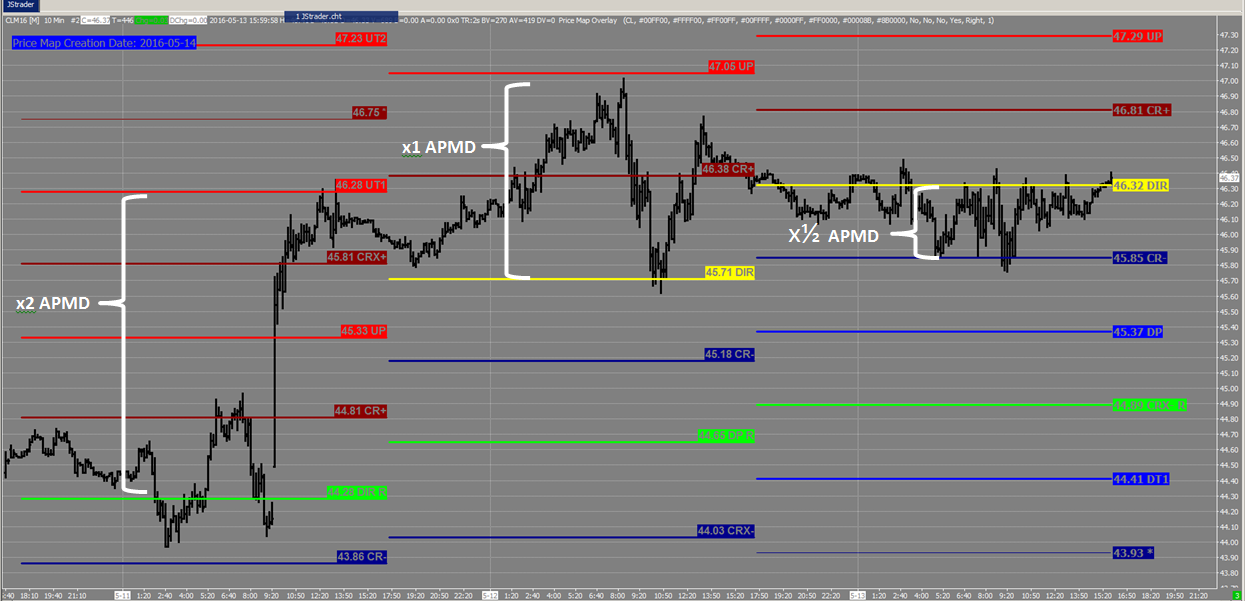
Markets are in a constant state of expansion and contraction. The ebb and flow of the expansion and contraction can be measured as a function of the APMD. Typically a MKT moves in ½, x1 and x2 APMD segment impulses. This is “typically”, or rather, what is more likely to occur, as x3 and x5 segment moves do happen during event conditions. As a general rule x1 APMD is a good measure for a “decision point”, when a MKT reaches the point of dynamic equilibrium and “decides” to either continue expanding or start contracting. The PriceMap Framework defines this market structure and the APMD represents the distance between these points to dynamic equilibrium.
In the example below the CRUDE OIL contract demonstrates this well over the 3 sessions.
Normalizing Exit Targets
Understanding the relationship between the PriceMap Framework and the APMD provides a metric to normalize exit targets for a TradeStrategy.
As a general rule the APMD should be used as the the minimum expected profit potential for a TradeStrategy executed at one of the PriceMap Action Qualifiers. R LEVEL strategies can go for more and be positioned for a x3 APMD move. A trade from the CriticalRange extremes has a minimum x1 APMD target but should go for x2 APMD and a DIR (Directional) trade x1 APMD. Any Validation level entry should base risk on a ½ APMD reward.
APMD Practical Application
Observing price action and the position of the LTP (Last Traded Price) within the PriceMap Framework provides awareness to the value of an opportunity. Trading tactics can be normalized by focusing signal acceptance at market structure points using the APMD as a measure of profit potential to define exit targets.
Identifying the relationship of LTP and the R LEVEL provides additional insight to the current expectation or “behavior” of price action. Momentum moving in the direction of the Sentiment Bias is more likely to follow through in the direction of that bias. The farther away from sentiment the LTP is, the farther away it is from the real “energy” or “liquidity”. Markets that expand >x2 APMD away from the R LEVEL may start to look “extended” and are more vulnerable to a “contraction” Even if that contraction is only ½ APMD. Keeping TradeStrategy signal acceptance in alignment with the Sentiment Bias is prudent, as is making position size or risk adjustments in accordance to the APMD distance between the R LEVEL and LTP.
Awareness is further enhanced by the significance the level has to the STRUCTURE of the STATE as well as the price segment distance the MKT has already achieved to get to the LTP level.
Example
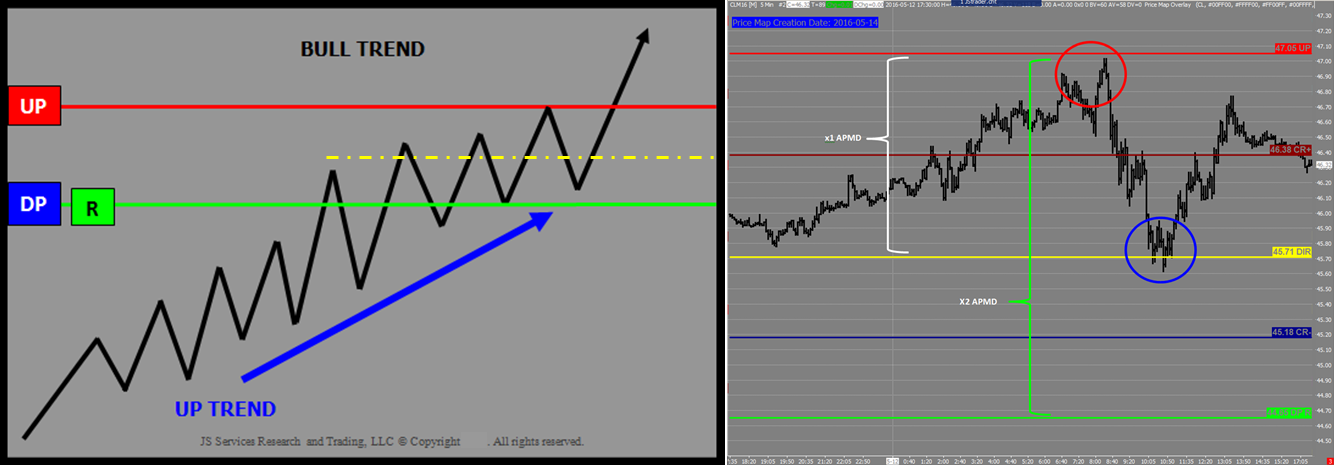
In the example below, the MKT is in a BULL TREND state with sentiment positive, below the market equal to the DP (Downside Pivot). The UP represents the high point for any “contraction” of the positive trend and a valid SELL FADE opportunity. Prior to the UP being tested it was after a x1 APMD move from the DIR (Directional). This FACT combined with the R LEVEL being x2 APMDs away from the UP, identifies lower positive energy at the top of the CriticalRange. The result of these FACTS produce a x1 APMD “correction” back to the DIR where prices stabilize and produce a rally that is in alignment with Sentiment Bias for the trade period.
PlayBook Strategy Themes
MARKET STATE AWARENESS is improved by monitoring PRICE ACTION within MARKET STRUCTURE in the context of the MARKET STATE.
Specific strategy themes are inherent in the state structure dynamic and each theme has a profit expectation that is based on the APMD.
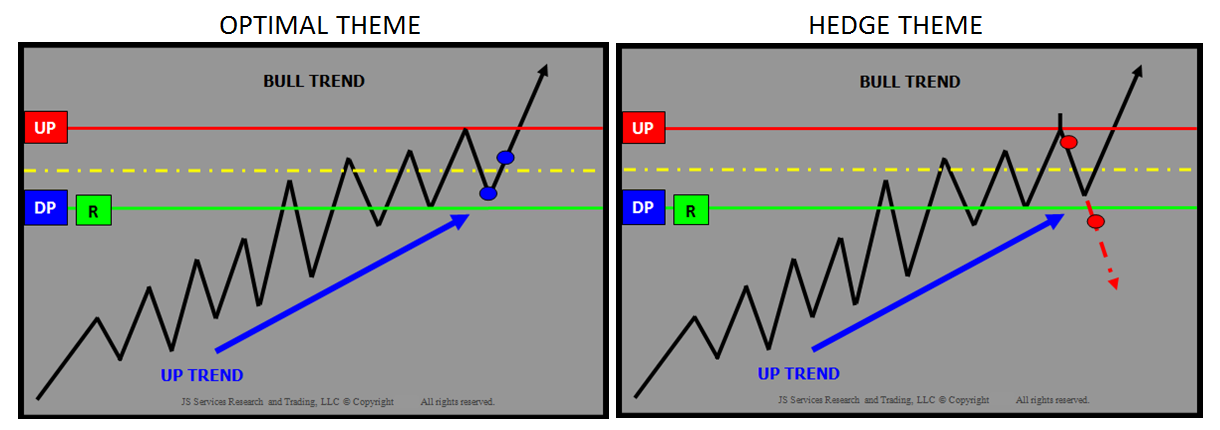
The image below identifies the Optimal and Hedge strategy themes for a BULL TREND MARKET STATE with the R=DP, that played out during the session along with expansion “E” and contraction “C” signals that produced ½ and x1 APMD segment moves.
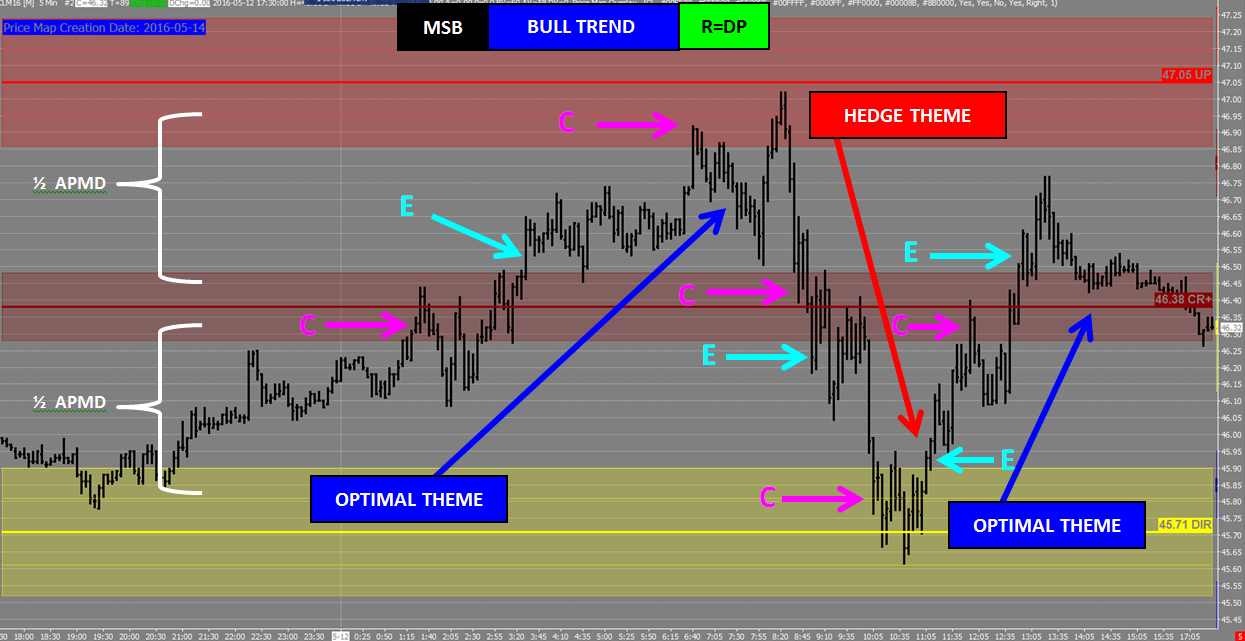
The APMD MarketMetric provides reward expectations to normalize a TradeStrategy by identifying the price segment moves the market is trading in. Many times it is not IF the market is going to make a x1 APMD move it is just a matter of how it is going to do it. Observing price action within market structure in the context of the market state provides awareness to opportunities. The APMD defines what those opportunities are worth so proper size and risk management can be applied.
Applications JSDesktop and Sierra Chart Price Map Chart Overlay


