JSServices Playbook Analytics identify the inherent strategy themes and specific trade opportunities within the dynamics of the current condition as expressed by the state and structure dynamics. This context provides guidance of “what” to do and “where” to do it by highlighting the Hedge Strategy themes that are anticipated to dominate price action if a market breaks structure and transitions into a new risk state. The PlayBook analytics identify specific PriceMap action qualifiers, specifically the R LEVEL and CriticalRange boundaries (UP “Upside Pivot” and DP “Downside Pivot”) that should be used to standardized trade entry techniques to form the basis of an actionable trade strategy.
HEDGE STRATEGY
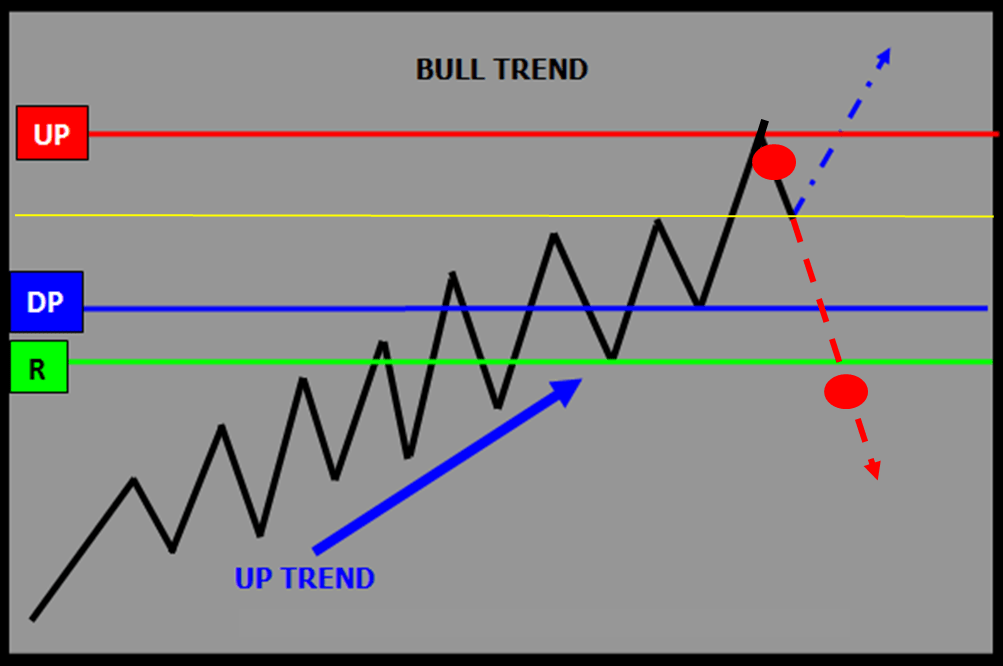
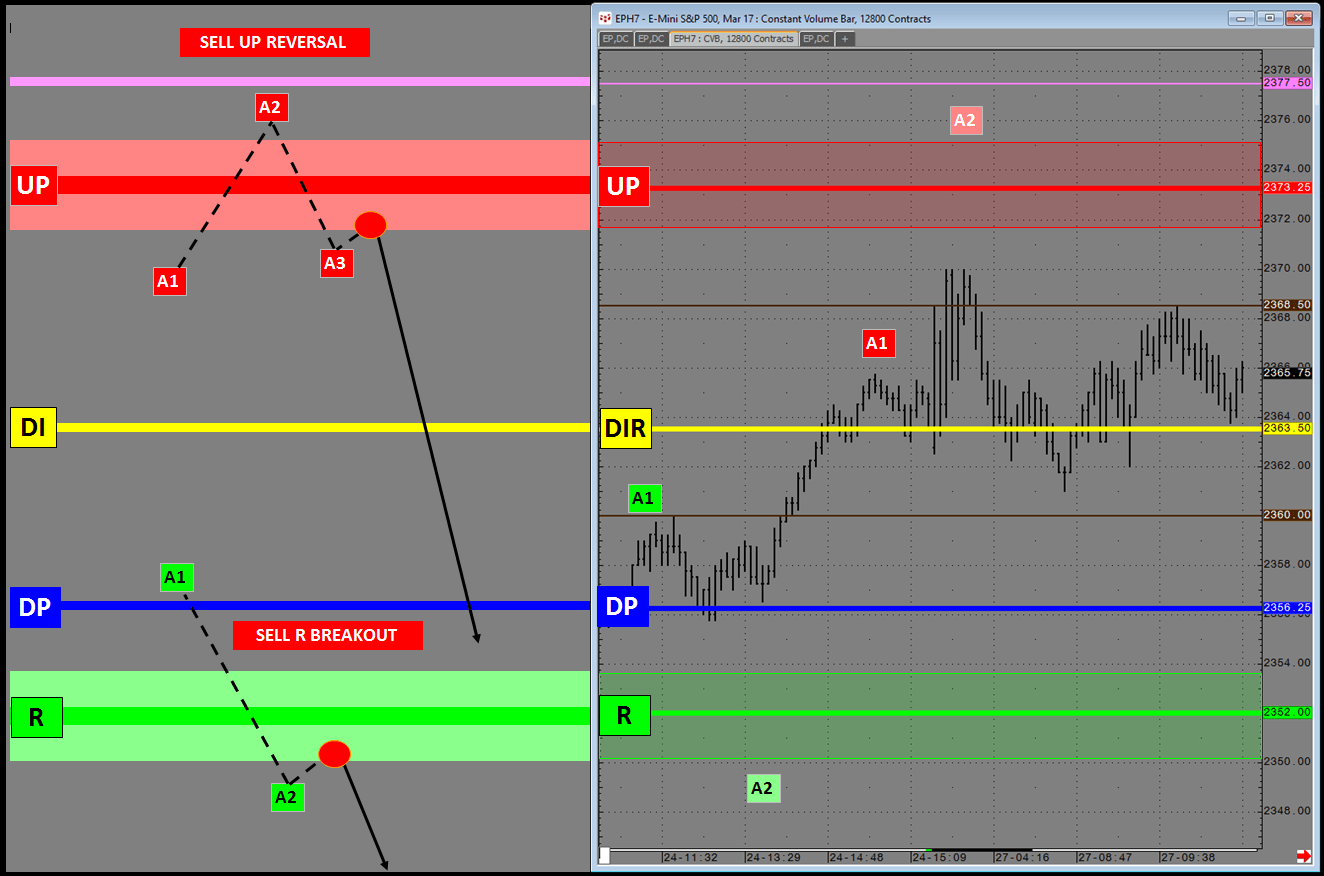
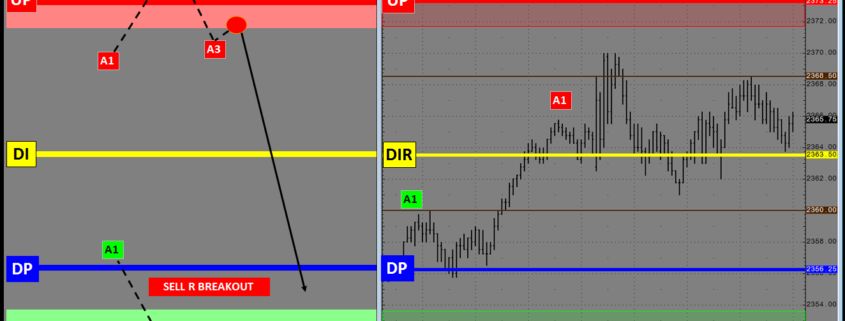
SELL UP REVERSAL | SELL R BREAKOUT
The example above highlights 2 entry tactics for this structure bias, a SELL UP REVERSAL, which can be used to reduce profit-giveback and a SELL R BREAKOUT to mitigate downside risk from a shift in sentiment.
Risk Parameters
The PlayBook Tactics suggest the specific trading techniques that should be used to capture the most favorable risk/reward opportunities within each Strategy Theme. Each Tactic provides the best entry and exit technique and its optimal price level. The very specific nature of the PlayBook Tactics makes them ideal as the basis for a systematic approach to trading or an automated trading system.
The Risk Parameter Market Metrics are used to identify the optimal entry level and the surrounding acceptance zone in which an opportunity remains valid when executing a specific trade tactic. The Market Metric boundaries offer a unified approach to optimized entry and exit tactics across all markets and asset classes.
RISK PARAMETERS
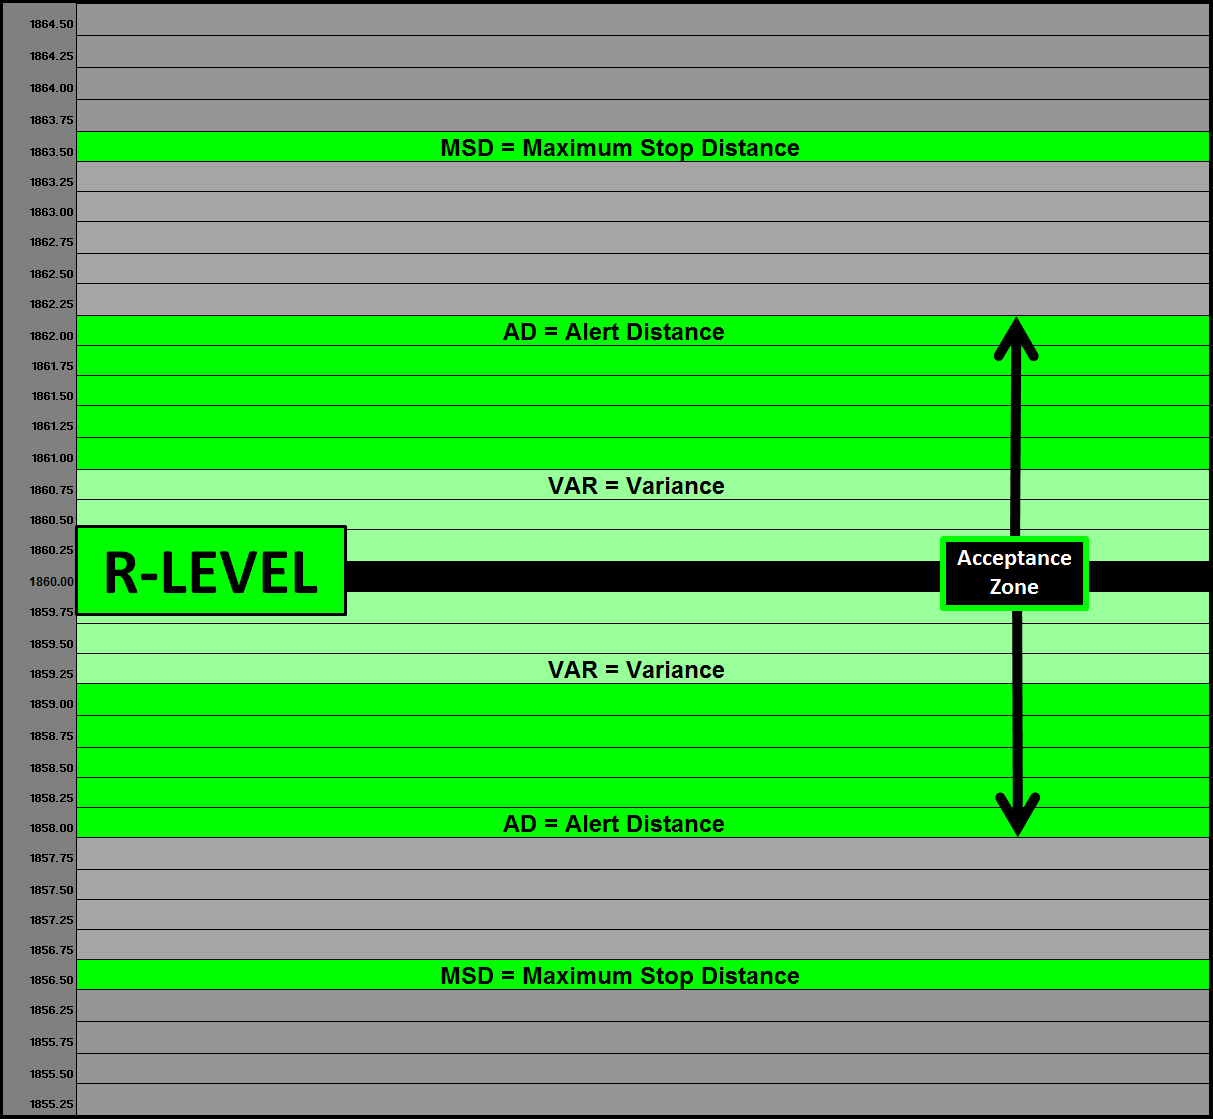
R-LEVEL Market Metrics VAR, AD, MSD
Hedge Strategy Overlay Example
A net long stock position that has a high correlation to the SP500 has 2 basic risks associated with it. Downside Failure Risk and Profit Give-back Risk. The diagram below provides a real-world example of how the trade entry techniques and risk parameters are used to protect downside failure and profit give-back risk.
HEDGE STRATEGY
 PlayBook Entry Tactics SP500 E-Mini with Market Metrics
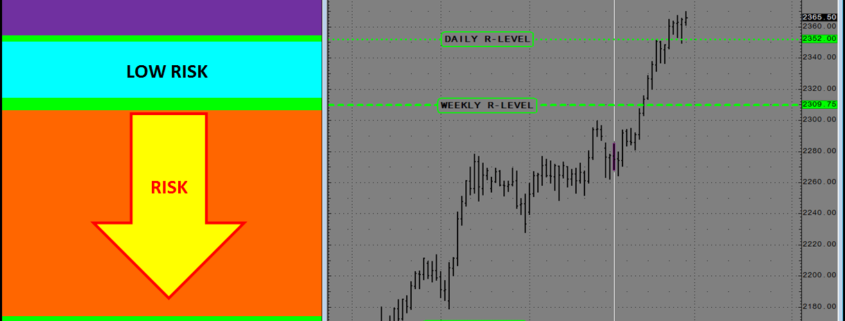
PROFIT GIVEBACK RISK
TACTIC – SELL UP REVERSAL –The SELL UP REVERSAL is designed to reduce profit-giveback by selling the market after an “exhaustive” reversal signal. In the example, conditional A1 (Alert 1) has been met but not A2 (Alert 2) or A3. For the REVERSAL to be “true” each condition must be met 1st to then trigger the SELL UP REVERSAL at which time SELL orders can be placed in the acceptance zone.
DOWNSIDE FAILURE RISK
TACTIC – SELL R BREAKOUT – TACTIC – The SELL R BREAKOUT is used to reduce downside risk by selling the market after negative shift in sentiment. In this example it would be anticipating a broader “corrective” expectation following a Daily sentiment shift targeting the Weekly R LEVEL. In the example, conditional A1 (Alert 1) has been met but not A2 (Alert 2). For the BREAKOUT to be “true” each condition must be met 1st to then trigger the SELL R BREAKOUT at which time SELL orders can be placed in the acceptance zone.
Summary
JSAnalytics provide a systematic approach to create risk defined trades as the basis for a Hedge Strategy Overlay which can reduce risk and profit give-back with defined tactics.
Click here to request a consultation on how JSServices can provide your trading program with a new edge.

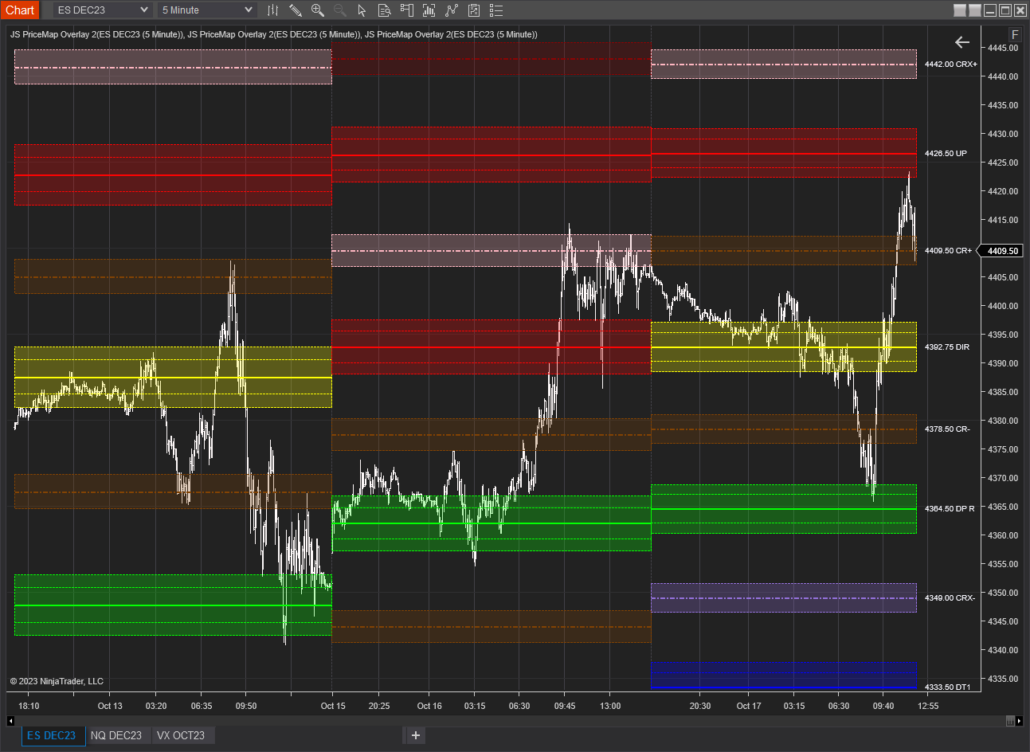


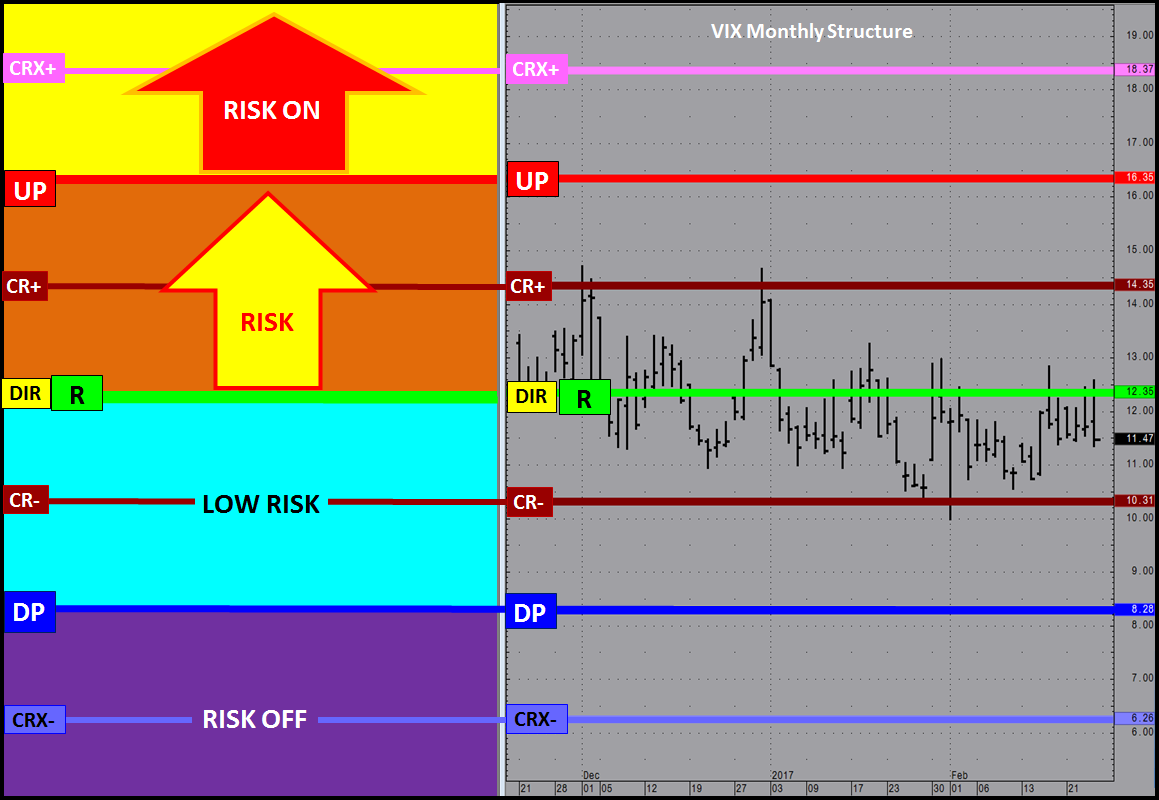
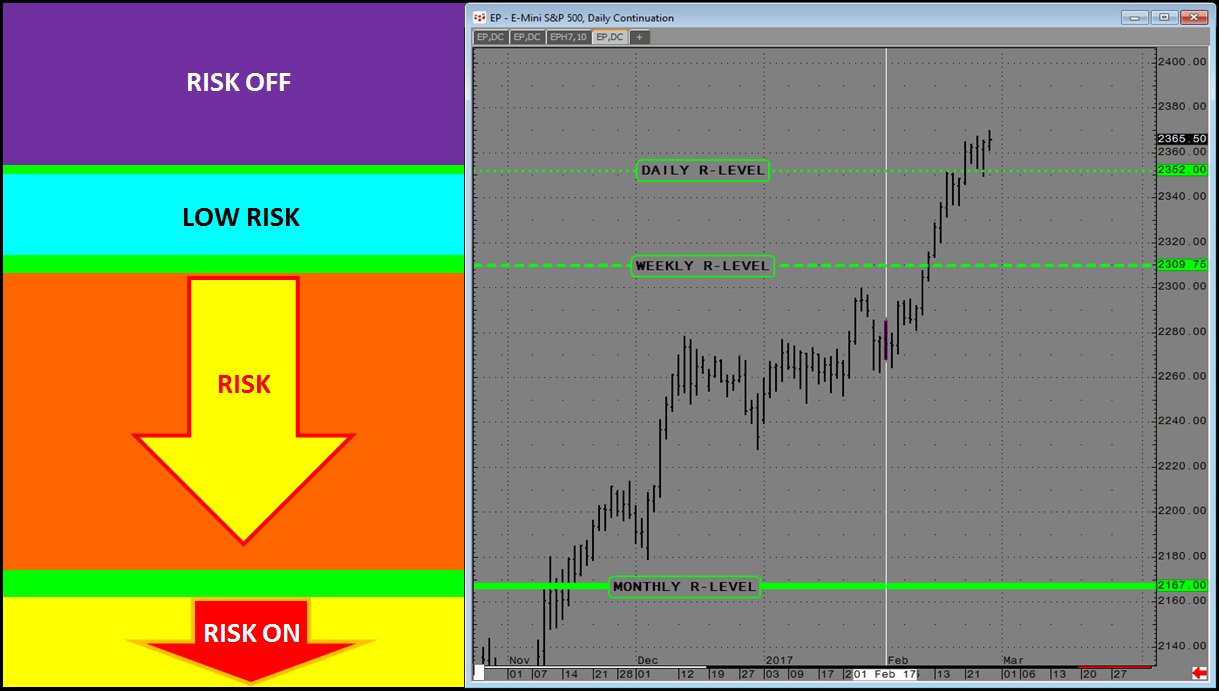 Daily, Weekly, Monthly R-LEVEL Risk Structure