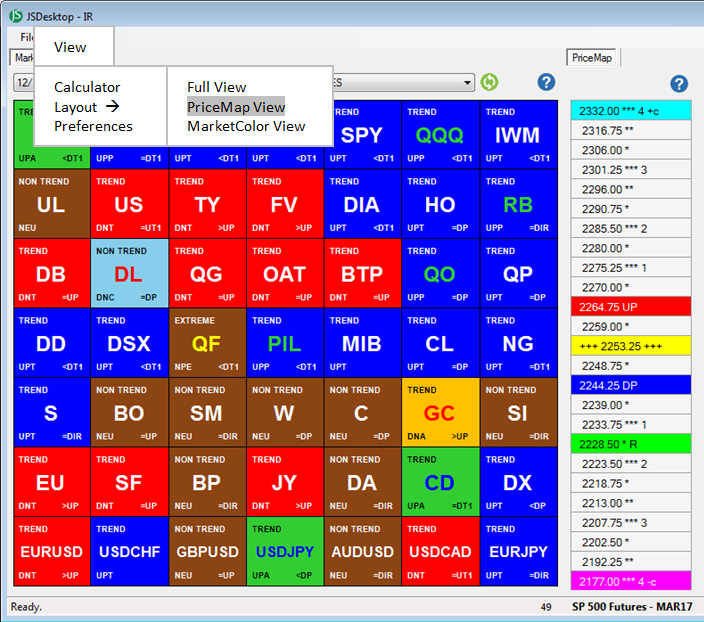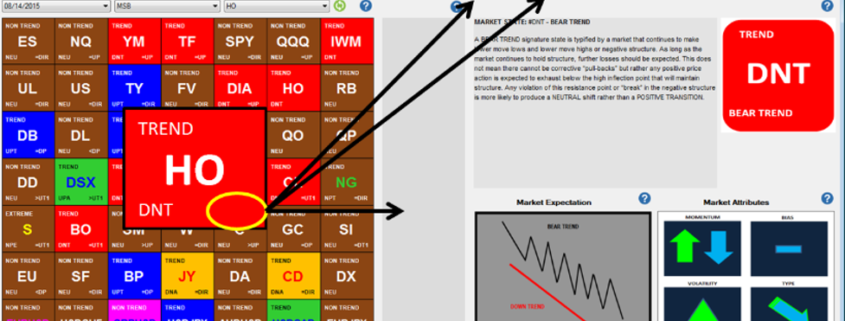
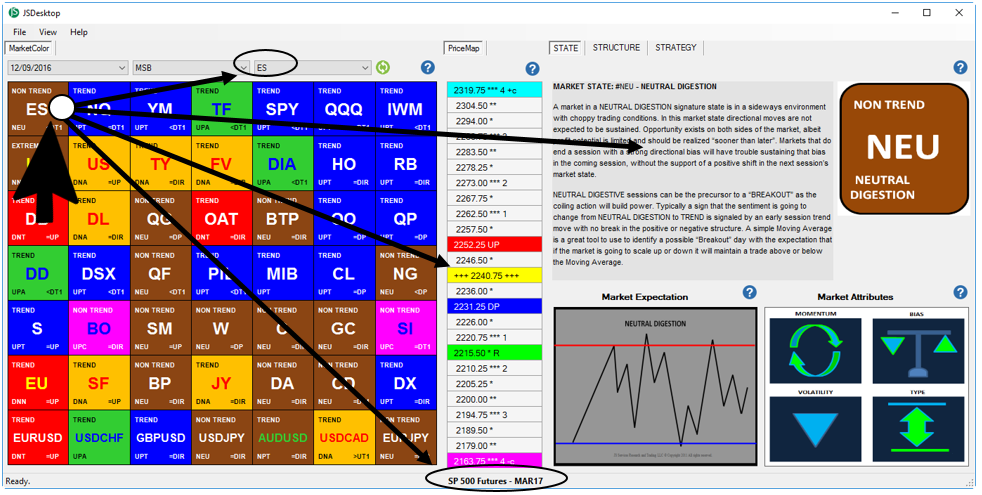
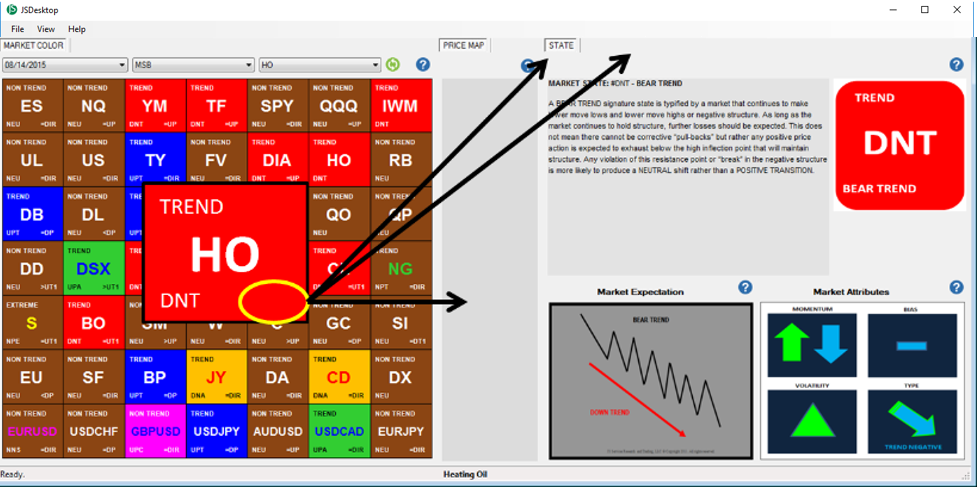
MarketColor Grid
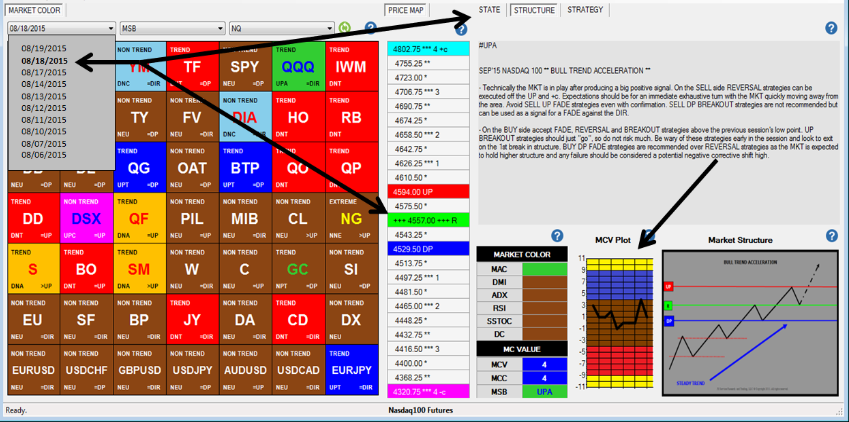
The MarketColor Grid is the control panel that drives the application by clicking on a market of interest on the grid which then updates all analytics to that market. The selected market description and current contract month is listed at the bottom of the application in addition to the symbol pull-down menu, which can be used to Change the symbol selection on the grid.
Features
- The MarketColor Grid provides a color coded display that shows the market State condition for grid symbols including descriptive tags. The MarketColor Grid also functions as the control panel to dynamically updated both the Structure and Strategy sections of the application to match the market that is selected on the MarketColor Grid.
Benefits
- Traders are able to quickly identify markets whose current State and Structure are optimal for specific trading tactics and easily navigate from one market to the next to identify opportunity.
ELEMENTS
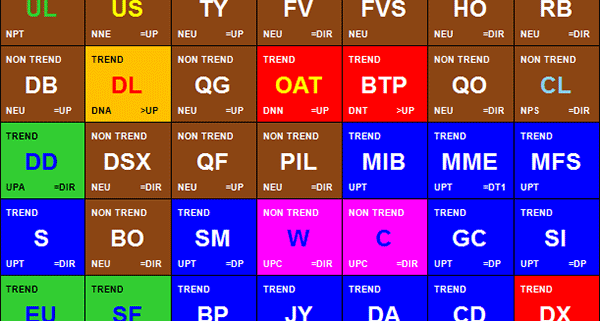
MarketColor Grid Symbol Tile
Each FULL market symbol on the GRID contains 3 descriptive elements which define the market STATE and STRUCTURE:
- General Market State TYPE
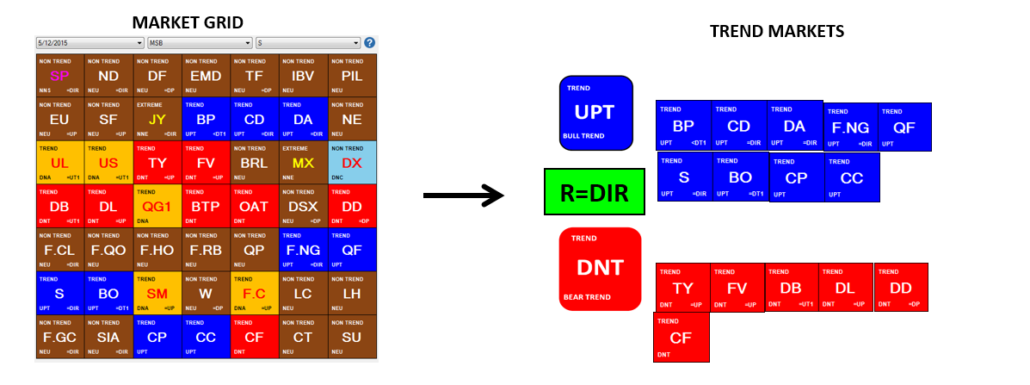
- SIGNATURE Market State #TAG or Market Structure Bias (MSB):
- R LEVEL position (R=)
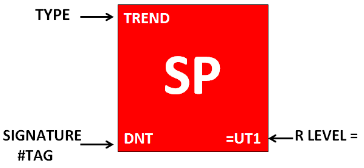
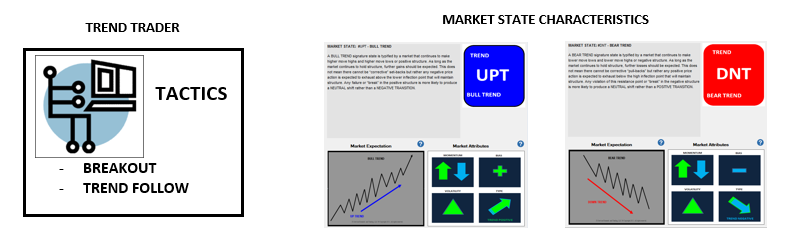
TYPE – The TYPE is the general market State condition. Identifying market State is similar to painting a picture and the TYPE is the base color coat of the canvass. The TYPE consists of the generally accepted market State conditions such as TREND, NON TREND, EXTREME and PIVOTAL. Identifying a market by its general market State TYPE provides context to the underlying condition so trading tactics can be aligned with this fact.
SIGNATURE #TAG – Is the identifier used to classify the signature market State the context of which is defined in the Desktop STATE TAB. The coloring of the grid symbol tile matches the signature State color coding providing an “at a glance” awareness to the technical landscape of symbols in the MarketColor Grid.
R= – Identifies the R LEVEL position on the PriceMap which defines further defines the context of the market State and its Market Structure Bias. The R LEVEL or Sentiment Bias is the price point where sentiment turns from positive to negative and vice versa. Therefore trading below this price level will give the market state expectation a negative tone and above it a positive tone. This fact can dramatically change the market state expectation. For example, a market in positive BULL TREND market state with the R= below the market will have sentiment aligned with the underlying positive trend and a higher price expectation. A market in a BULL TREND with sentiment above the market however would have a negative or “corrective” expectation even though the market is currently in a positive BULL TREND state condition.
Market STATE Only Markets
Markets that do not contain all 3 tab elements and are missing the R= element are Market State only symbols which will not have a PriceMap associated with them nor the STRUCTURE or STRATEGY tabs. Only the Market STATE tab in the Commentary section will be active.
TRADE DATE and HISTORICAL DATA
The Application provides 10 days of historical data which can be viewed through the date pull-down menu. By selecting the desired date from the pull-down menu it will change all the analytics for that date. The MCV Plot on the market STRUCTURE tab will continue to display “todays” full 10 days of historical data regardless of the date selected.
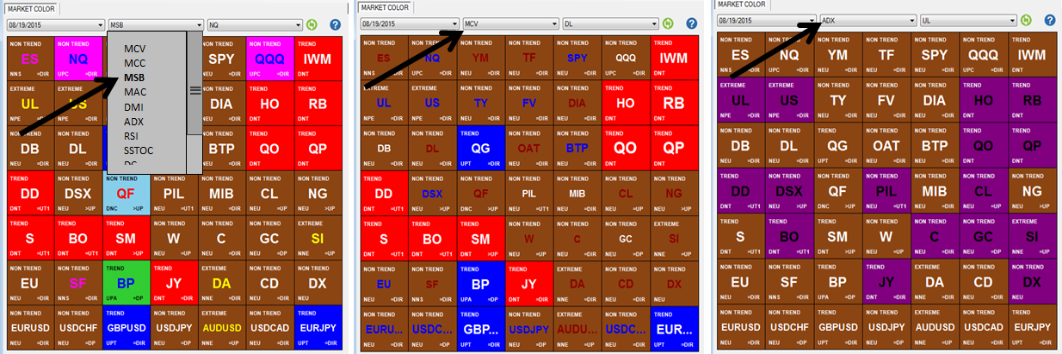
INDICATOR SORT
The MarketColor Grid provides a color coded overview of different MarketColor Indicators. The pull-down menu allows you to select the indicator of interest, which will then dynamically update the MarketColor Grid, displaying each markets color profile for that indicator. The default indicator is the MSB (Market Structure Bias) which provides the highest level of market state definition.
LAYOUT
The entire Application is dynamically re sizable by grabbing a corner with the mouse, hold down a left click and drag to the desired size. The application will dynamically adjust. Preset layouts are also available from the LAYOUT pull down menu with a standard FULL View, PriceMap View which includes the PriceMap and MarketColor Grid only view.