MarketColor Profile Analysis
![]()
MARKETCOLOR PROFILE
Technical indicator analysis by design is lagging. It is always looking backward and “waiting” for the last price to determine a signal. This is an important point, as all technical indicator analysis should be looked at as a foundation for an opportunity rather than a signal for one. Opportunities must be anticipated.
Sample Profile
The Market Color Profile is made up of six classic technical indicators. The numerical and logical results of these indicators are color coded to simplify their interpretation. The technical indicators included in the profile include the following:
- TREND – Moving Average “MA“, Directional Momentum Index “DMI“
- TREND ABILITY – Average Directional Momentum Index “ADX“
- OSCILLATION EXTREME – Relative Strength Index “RSI“
- TURNING POINT – Slow Stochastic “SSTOC“
- EXTREME DEVIATION – Bollinger Band / Keltner Channel / Dynamic Channel “DC“
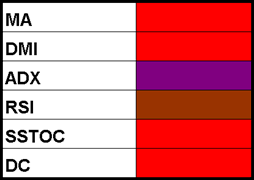
MarketColor Sample Profile
Color Codes
The numerical and logical results of the technical indicators (shown above) are represented by color codes. The table below displays how to interpret the results using the colors shown.

MarketColor Profile Result Color Codes
Analysis Steps
Step 1. Does the market have a trend bias? What is the color position of the DMI and Moving Average?
- A GREEN, BLUE, ORANGE or RED color signifies a trend bias. If the color of either the MA or DMI indicator is BROWN, the other indicator’s trend color should be discounted. If both are BROWN, the market is in a NEUTRAL posture.
- In a NEUTRAL trend bias, the analysis should focus more on the Oscillator indicators. The Moving Average indicator can be in a YELLOW or extreme position which would signal caution to any DMI signal.
Step 2. If the market has a trend, how strong is it? Do both trending indicators confer?
- If both trending indicators have any combination of GREEN | BLUE or ORANGE | RED, the market will have a strong trend bias. AQUA or PINK are transitional colors and should NOT be considered trending.
- After a trend has been determined, the next indicator to look at is the market trending ability or ADX.
Step 3. Does the market have follow through potential?
- An ADX with a BROWN color signals that the market is not showing any trending tendencies and would discount the trend color bias. In this instance, greater weight should be placed on the Oscillator indicators.
- A PURPLE color signals a trending market that will add weight to any trend signal and discount the Oscillator indicators. A trending market with trending tendencies should then view the Turning Point and Dynamic Channel extremes.
Step 4. Is the trend at a turning point?
- The SSTOCH (Slow Stochastic) Turning Point counter trend signals warn that the current trend is ready to take a pause and possibly reverse. A trend reversal signal would have a counter trend action color (GREEN or ORANGE) associated with it and should always be respected. A YELLOW color is a signal that the market is at an extreme, and the trend is exhausting with the possibility of a pause or reversal of the current trend bias.
- Turning point indicators with like trend bias colors will add weight and reinforce the current trend.
Step 5. Is the market at an extreme?
- The Dynamic Channel color profile shows if a market is moving to or is at an extreme. All other colors should be noted for their support for or against the current trend.
Step 6. Is the market in a Neutral posture?
- If the market does not have a trend bias or does not have any trending tendencies, then the Oscillator indicator (RSI) will determine the market’s tone.
Step 7. Is the market overbought or oversold?
- If the Oscillators is at an extreme, it will produce a color signal. The RSI Oscillator indicator can produce a momentum signal with a GREEN (BUY) or ORANGE (SELL) signal associated with it. This signal is usually early in a market’s transitional posture.
Step 8. What is the general tone or MC Value?
- The market’s technical “color” profile is summarized into a single numeric value – the MC Value. The value is based off the color position of the different MarketColor indicator technical systems. Markets with more systems in a positive position will have a greater positive MC Value, and markets with more systems in a negative position will have a more negative value. Markets counter-balanced or NEUTRAL in color will have a value of zero (0).
Analysis Summary
After going over the MarketColor profile a market’s underlying technical tone will be revealed. This result should be used as a component when making trading decisions with or without other supporting technical or fundamental work.
Practical Examples
EXTREME DEVIATION – Dynamic Channel (Bollinger Band)
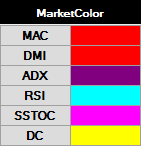
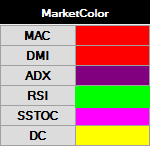
MarketColor uses the Dynamic Channel and Bollinger Band to show the stage of the trend a market is in. When the cells are YELLOW the market is at an extreme, and a pause should be expected. Typically, the market has made a sharp price move, either with or against the current trend.
A price move with the trend signals a sign of exhaustion. The market is a little ahead of it-self and will have difficulty sustaining price moves in the direction of the trend. Early morning follow through in the trend direction are particularly vulnerable and provide good opportunity.
Low Risk Trade Opportunity
- The market has rallied hard for the past 7 days. On the 8th day, the DC (Dynamic Channel) cells light up YELLOW, signaling that the market is at an extreme. The market opens higher. For a scalp, look for opportunities to FADE this strength either at major PriceMap resistance targets or even a better use a REVERSAL entry technique on a failure back through a violated PriceMap resistance level. This type of opportunity is even greater when the extreme signal (YELLOW) is against the underlying trend analysis. This type of signal is corrective and the market is “squeezing” the trend positions.
- The market has been in a 2-week BEAR TREND move and then has a sharp 1-3 day corrective rally, which turns the DC to YELLOW (Extreme). A higher opening, followed by fresh buying, would provide a FADE buy opportunity off major PriceMap resistance levels or even better a SELL REVERSAL opportunity on a violation back down through a violated PriceMap support level. This opportunity is farther reaching, as the signal is in the direction of the underlying trend and provides a low risk entry for potentially the start of the market’s next decline.
TURNING POINT – SSTOCH – Slow Stochastic BUY (GREEN) / SELL (ORANGE) signals
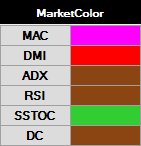
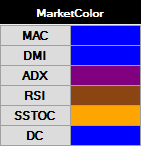
MarketColor uses this indicator to show trend turning points. When the cells are GREEN (Buy) or ORANGE (Sell), a turning point signal has been generated and Price Map moves in the direction of this signal should be respected.
These signals have the highest probability of success and should be expected to last for at least 1 to 3 days.
Low Risk Trade Opportunity
- The market has been strong for the past 10 days. On the 11th day, an ORANGE sell signal is generated on the SSTOC. Traders should look for FADE and REVERSAL opportunities to sell the market against the UP (Upside Pivot) or R (Reversal Number) or on a failure BREAKDOWN from the DP (Downside Pivot), as the chance of a corrective set-back is higher.
- A held trade above the UP will negate this signal for the session.
MOMENTUM – RSI – Relative Strength BUY (AQUA or GREEN) / SELL (PINK or ORANGE) signals

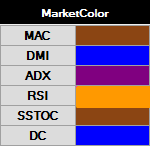
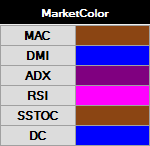
MarketColor uses the RSI indicator to show short-term shifts in momentum.
These signals are most successful in the initial signal session, but GREEN and ORANGE signals can influence the market for up to 3 days. The probability of success will increase when the ADX is in a BROWN (Neutral) position.
Low Risk Trade Opportunity
- The market has been trading directionless for the past 5 days. On the 6th day, a GREEN buy signal is generated on the RSI. Traders should look for buy FADE opportunities off the DP (Downside Pivot), the DIR or on a BREAKOUT above the UP (Upside Pivot), as the probability of a rally is higher. FADE and BREAKOUT entry strategies can be used off the R LEVEL as well.
- A held trade below the DP will negate this signal for the session.
TREND SIGNALS – MA (Moving Average) and DMI (Directional Momentum) BUY/SELL signals
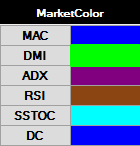
MarketColor uses these indicators to show a market’s trend. Action colors [GREEN = BUY, ORANGE = SELL]in either the MAC (Moving Average Close) or DMI (Directional Momentum Indicator) systems indicate that a new trend signal is being generated.
New signals in one indicator that have a like-color bias in the other indicator should be viewed as a stronger signal. In addition, a PURPLE trending ADX (Average Directional Index) will add value to any buy or sell signal.
Low Risk Trade Opportunity
- The market has been working higher for the past 5 days. On the 6th day, a GREEN buy signal is generated on the DMI. Traders should look for opportunities to buy the market off the DP (Downside Pivot) or R LEVEL as well as a BREAKOUT entry strategies above the UP (Upside Pivot), as the chances of a rally are improved.
- In the above example, the MAC system is already in a Bull Trend (BLUE) and the ADX is PURPLE. This new buy signal in the DMI is both in the direction of the current trend (BLUE MA) and has follow-through potential (PURPLE ADX). Signals like these, if sustained, have the potential to carry the market for 2-5 weeks.
- A BROWN neutral ADX or MAC would take away from the strength of the DMI signal and any lasting effects. Buying opportunities under these circumstances should be considered short-lived, as a choppy trading environment is expected.


