


MarketColor Overview
Most traders define market state as either “trending” or “non-trending”, a black and white definition. MarketColor provides a more granular HD picture of the current trading condition and has identified 26 signature market states each with its own unique characteristics. The result is an objective fact, defining what “is” the current market state, and identifying opportunity “at a glance.”
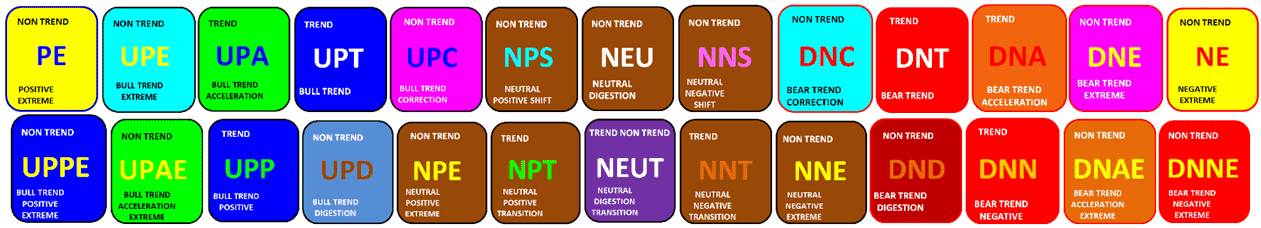
MarketColor Signature State Definitions
MarketColor Technical Profile
The technical foundation of the MarketColor analytics is a set of six classic technical indicators grouped together to form the MarketColor Profile. The profile provides a picture of the technical “guts” that define a market state. The unique feature of the MarketColor Profile is the color coding of the results using our MarketColor Signature Color Codes (shown below). This method of presenting the results affords the ability to quickly breakdown and analyze complex technical information.
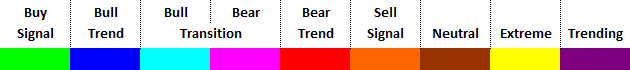
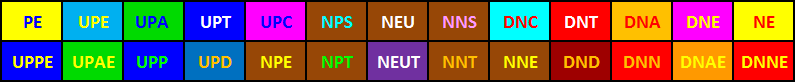
MarketColor Signature Color Codes
MarketColor calculates and analyzes six independent technical indicator systems to determine the market’s technical foundation:
- TREND – Moving Average “MA“, Directional Momentum Index “DMI“
- TREND ABILITY – Average Directional Momentum Index “ADX“
- OSCILLATION EXTREME – Relative Strength Index “RSI“
- TURNING POINT – Slow Stochastic “SSTOC“
- EXTREME DEVIATION – Bollinger Band / Keltner Channel / Dynamic Channel “DC“
The color coded results of these systems (shown below) provide a picture of the market’s technical foundation and offer a simplified way of interpreting them. To learn how to analyze and interpret the MarkeColor Profile, please read the “MarketColor Profile Analysis” article.
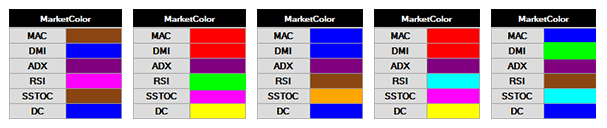
MarketColor Profile Examples
WARNING: Analyzing technical indicator results, even if they are nicely color coded, can be complex for the inexperienced. To simplify this analysis we created the MarketColor Indicators in the next section to summarize the results into a single value that can be easily interpreted.
MarketColor State Indicators
MarketColor Indicators apply proprietary algorithms to compile the MarketColor Profile into a set of values that provide a comprehensive, unbiased definition of what the technical foundation of a market state is. The indicators afford the ability to quickly breakdown the details in the technical makeup of the market, identifying opportunities “at a glance”.
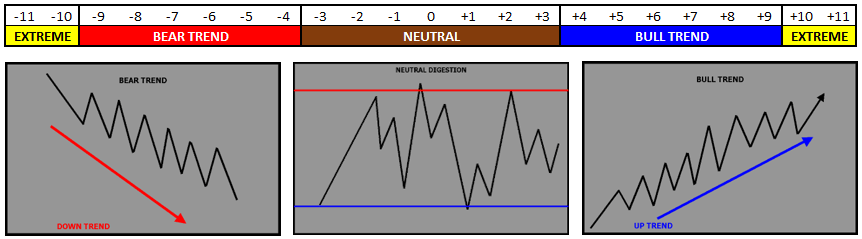
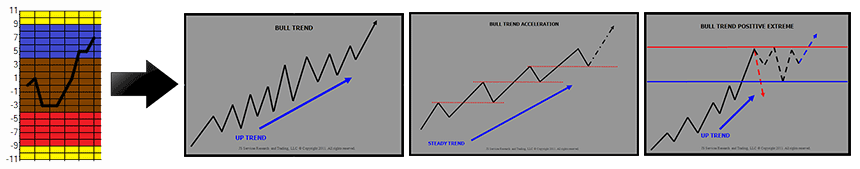
The MarketColor Value (MCV) Indicator quantifies the current market STATE into a single integer value bounded by a scale ranging from +11 to -11. The goal of the MCV is not to be “predictive” but rather define the “what is” technical position of the market. The MCV is interpreted using the table below:
The MarketColor Change (MCC) Indicator gives a market FORECAST by tracking the day-to-day shifts in the MCV. The magnitude of this shift presents further insight of the STATE condition and identifies markets that are technically in “play”. Markets with large technical movement are anticipated to have good trading opportunity with an expectation of healthy price action and increased liquidity of new market participants.
The MarketColor State (MCS) Indicator defines the market state CHARACTERISTICS or the “playing field” for a given trade period. Trading activity is expected to perform within the characteristics of the defined market state, giving the trader a set of expectations to improve awareness and support intuitive decision making.
Click on the topics to learn how the MarketColor Value (MCV) can be used for: Strategy Selection, Size Management, Relative Strength Rank.
MarketColor State Characteristics
MarketColor State Characteristics set a price behavior expectation for a given trade period. They further define the Signature Market States, identified by the MCS Indicator, providing deeper insight into the nuances and “tells” of the condition. The characteristics improve awareness and provide clarity in determining when markets states are changing, so tactics can be optimized by aligning with real time events.
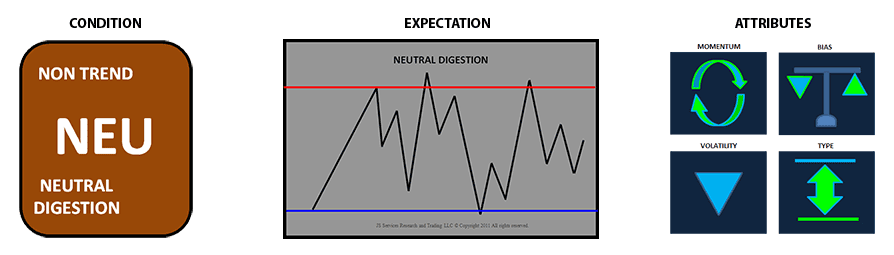
MarketColor Signature State Characteristics
- CONDITION – provides the context that defines the current technical state. Color coding offers an “at a glance” awareness of what the trading environment “is”along with knowledge of the known “tells” that will confirm or deny this expectation.
- EXPECTATION – present a “picture”of the price action that defines the state condition. The image represents what typically should and can be anticipated if the state condition persists.
- ATTRIBUTES – icons provide a unified approach to align trading tactics with specific condition attributes, in terms of momentum, volatility, bias, and trend type.
![]()
