At what time is the daily service available?
The Desktop application is usually updated the prior day by 7:45p.m. central standard time during the week and at 3pm cst on Sunday afternoon prior to the new trading week.
What Markets do you cover?
JS Services covers most major liquid futures, equity, FOREX and commodity markets as well as some volatility indices. Click here for the JSSymbol List
Do you e-mail the service?
Yes and No. The only email service available if for the Daily StockPro service and the Monthly and Weekly PriceMap structure update which is sent out Sunday early evening. There is not email service that duplicates the Desktop Analytics.
Do the analytics work in after hours trading?
Yes. The analysis does take into account non regular trading activity and may be used on any after hours system.
What futures contract month do you analyze?
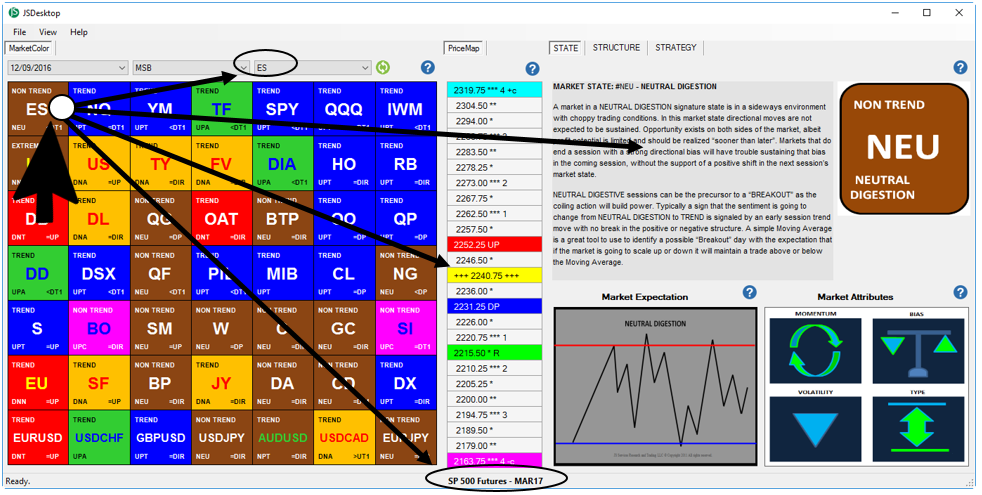
All JS Services futures analytics is done on the lead volume month contracts unless otherwise specified in the market symbol. For instance ED1 represents the 1st contract option and ED4 is the 4th contract option on the strip. If there is not number following the JSSymbol then it should be assumed it is whatever the lead volume month is. To check what option the analytics represent click on the Market grid tile and note the contract description at the bottom of the Desktop.

Is the service only useful for day trading?
The analytics are a representation of the FACTS that provide clarity of the market state condition which can be used to support high frequency, day and swing trading. In addition the technical shifts in state defined by the MarketColor analytics can influence the market for up to 3-10 trading sessions.
JSAnalytics are a versatile trading tool which can be applied to trading of different duration. JSServices does offer Weekly and Monthly PriceMap analytics which provide structure for up to 3 months.
How much does it cost?
Desktop
The cost of the Desktop application is based on the Market Grid type;
Base Grid is $350 per month paid quarterly.
FuturesPro is $450 per month paid quarterly
StockPro is $550 per month paid quarterly and includes Daily Stock email.
Monthly PriceMap Email
The cost of the Monthly PriceMap Structure email update is $550 per month stand alone or $250 per month additional with any Desktop subscription.
Integrations
Trading Technologies – No Charge
CQG – Must subscribe to JSAnalytics through CQG
Bookmap – No Charge for Advanced Subscription, $50 per month additional for basic Bookmap subscribers
Jigsaw Trading – No charge
Sierra Charts – $50 per month paid quarterly
Ninja Trader – $50 per month paid quarterly
JS Algo Execution Templates
JS TT ADL OTA 12 month lease $499 per year per symbol
JS TT ADL OTA customizable purchase – $2500
How are the PriceMap levels derived?
The PriceMap levels are a calculated using a completely systematic proprietary quantitative study.
Practical Application
How can the MarketColor Profile help my trading?
At first glance MarketColor looks complicated with all its colors but in actuality the color-coding simplifies the assimilation of information. Basically the MarketColor profile presents a “picture” of the technical “gut” that define the state condition. With a little study of the color-coding key and what each indicator represents it can provide unique insight to give you an edge in your trading.
- Know the color-code
- Understand the utility of the indicators that make up the profile
- Know the meaning of action color signals (Green, Orange, Yellow)
Daily steps:
- What is the position of the ADX Trending PURPLE or Non Trending BROWN.
- Are there any action color signals (GREEN, ORANGE, YELLOW)
- Is the color profile skewed with Trend colors (BLUE | RED) or Non Trend (BROWN)
Why is Market State so important?
Market State is the technical “playing field” the drama of the trading session is playing out on. Understanding Market State allows you to properly prepare for the trading day and modify your strategies accordingly. Trying to guess if the market is going higher or lower is not defining market state. Market State is not only about a directional bias but also the tone of that bias. Is the expectation for choppy trading conditions or smooth. If you expect choppy conditions you’re not going to get frustrated when your trend following strategy keeps getting stopped out because you won’t be running it. Instead you may shift your outlook to short term “stick and move” type strategies or just not trade. To truly “know” what to do, having a firm understanding of Market State and its characteristics is imperative to long term successful trading.
How can JS Services trading tools improve my trading?
JS Services trading tools provide structure which is based on technical facts. By having a clear understanding of the technical “truths” you are able to view the market through an objective lens and avoid opinionated emotional decisions.


