PlayBook Overview
Evaluating one market signal over another without any supporting context can be a risky venture resulting in dangerous guesswork with the potential of significant trial and error. The Playbook Analytics are the foundation Strategy for the trade period and provide this missing context by identifying the inherent themes and specific trade opportunities within the dynamics of the current condition as expressed by the MarketColor and PriceMap Analytics. Having this context removes the uncertainty of “what” to do and “where” to do it by highlighting the themes that are anticipated to dominate general price action and the specific tactics that should be applied to take advantage of them. The PlayBook Themes and entry Tactics are based on market facts derived from over 30 years of behavioral observations.
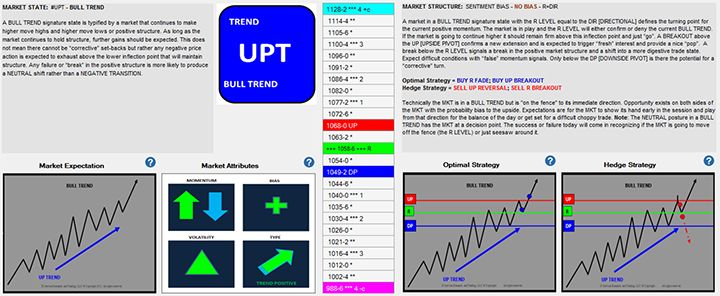
PlayBook Analytics Screenshot
PlayBook Strategy Guide
The PlayBook is your research assistant as it interprets the MarketColor and PriceMap analytics and determines the best opportunities for the trade period. Not the only opportunities but the best risk defined ones. JSServices has created a data base of technical “themes” which documents the inherent behavioral expectations of each condition along with structure boundaries and sentiment bias that define it. From this fact foundation the Playbook highlights the ideal scenarios. There is no subjective “thinking” needed to decide “what” to “do”, just clear objective definition to the Themes that are most likely to dominate price action and a set of specific entry tactics which identify “where” to capture the opportunity.
PlayBook Guide Example
PlayBook Strategy Themes
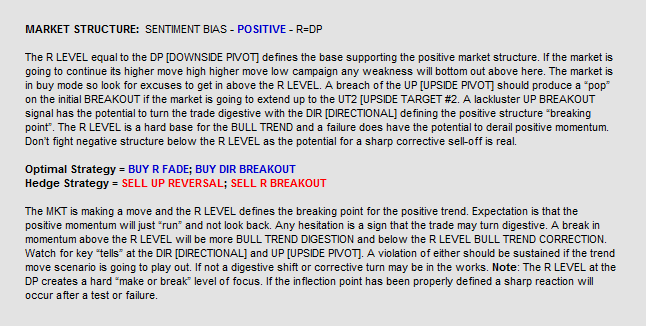
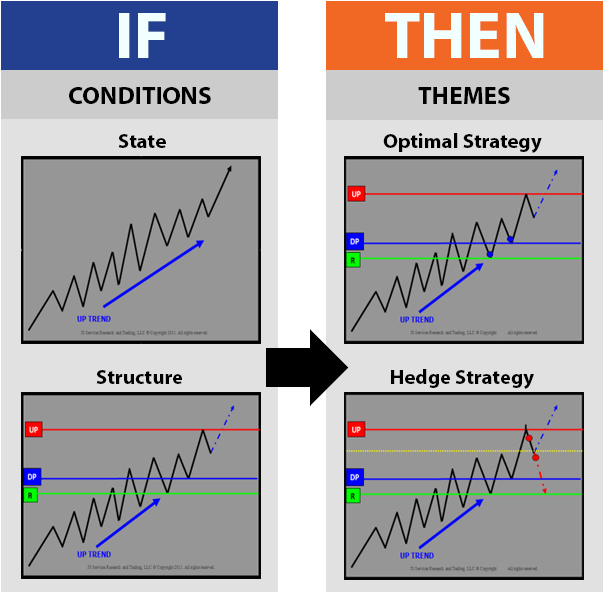
JSServices has identified 26 unique market state conditions each with 9 different sentiment skews, resulting in 234 unique PlayBook Themes or “plays”. Each PlayBook or Strategy Theme offers a virtual IF THEN scenario. IF the market is in this state condition and has this structure THEN these Strategy THEMES should be used to capture the opportunity.
PlayBook Themes
Strategy Theme Classification
The Strategy Themes fall into the following three types:
- Optimal Strategy – These are themes that are in alignment with the underlying state and structure bias. These themes will dominate when the market holds structure.
- Hedge Strategy – Themes that are in alignment with transitional shifts in market state. These themes will dominate when there is a break in market structure.
- Non-Event – If the validity of both the Optimal and Hedge theme have been negated then a Non-Event theme or a sideways digestive trading conditions will dominate price action.
Strategy Theme Application
Withing each trade period a trader’s goal is to identify which Strategy Theme is in command, so trading tactics can be aligned with that fact. IF the structure of the Optimal Theme has been broken THEN this Theme cannot be true for the trade period because if it were true, market structure would have held. The fact that structure did not hold, makes the Optimal Theme false and the fact that the market must be in either a Hedge or Non-Event Theme. If the Hedge Theme structure is broken making it false, then the Non-Event theme is the only true statement. In a Non-Event Theme, trading should be avoided as difficult sideways trading conditional should be anticipated.
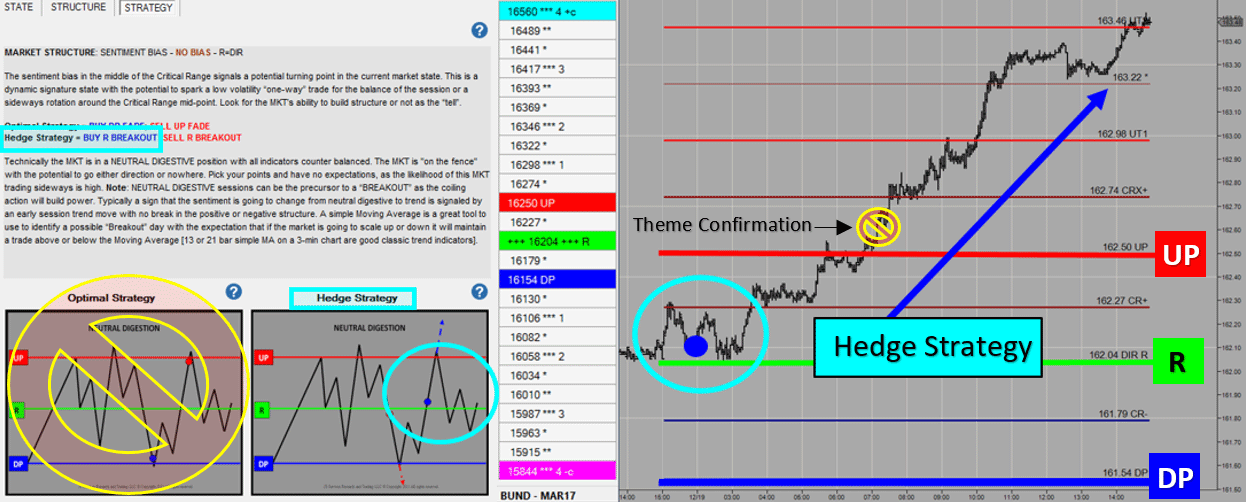
In the real-world example above the Optimal Theme did not hold structure but the Hedge Theme was confirmed.
PlayBook Trade Tactics
The PlayBook Tactics suggest the specific trading techniques that should be used to capture the most favorable risk/reward opportunities within each Strategy Theme. Each Tactic provides the best entry and exit technique and its optimal price level. The very specific nature of the PlayBook Tactics makes them ideal as the basis for a structured approach to trading or as inputs into an automated trading system.

PlayBook Trade Tactics Context
Trade Entry
The PlayBook Tactics offer three specific Trade Entry techniques to capture opportunities in the Optimal and Hedge Strategy Themes. The Trade Entry Techniques represent the most basic approach to trading a price point and fall into the following three categories:
- Fade – This entry technique is used to FADE momentum in Non Trend type market States as well as price action that is counter an underlying TREND or sentiment bias.
- Breakout – This entry technique is used to trade with the momentum of an underlying TREND State as well as to participate in transitional shifts in the market State condition
- Reversal – This is basically a “false breakout” technique and is best used in exhaustive EXTREME conditions and at the structure boundaries of Non Trend type States.
Risk Parameters
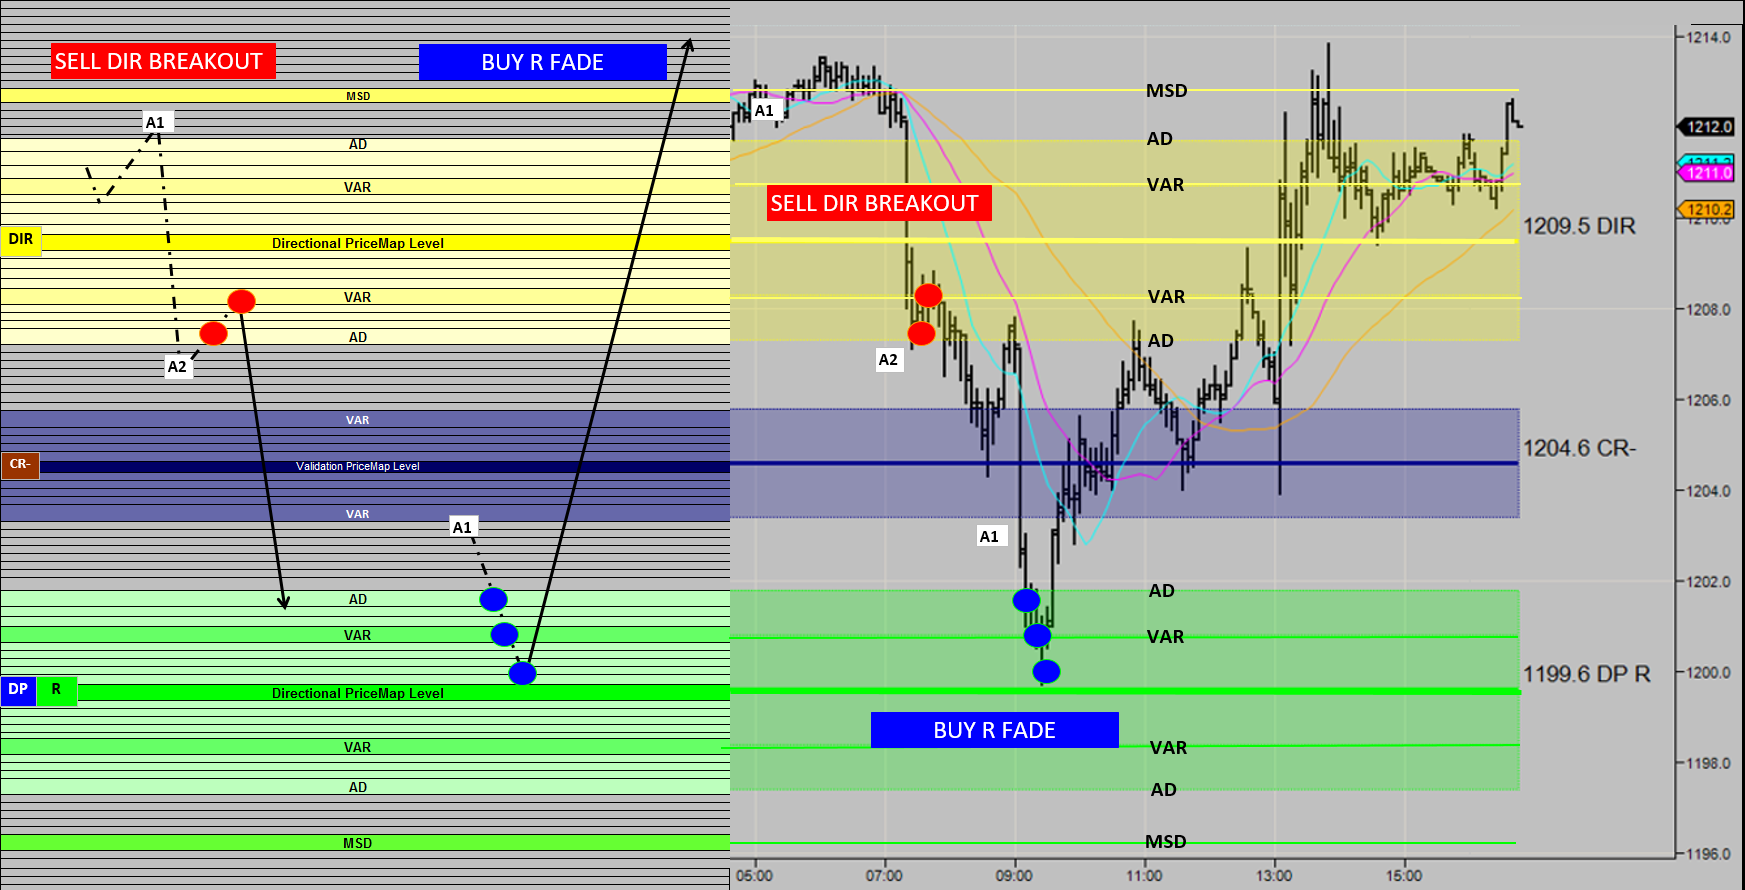
The Risk Parameters identify the optimal entry level and the surrounding acceptance zone in which an opportunity remains valid when executing a specific trade tactic. The reason the Risk Parameters are made up of an entry level and an acceptance zone is that many profitable opportunities cannot be filled at the optimal entry level, in which case the surrounding acceptance zone is used to gauge if the fill price still presents an acceptable trade opportunity. The optimal price level is determined by the PriceMap Directional Level analytics, and the surrounding acceptance zone boundaries are defined by the AD (Alert Distance) and VAR (Variance) PriceMap Market Metrics. The diagram below provides a real-world example of how the entry level and acceptance zone are used.
Optimal Strategy = BUY R FADE | Hedge Strategy = SELL DIR BREAKOUT
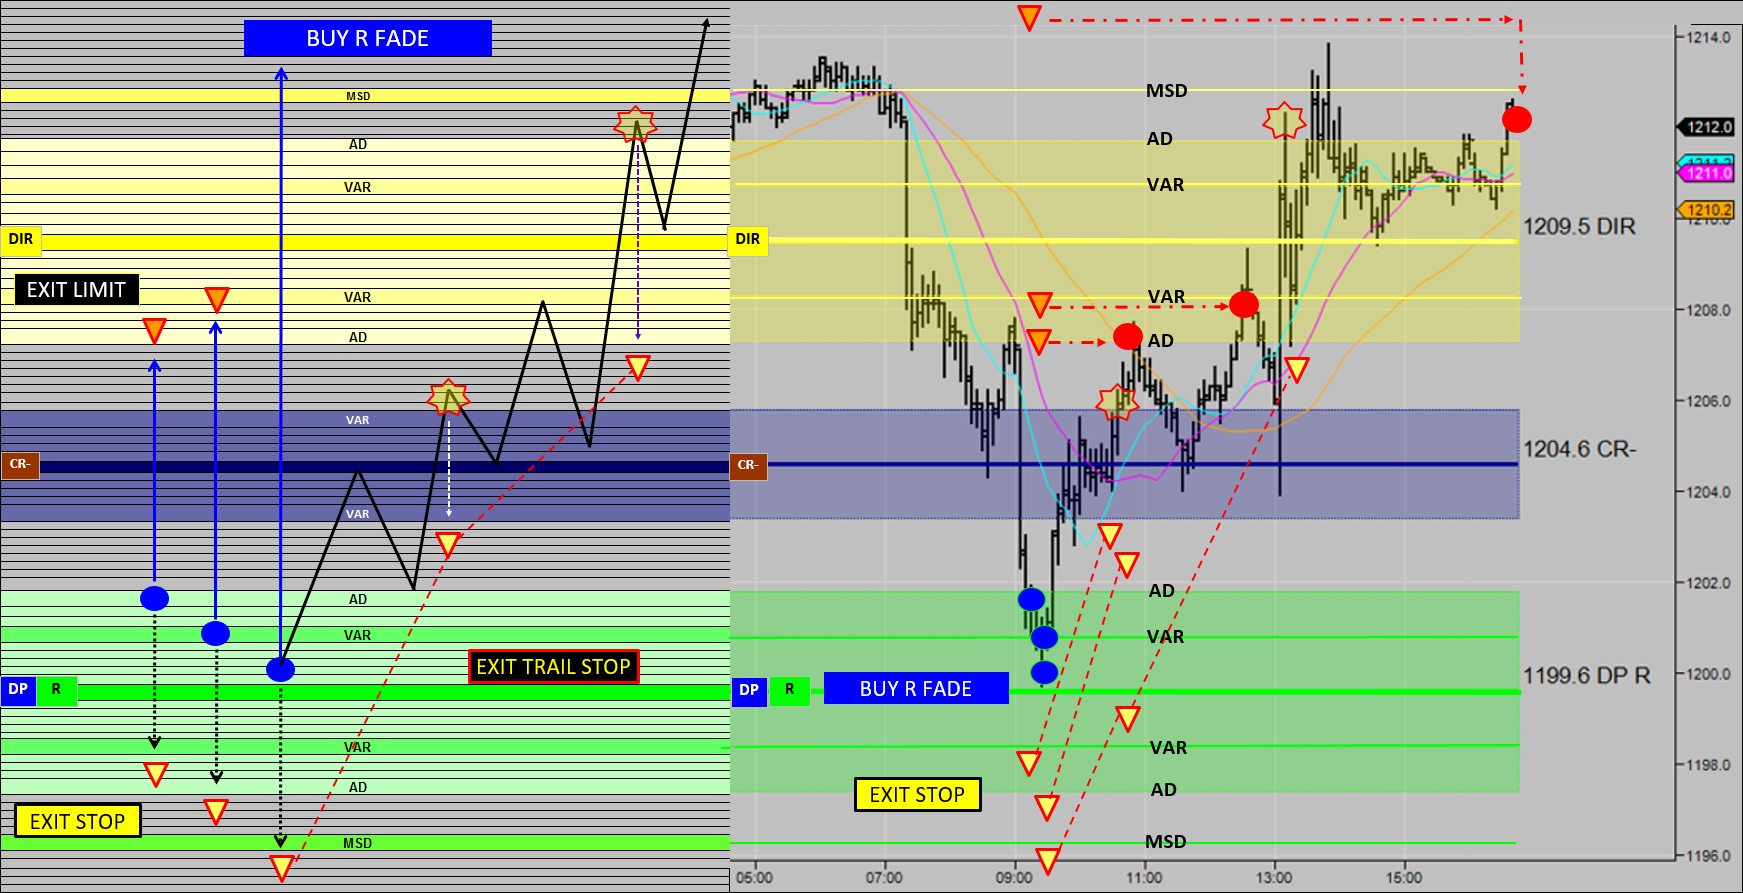
Example: The image above shows the text book description of a BREAKOUT and FADE Entry Tactic on the left with a real market example on the right. Trade Entry techniques use the Risk parameters for 2 primary reasons, as a Conditional Alert and to define an Entry Acceptance Zone.
- Conditional Alert – The Risk Parameters are used to confirm an Entry Technique. In the example the AD metric is used to confirm a SELL BREAKOUT by 1st [A1] trading above the AD metric and then 2nd [A2] below to confirm a SELL DIR BREAKOUT. The AD metric is also used for the BUY FADE as a conditions that to accept a BUY R FADE Entry the market must first trade above the AD [A1] before the BUY FADE is valid.
- Entry Acceptance Zone – After the Conditional Alert confirms the Entry Technique the Risk Parameters are used to spread Entry orders within the acceptance zone. In the example the SELL DIR BREAKOUT is a Hedge Strategy Theme as it is “corrective” against the R LEVEL bias and warrants 2 UNITS entering 1 at the AD and 1 at the VAR metric within the acceptance zone. The BUY R FADE is an Optimal Strategy and warrants a 3 UNIT trade. In the BUY R FADE example the Entry orders are spread in the acceptance zone at the AD, VAR and just “in front” of the R LEVEL.
Incorporating the Risk Metrics into a trade method like in the example above, affords the ability to systematize Entry techniques and create a unified approach across all markets. This feature is especially valuable for Trade Exit decisions.
Trade Exit
The PlayBook Tactics offer three specific Trade Exit techniques to manage risk and maximize potential of Optimal and Hedge Strategy Theme opportunities. The Trade Exit Techniques are dynamically adjusted to align with current market structure and fall into the following three categories:
Optimal Strategy = BUY R FADE
Example: The image above shows the text book description of a 3 UNIT BUY FADE Trade Exit technique on the left with a real market example on the right. Trade Exit techniques use the Risk parameters for 3 primary reasons, Stop Exit placement, Stop Limit placement and Trail Stop adjustments. The Risk Parameters simplify the question of where to place a stop by identifying specific thresholds with the VAR, AD and MSD metrics to place Exit Stops. Trade Exit techniques are optimized by incorporating the acceptance zone and the AD and VAR metrics for the placement of Exit Limits to improve the likelihood that profit targets will not be “missed” by having Exit orders place to close to the target level. The Acceptance Zone determines the bias of a level by where the current price is in relationship to a PriceMap. When price moves through the acceptance zone or the AD metric it signals a bias shift which can be used as a trigger to make Exit Trail Stop adjustments. Note in the real market example above, how when working with a multiple unit trade the trail stops adjustment can be staggered. This process is one that can be optimizedtized for different Entry techniques.
Reward Parameters
The Reward Parameters identify the optimal exit levels for PlayBook Tactics and therefore the reward opportunity associated with a trade. Combining this fact with the market state expectation affords traders a standardized way to forecast a trade opportunity. Many disciplined traders have mastered entry tactics and being patient, waiting for the right moment to enter the market. Once engaged however they lose that patience and exit a trade too early, leaving the profits they patiently waited for on the table. The issue is a lack of facts supporting the true value of an opportunity. The Reward Parameters are determined by the APMD (Average PriceMap Distance) Market Metrics which identify the price segment movement the market is trading in or in other words the reward that the market is “paying out”. Knowing this fact is calming, as it reduces anxiousness and replaces it with conviction to stick with an opportunity.
Exit Limit – Identifying the a good exit target with proper risk ratios can be a challenge. Incorporating the APMD metric solves this question, creating an objective framework for Exit Limit placement across all markets for any Strategy Theme opportunity.
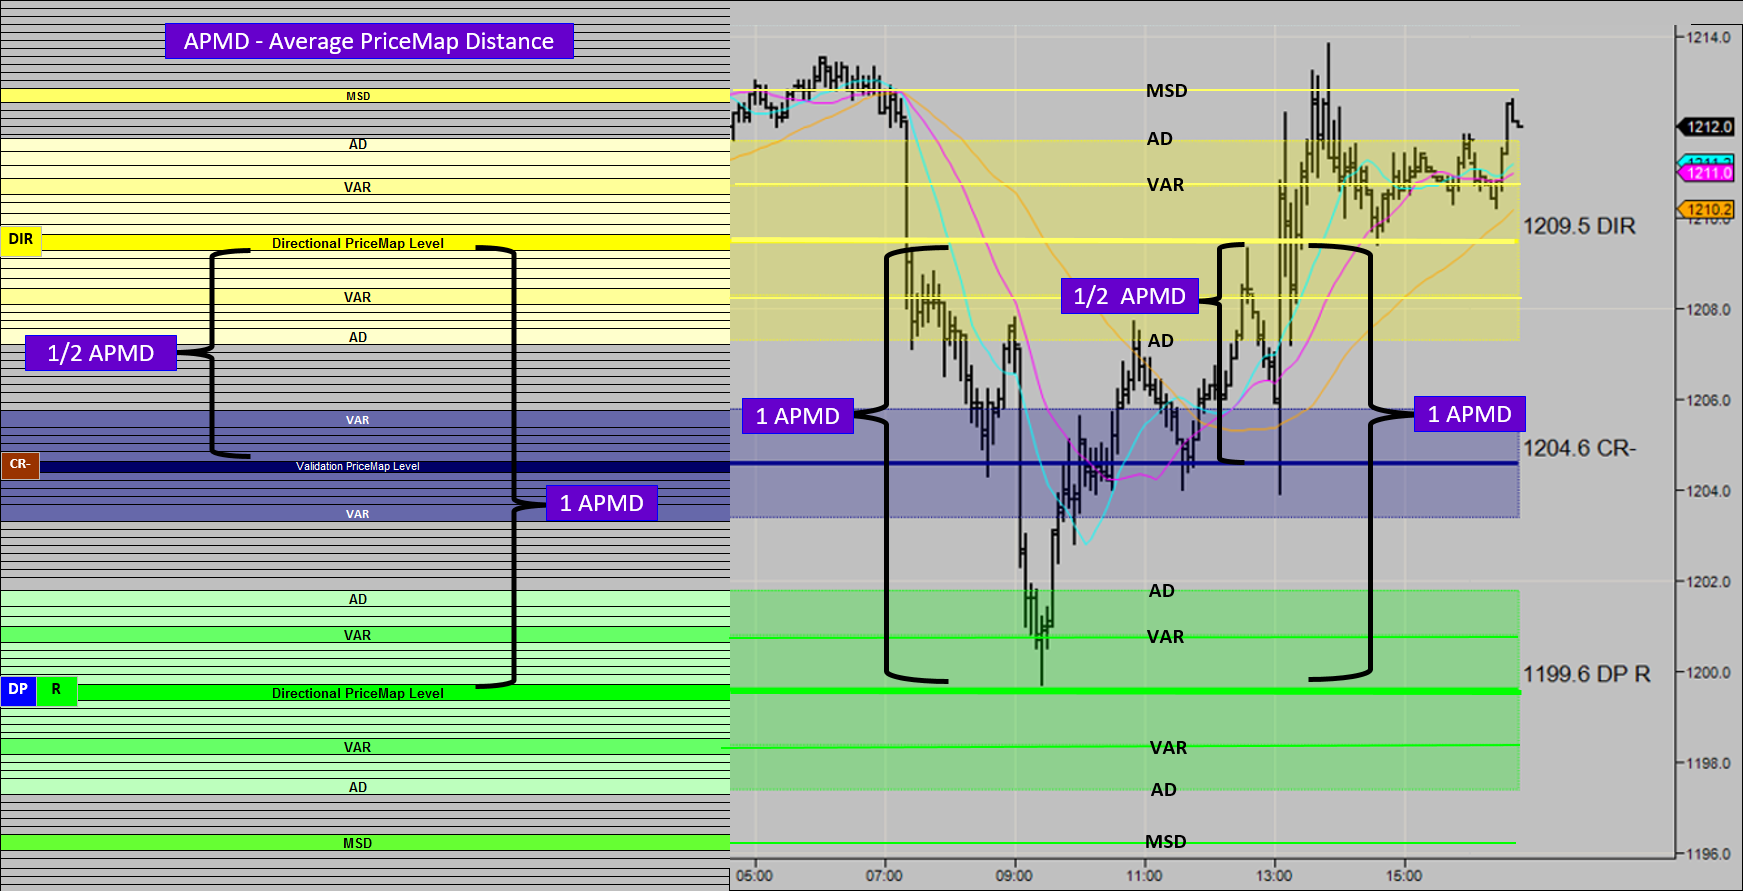
Average PriceMap Distance= APMD
Example: The image above shows the text book description of the Reward Parameter APMD on the left with a real market example on the right. This metric is used to optimize any Trade Exit technique. As a rule of thumb any trade exit technique should target at least 1 APMD. This is the price distance the market is trading in and what it is “paying out”. The price action ebb and flow will trade in 1/2 APMD segments and expand in x2 and x3 segments. Knowing this fact provides a systematic way of establishing the value of an opportunity and can also be used in a general sense to identify markets with good volatility.


